StudentShare
Contact Us
Sign In / Sign Up for FREE
Search
Go to advanced search...
Free

The Regression Analysis - Research Paper Example

Cite this document
Summary
This paper 'The Regression Analysis' tells us that Alfalfa is one of the crops used to determine the good production of dairy cows. It is considered that the rent of the land planted to alfalfa is relative to the other agricultural purposes would be higher in the area with a high density of dairy cows…
Download full paper File format: .doc, available for editing
GRAB THE BEST PAPER92.9% of users find it useful
The Regression Analysis
Read Text Preview

Extract of sample "The Regression Analysis"

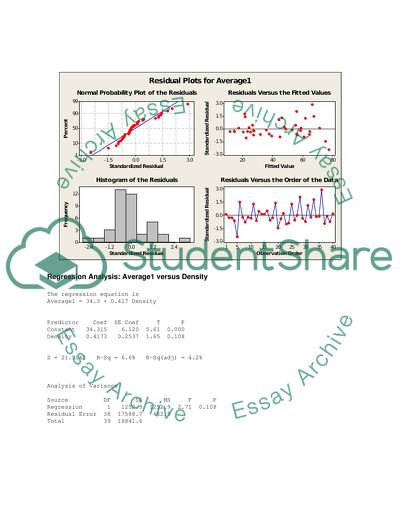
RENTLAND.MTW Alfalfa is one of the crops used to determine the good production of dairy cows. It is considered that the rent of the land planted toalfalfa is relative to the other agricultural purposes would be higher in the area with high density of dairy cows and lower in counties where liming is required. The basis of this can be proving by using the regression analysis, this study shows the relationship of the rent of land to the other factors, based on the data provided. The Analysis of relationship between the fertilizer and the variety of corn in farm land will be analyzed by using one way ANOVA test. This will give us some factors of which is the best fertilizer to be used and the population means yield of corn. Regression Analysis: Average1 versus Average2 The regression equation is Average1 = 3.73 + 0.879 Average2 Predictor Coef SE Coef T P Constant 3.734 3.858 0.97 0.339 Average2 0.87913 0.07824 11.24 0.000 S = 10.7102 R-Sq = 76.9% R-Sq(adj) = 76.3% Analysis of Variance Source DF SS MS F P Regression 1 14483 14483 126.26 0.000 Residual Error 38 4359 115 Total 39 18842 Regression Analysis: Average1 versus Density The regression equation is Average1 = 34.3 + 0.417 Density Predictor Coef SE Coef T P Constant 34.315 6.120 5.61 0.000 Density 0.4173 0.2537 1.65 0.108 S = 21.5142 R-Sq = 6.6% R-Sq(adj) = 4.2% Analysis of Variance Source DF SS MS F P Regression 1 1252.9 1252.9 2.71 0.108 Residual Error 38 17588.7 462.9 Total 39 18841.6 Regression Analysis: Average1 versus Pasture The regression equation is Average1 = 53.7 - 61.8 Pasture Predictor Coef SE Coef T P Constant 53.691 5.144 10.44 0.000 Pasture -61.83 22.55 -2.74 0.009 S = 20.3456 R-Sq = 16.5% R-Sq(adj) = 14.3% The value of coefficient of determination for the average rent per acre planted to alfalfa to average rent paid for all tillable land is 16.5%. Analysis of Variance Source DF SS MS F P Regression 1 3111.7 3111.7 7.52 0.009 Residual Error 38 15729.9 413.9 Total 39 18841.6 Regression Analysis: Average1 versus Liming The regression equation is Average1 = 46.2 - 7.80 Liming Predictor Coef SE Coef T P Constant 46.195 4.671 9.89 0.000 Liming -7.798 6.963 -1.12 0.270 S = 21.9087 R-Sq = 3.2% R-Sq(adj) = 0.6% The value of coefficient of determination for the average rent per acre planted to alfalfa to average rent paid for all tillable land is 3.2%. Analysis of Variance Source DF SS MS F P Regression 1 602.0 602.0 1.25 0.270 Residual Error 38 18239.6 480.0 Total 39 18841.6 For the average rent per acre planted to alfalfa and the average rent paid for all tillable land we found that the coefficient of determination is r2= 0.769, indicating that the ratio of explained variation in y to the total variation in y is 0.709. We can therefore state that 76.9% of the total variation in average rent per acre planted to alfalfa can be explained by the variation in average rent paid for all tillable land. The value of coefficient of determination for the average rent per acre planted to alfalfa and density of dairy cows is r2 = 0.066. This means that the total variation in average rent per acre planted to alfalfa and the density of dairy cow (number per square miles) is 6.6%. In comparing the average rent per acre planted to alfalfa to proportion of farm land in the country need for Pasteur the value of coefficient of determination is r2= .165. This means that for the average rent per acre planted to alfalfa there is 16.5% proportion to farmland in the country need for pasteur. The value of coefficient of determination for the average rent per acre plan planted to alfalfa to average rent paid for all tillable land is r2= .032, which means that 3.2% of the average rent per acre plan planted to alfalfa is proportion to the average rent paid for all tillable land. One-way ANOVA: VA, VB, VC, VD Source DF SS MS F P Factor 3 343 114 0.50 0.688 Error 12 2735 228 Total 15 3078 S = 15.10 R-Sq = 11.15% R-Sq(adj) = 0.00% Individual 95% CIs For Mean Based on Pooled StDev Level N Mean StDev -+---------+---------+---------+-------- VA 4 39.00 8.79 (------------*-------------) VB 4 47.88 23.59 (-------------*-------------) VC 4 50.17 15.67 (-------------*-------------) VD 4 50.33 5.71 (-------------*-------------) -+---------+---------+---------+-------- 24 36 48 60 Pooled StDev = 15.10 Tukey 95% Simultaneous Confidence Intervals All Pairwise Comparisons Individual confidence level = 98.83% VA subtracted from: Lower Center Upper -------+---------+---------+---------+-- VB -22.82 8.88 40.58 (--------------*---------------) VC -20.54 11.17 42.87 (---------------*--------------) VD -20.37 11.34 43.04 (---------------*---------------) -------+---------+---------+---------+-- -20 0 20 40 VB subtracted from: Lower Center Upper -------+---------+---------+---------+-- VC -29.42 2.29 33.99 (---------------*---------------) VD -29.25 2.46 34.16 (---------------*---------------) -------+---------+---------+---------+-- -20 0 20 40 VC subtracted from: Lower Center Upper -------+---------+---------+---------+-- VD -31.54 0.17 31.87 (---------------*---------------) -------+---------+---------+---------+-- -20 0 20 40 The result from the table shows that there is no significant difference between the different set of variety of corn. Because the f computed value 0.5 is lesser than the critical F value which is equal to 3.4903. This shows that even though they differ in variety the always yield in a given plot. On the basis of their standard deviation by analyzing the growth of corn, variety D is greater than the other variety. Based on the result the mean population yield of a corn can be the same for all varieties of corn. There will be difference in the yield if we consider other sources of their differences example is the fertilizer that they are using. One-way ANOVA: F1, F2, F3, F4 Source DF SS MS F P Factor 3 643 214 1.06 0.404 Error 12 2435 203 Total 15 3078 S = 14.25 R-Sq = 20.88% R-Sq(adj) = 1.10% Individual 95% CIs For Mean Based on Pooled StDev Level N Mean StDev -----+---------+---------+---------+---- F1 4 49.33 7.89 (---------*---------) F2 4 45.29 15.82 (---------*----------) F3 4 55.08 21.06 (----------*---------) F4 4 37.67 7.47 (---------*---------) -----+---------+---------+---------+---- 30 45 60 7 Pooled StDev = 14.25 Tukey 95% Simultaneous Confidence Intervals All Pairwise Comparisons Individual confidence level = 98.83% F1 subtracted from: Lower Center Upper ---------+---------+---------+---------+ F2 -33.96 -4.04 25.87 (-----------*-----------) F3 -24.17 5.75 35.67 (-----------*-----------) F4 -41.58 -11.67 18.25 (-----------*-----------) ---------+---------+---------+---------+ -25 0 25 50 F2 subtracted from: Lower Center Upper ---------+---------+---------+---------+ F3 -20.12 9.79 39.71 (-----------*-----------) F4 -37.54 -7.62 22.29 (-----------*-----------) ---------+---------+---------+---------+ -25 0 25 50 F3 subtracted from: Lower Center Upper ---------+---------+---------+---------+ F4 -47.33 -17.42 12.50 (-----------*-----------) ---------+---------+---------+---------+ -25 0 25 50 Residual Plots for F1, F2, F3, F4 The data shows that the computed value for f ratio is 1.06 which is smaller than the tabulated f value which is 3.4903. This mean that there is no difference in using different fertilizer based on the population mean yields of corn. But if we look its standard deviation the value of fertilizer no. 4 is 7.47 which is smaller than the other SD of other fertilizer used. Based on the result we conclude that the population means yield of corn is the same as to the different fertilizer used. There will be difference in yielding if we consider the process of using the fertilizer and other sources which may affect the yielding of corn. Based on the descriptive statically result, the effect of using different fertilizer in different varieties of corn is very small. They differ in their standard deviation and their mean. Due to this we can say that there is an interaction between the different fertilizers used in the variety of corn. Using one way ANOVA test to determine the differences of fertilizer used, the result is that there is no clear evidence of who is the best fertilizer. But if we used the descriptive analysis it is obviously fertilizer 4 is the consistent fertilizer and effective to use in yielding of corn. Read More
Cite this document
  • APA
  • MLA
  • CHICAGO
(“Statistics: Regression with MINITAB Research Paper”, n.d.)
Statistics: Regression with MINITAB Research Paper. Retrieved from https://studentshare.org/science/1526788-statistics-regression-with-minitab
(Statistics: Regression With MINITAB Research Paper)
Statistics: Regression With MINITAB Research Paper. https://studentshare.org/science/1526788-statistics-regression-with-minitab.
“Statistics: Regression With MINITAB Research Paper”, n.d. https://studentshare.org/science/1526788-statistics-regression-with-minitab.
  • Cited: 0 times

CHECK THESE SAMPLES OF The Regression Analysis

Statistics 401 Mod 5 Case - Multiple Regression Analysis

Multiple Regression Name Institution Below is The Regression Analysis and results of the data.... ?  From the computation of The Regression Analysis, I obtained the results shown above using the excel multiple regression.... The Regression Analysis involved using the Housing stats as the Y variables in the excel regression file, and both the interest rate and the Price per board foot as the X variables.... 26 Multiple regression analysis is a data analysis procedure which is used to establish the relationship between a given variable and a set of other two variables....
4 Pages (1000 words) Coursework

Inferential Statistical Techniques

This math problem "Inferential Statistical Techniques" discusses various inferential statistical techniques available to test an idea of the quantitative models such as correlation, regression analysis, ANOVA, independent samples t (or z) tests, and many more.... The inferential statistical techniques correlation or bivariate regression analysis are used for examining the relationship between two continuous variables.... Multiple regression analysis helps in removing this bias by dealing with a large number of explanatory variables....
4 Pages (1000 words) Math Problem

Statistical Analysis of Pig Growth Rates in Vietnam

Table 1 summarizes the results of The Regression Analysis.... regression analysis was applied with the numerical representation of breed as the independent variable and the dependent variable Day 21 average weight.... Data were analyzed by ANOVA, linear models, t-tests, regression, and other statistical methods using Office Excel 2003.... To determine the relationship between the Day 21 average piglet weight and the various influences monitored during the experiment such as breed, the farm of origin, year of birth, litter mortality and birth weight,  the following Ordinary Least Squares (OLS) regression analyses were examined....
8 Pages (2000 words) Research Paper

The Associated Importance of the Linear Models

In this case it has been seen that the major problem that is faced by the researcher in using the linear model is the model specification and this has been defined as the discontinuity design in case of The Regression Analysis. ... These tests include T tests, analysis of variance, covariance as well as The Regression Analysis.... The main statistical analysis that is being conducted in all the included studies is The Regression Analysis.... inear models in statistics are the ones that are used in the research to make the analysis in the fields of the applied as well as social research....
7 Pages (1750 words) Essay

Regression Analysis Questions

However, to understand the intricacies that pertain to each category, for instance, the use of more robust methods of analysis is necessary, such as The Regression Analysis.... For… When making use of The Regression Analysis tool, the three key things worth consideration are the response variable, the explanatory variable, Regression Analysis Example of use of Regression Analysis, and three things to consider With nominal data, an analysis can only give insight into the data because of broad categorizations....
1 Pages (250 words) Assignment

The Future for Financial Stability of Islamic Banks in GCC

In addition, this dissertation Due to their ease of calculation from financial results, financial rations will be used in The Regression Analysis.... n The Regression Analysis of profitability, there will be three dependent variables; return on equity, net profit as well as return on assets....
1 Pages (250 words) Essay

Multiple Flavors of the General Linear Model

nbsp; These tests include T-tests, analysis of variance, covariance as well as The Regression Analysis.... The main statistical analysis that is being conducted in all the included studies is The Regression Analysis.... This paper declares that linear models in statistics are the ones that are used in the research to make the analysis in the fields of the applied as well as social research.... In this list, there are many other methods and these include the factor analysis, cluster analysis as well as the multidimensional scaling as well as canonical correlation and the discrimination function analysis....
7 Pages (1750 words) Assignment

Employee Commitment on Workplace Quality and Its Effect on Firm Performance

There was an analysis showing a remarkable conclusion that those firms found on the 100 Best lists in a popular financial press have relatively better firm performance.... The only drawback of this analysis was its limitations considering that most of those analyses already conducted were theoretical and more experimental rather than into scrutinizing the level of information why for instance those companies on the list of 100 best are better than those companies not on the list....
18 Pages (4500 words) Coursework
sponsored ads
We use cookies to create the best experience for you. Keep on browsing if you are OK with that, or find out how to manage cookies.
Contact Us