StudentShare
Contact Us
Sign In / Sign Up for FREE
Search
Go to advanced search...

Statistics 401 Mod 5 Case - Multiple Regression Analysis - Coursework Example

Cite this document
Summary
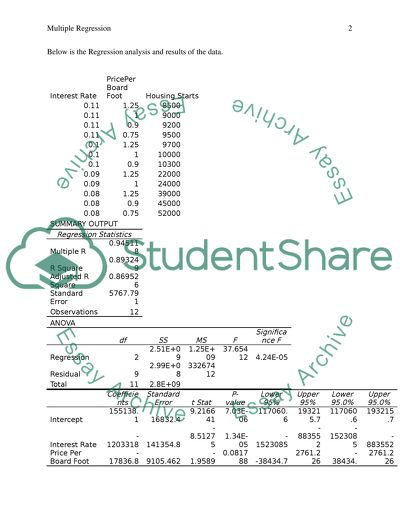
Multiple Regression Name Institution Below is the Regression analysis and results of the data. Interest Rate PricePer Board Foot Housing Starts 0.11 1.25 8500 0.11 1 9000 0.11 0.9 9200 0.11 0.75 9500 0.1 1.25 9700 0.1 1 10000 0.1 0.9 10300 0.09 1.25 22000 0.09 1 24000 0.08 1.25 39000 0.08 0.9 45000 0.08 0.75 52000 SUMMARY OUTPUT Regression Statistics Multiple R 0.945118 R Square 0.893249 Adjusted R Square 0.869526 Standard Error 5767.791 Observations 12 ANOVA   df SS MS F Significance F Regression 2 2.51E+09 1.25E+09 37.65412 4.24E-05 Residual 9 2.99E+08 33267412 Total 11 2.8E+09         Coefficients Standard Error t Stat P-value Lower 95% Upper 95% Lower 95.0% Upper 95.0% Intercept 1551…
Download full paper File format: .doc, available for editing
GRAB THE BEST PAPER91.9% of users find it useful
Statistics 401 Mod 5 Case - Multiple Regression Analysis
Read Text Preview

Extract of sample "Statistics 401 Mod 5 Case - Multiple Regression Analysis"

Download file to see previous pages

In the normal regression analysis, we usually use regression to establish the relationship between a variable and another variable. In such a case, it is establish whether or not the changes in one of the variables affect the other variable. The one which is affected is the dependent variable because it depends on the changes of the other so as to have its changed value. The one which is being depended upon to change is the independent variable because it changes on its own. This is for instance in the case where harvest from a corn field is being tested to establish whether or not it has a relationship with the amount of rainfall in the year.

The harvest is the dependent variable while the rainfall amount is the independent variable. In the case of multiple regression analysis, the independent variables are more than one. . In this analysis where in this case assignment we were looking at housing starts again, this time we added another variable to the equation.  The historical values above give interest rates, lumber prices (dollars per board-foot) and number of starts.  We computed a multiple regression equation using these variables, with starts as the DV.

  Interest and price are the IVs.   From the computation of the regression analysis, I obtained the results shown above using the excel multiple regression. The regression analysis involved using the Housing stats as the Y variables in the excel regression file, and both the interest rate and the Price per board foot as the X variables. Based on the results of the regression as shown in the excel except above, the regression formula that I computed is of the form Y = a1*X1 + a2*X2 + b Where Y = number of housing starts X1 = interest rates a1 = regression coefficient of interest rates X2 = lumber prices a2 = regression coefficient of lumber prices b = constant.

The values of a1 and a2 correspond to the values on the Regression coefficients table shown above. The value of a1 is that on the interest rates coefficients which is -1203318. Likewise, the value of a2 is that on the price per board foot coefficient which is -17836.8. The value of the constant b is also found on the coefficients table. It is the value of the sample estimate of the standard deviation of the error In this case it has the value 155138.1. X1 and X2 are of course variables that correspond to the interest rates and the price per board foot respectively.

In turn, the formula thus becomes:- Y = -1203318*X1 + -17836.8*X2 + 155138.1 Using this formula, it is now much easy to do

...Download file to see next pages Read More
Cite this document
  • APA
  • MLA
  • CHICAGO
(“Statistics 401 Mod 5 Case - Multiple Regression Analysis Coursework”, n.d.)
Statistics 401 Mod 5 Case - Multiple Regression Analysis Coursework. Retrieved from https://studentshare.org/statistics/1483034-statistics
(Statistics 401 Mod 5 Case - Multiple Regression Analysis Coursework)
Statistics 401 Mod 5 Case - Multiple Regression Analysis Coursework. https://studentshare.org/statistics/1483034-statistics.
“Statistics 401 Mod 5 Case - Multiple Regression Analysis Coursework”, n.d. https://studentshare.org/statistics/1483034-statistics.
  • Cited: 0 times

CHECK THESE SAMPLES OF Statistics 401 Mod 5 Case - Multiple Regression Analysis

Organizational Systems Theory

This paper "Organizational Systems Theory" discusses an autopsy of a dead organization such as Enron as extremely valuable for leaders in any era.... Before any manager embarks on a change journey for his organization, such an autopsy would help understand the mistakes that past tycoons had committed....
12 Pages (3000 words) Case Study

Analysis of Statistical Methods

The paper "analysis of Statistical Methods" states that the Pearson coefficient of correlation was computed as -0.... ignificant differences in the rates of recidivism of the juvenile offenders when they are grouped according to their other profile characteristics – age, ethnicity and religion will be confirmed using a bi-directional one-way analysis of variance.... Applicable post hoc analysis or multiple comparisons tests (s) like the Bonferroni test or the least significant difference (LSD) test will be utilized to discover which sub-groups among the aforementioned variables exhibited significant differences....
7 Pages (1750 words) Case Study

Australian Market Vis-A-Vi Macro Environment Factors

nbsp; The current case would be analyzed vis-à-vis macro-environment factors on their impact on the market strategy of the organizations in the new business dynamics.... This paper under the following headline "Australian Market Vis-A-Vi Macro Environment Factors" focuses on the fact that in the fast world advancing technology and rapid globalization, the changing dynamics of global business has become highly competitive....
6 Pages (1500 words) Case Study

Statistical Analysis of Geographical Data

The study "Statistical analysis of Geographical Data" focuses on the critical analysis of geographical data using regression and correlation techniques to establish the relationship between two data sets, categorized as independent and dependent variables.... he data used was downloaded from the UK official national statistics site Neighborhood statistics at the website <http://neighbourhood....
6 Pages (1500 words) Case Study

Time Series Analysis

The study "Time Series analysis" focuses on the critical evaluation of the time series analysis, an array of data points measured at uniform time intervals.... Time series analysis is the method which analyzes the time series data to extract meaningful statistics.... The forecasting methods used in time series analysis are briefed below.... ecompositional analysis: This means deconstructing a time series into the notional components....
6 Pages (1500 words) Case Study

Critical Analysis of Statistical Operation

The study "Critical analysis of Statistical Operation" focuses on the critical multifaceted analysis of a set of logical steps used to resort to any statistical operation as they appear during the operation.... It is easier to have a logical comment but harder to prove the same statistically....
7 Pages (1750 words) Case Study

Cerebral Autosomal Dominant Arteriopathy

This case study "Cerebral Autosomal Dominant Arteriopathy" focuses on an inherited form of the cerebrovascular disease, the result of the thickening of blood vessels' walls where the flow of blood is blocked.... The small blood vessels in the brain's white matter are largely affected....
14 Pages (3500 words) Case Study

SPSS Correlation Analysis and Multiple Regression

The table below presents the regression analysis using the Enter method.... The study "SPSS Correlation Analysis and multiple regression" focuses on the complex correlation analysis and multiple regression of the SPSS.... Forwards Backwards and Stepwise) for fitting regression models involving more than one predictor variable.... Stepwise linear regression is a method used to regress multiple variables while simultaneously removing those that aren't important; forward refers to adding one variable at a time while backward refers to removing one variable at a time....
6 Pages (1500 words) Case Study
sponsored ads
We use cookies to create the best experience for you. Keep on browsing if you are OK with that, or find out how to manage cookies.
Contact Us