StudentShare
Contact Us
Sign In / Sign Up for FREE
Search
Go to advanced search...
Free

Analysis of Tasks for SPSS - Essay Example

Cite this document
Summary
The paper "Analysis of Tasks for SPSS" suggests taht the coefficient of correlation r is 0.8769, almost to 1.00, which shows a very strong positive correlation between a number of assets and sales. If the number of assets increases the total sales will also increase…
Download full paper File format: .doc, available for editing
GRAB THE BEST PAPER97.2% of users find it useful
Analysis of Tasks for SPSS
Read Text Preview

Extract of sample "Analysis of Tasks for SPSS"

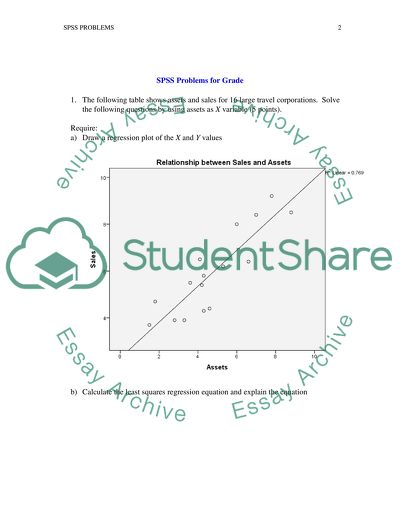
SPSS Problems for Grade SPSS Problems for Grade The following table shows assets and sales for 16 large travelcorporations. Solve the following questions by using assets as X variable (5 points). Require: a) Draw a regression plot of the X and Y values b) Calculate the least squares regression equation and explain the equation From the co-efficient table, a = 2.289 and b = 0.765. Therefore, lease squares regression equation is: Y = 2.289 + 0.765 X The b value of 0.765 means that for each increase in the number of assets the total sales increase by 0.765. The (a) value of 2.289 is the point where the equation crosses the Y-axis. c) Calculate the correlation coefficient (r and the coefficient of determination (r2), and explain what they are used for. r = 0.8769 r2 = 0.769 The coefficient of correlation r is 0.8769, almost to 1.00, which shows a very strong positive correlation between number of assets and sales. If number of assets increases the total sales will also increase. The Coefficient of determination r2 is 0.8769, which means that 87.69 % percent of the variation in the number of assets sold is explained, or accounted for, by the variation in the movement of assets prices. Obviously, in this case, cake price is almost the single factor that influences cake sales. Assets (in billions) Sales (in billions) 7.8 9.2 8.8 8.5 7.0 8.4 6.0 8.0 4.1 6.5 6.6 6.4 5.3 6.2 4.3 5.8 3.6 5.5 4.2 5.4 1.8 4.7 4.6 4.4 4.3 4.3 3.3 3.9 2.8 3.9 1.5 3.7 2. Use 2007 Baseball Team data, let the games won be the dependent variable and total team salary be the independent variable. Solve the following problems (4 points): Require: a) Draw a regression plot of the X and Y values b) Calculate the least squares regression equation and explain the equation. How many additional wins will an additional $5 million in salary bring? From the co-efficient table, a = 69.365 and b = 0.140. Therefore, lease squares regression equation is: Y = 69.365 + 0.140 X The b value of 0.140 means that for each increase in the number of assets the total sales increase by 0.140. The (a) value of 0.140 is the point where the equation crosses the Y-axis. For 5 million salary, Y= (69.365 + (0.14*5) = 70.065 It will be 70 wins c) Calculate the correlation coefficient (r) and the coefficient of determination (r2), and explain what they measure. r = 0.505 r2 = 0.255 The coefficient of correlation r is 0.505, which shows a moderate positive correlation between the total number of wins and the team salary. If number team salary increases the number of wins also increases. The Coefficient of determination r2 is 0.255, which means that 25.5 % percent of the variation in the number of wins is explained or accounted for, by the variation in the team salary. d) Test the hypothesis that the two variables, games won and team salary are independent of each other in the population at 5% significant level. H0:  = 0 (The correlation in the population is zero) H1:   0 (The correlation in the population is different from zero). Significant level  = .05 Reject H0 if p value <  From the table the p-value is 0.04 H0 is rejected because p-value = 0.04 and therefore is smaller than the 95 % significance level. Therefore, there is strong evidence that the true population correlation for these two variables is not zero. 3. Revisit the CEO pay and firm performance problem you did for SPSS 4. In SPSS Assignment 4, you did a scatter plot to examine the relationship between the compensations of CEOs in the tourism industry and their respective firms’ performance measured by revenues. In this exercise, you are asked to test if there is any significant relationship between CEO compensation and firm performance using simple regression analysis (4 points) CEO’s name Type of industry Annual Compensation Company revenue Mr. Lyle A. Berman LACO (Leisure) 683k 53.35 M Mr. James W. P. Reid-Anderson SIX (Leisure) 2.78M 1.15B Mr. Matthew A. Ouimet MGM (Leisure) 2.47M 1.14B Mr. Arnold W. Donald CCL (Leisure) 1.92 M 15.82B Mr. Bradley D. Tilden ALK (Airline) 1.30M 5.27B Mr. Gary C. Kelly LUV(Airline) 1.77M 18.40B Mr. David Barger JBLU (Airline) 1.03 M 5.74 B Require: a) Draw a regression plot of the X and Y values b) Calculate the least squares regression equation and explain the equation. Explain the functions of the intercept and the slope. From the co-efficient table, a = 1.697 and b = 0.442. Therefore, lease squares regression equation is: Y = 1.697 + 0.442 X The b value of 0.442 means that for each increase in the total revenue there is an increase of 0.442 in the annual salary of the C.E.O. The (a) value of 0.442 is the point where the equation crosses the Y-axis. c) Calculate the correlation coefficient (r) and the coefficient of determination (r2), and explain what they measure. r =4.877*10-3 r2 = 0.2379*10-4 The coefficient of correlation r is 0.004877, which shows a weak positive correlation between the total revenue and C.E.O’s annual salary. If total revenue increases the annual salary of the C.E.O’s also increases slightly. The Coefficient of determination r2 is 0.2379*10-4, which means 0.0024% of the variation of the C.E.O’s salary is accounted for by the total revenue. d) Test the hypothesis that the two variables, CEO salary and firm performance are independent of each other in the population at 5% significant level. H0:  = 0 (The correlation in the population is zero) H1:   0 (The correlation in the population is different from zero). Significant level  = .05 Reject H0 if p value <  From the table the p-value is 0.974 H0 is not rejected because p-value (0.974) is greater than 0.05 and therefore there is strong evidence to show that the true population correlation for the population is zero. 4. Exercise.com (7 points) The U.S. Senate passed S. 1023, the "Travel Promotion Act of 2009" (TPA) in September, 2009. TPA calls for the establishment of the Corporation for Travel Promotion as an independent nonprofit corporation to promote leisure, business and scholarly visits to the U.S. In October, the U.S. House of Representatives passed the Travel Promotion Act (H.R. 1035), sending this bill back to the Senate for one last vote. The U.S. Senate finally passed this Bill (78 to 10) on February 25, 2010 and President Obama signed the Travel Promotion Act of 2009 into law on March 4, 2010. This Act calls for the creation of the Corporation for Travel Promotion (now Brand USA) which will allocate financial resources to promote the U.S. as an international destination. The promotion is funded through a matching program featuring up to $100 million in private sector contributions and a $10 fee on foreign travelers who do not pay $131 for a visa to enter the United States. The fee will be collected once every two years in conjunction with the Department of Homeland Security’s Electronic System for Travel Authorization. No money is provided by U.S. taxpayers. It is estimated that international promotion will generate 1.6 million addition international visitors to the U.S. and create $1.6 billion in visitor spending annually. Japan is targeted as one of the major countries for aggressive promotion by the Tourism Industries Office in the Department of Commerce and Brand USA (the newly created public and private partnership responsible for marketing USA implemented by the Travel Promotion Act). As a tourism market analyst specialized in Japan inbound travel to the U.S., you are very interested in studying the movement of currency exchange rates between U.S. dollar and Japanese yen and its impact on Japanese travel to the U.S. So you want to research the impact, if any, of currency exchange rate fluctuation on Japanese inbound arrivals to the U.S. To perform this study, you need to obtain data from two sources. Year Visitors Exch. Rate 1985 1,496,202 201.05 1986 1,681,071 160.1 1987 2,128,481 122 1988 2,542,140 125.9 1989 3,080,396 143.4 1990 3,231,495 135.05 1991 3,319,934 125.12 1992 3,652,828 124.7 1993 3,542,546 111.72 1994 3,804,551 99.7 1995 4,598,354 103.35 1996 5182555 116.1 1997 5367578 130.15 1998 4885369 113.6 1999 4826077 102.13 2000 5061377 114.39 2001 4082661 131.11 2002 3627264 118.51 2003 3169682 107.05 2004 3748000 103.05 2005 3,884,000 117.84 2006 3673000 119.01 2007 3531000 112.25 2008 3250000 90.36 2009 2918000 92.23 2010 3386000 81.54 2011 3250000 77.4 2012 3698000 85.88 Require: a) Draw a regression plot of the X and Y values b) Calculate the least squares regression equation and explain the equation. From the co-efficient table, a = 5444427.790 and b = - 15874.529 Therefore, lease squares regression equation is: Y = 5444427.790 - 15874.529 X The b value of - 15874.529 means that for each decrease in the exchange rate there is increase in the total number of visitors from Japan by 15875 c) Calculate the correlation coefficient (r) and the coefficient of determination (r2), and explain what they measure. r = -0.4099 r2 = 0.168 The coefficient of correlation r is 0.004877, which shows a moderate negative correlation between the exchange rates and the number of Japanese visitors’. It therefore means that if the exchange rate decreases the number of Japanese visitors’ increases moderately. The Coefficient of determination r2 is 0.168 which means 16.8 % of the variation of the number of visitors is accounted for by the exchange rate. d) Write a brief report to the Director of Tourism Industries Office to explain if foreign exchange rate between $ and ¥ is an important factor in influencing Japanese travel to the U.S. in the last 28 years. H0:  = 0 (The correlation in the population is zero) H1:   0 (The correlation in the population is different from zero). Significant level  = .05 Reject H0 if p value <  From the table the p-value is 0.03 H0 is rejected because p-value (0.03) is less than 95% confidence level and therefore there is strong evidence to show that the true population correlation for the population is not zero. Conclusion: Therefore, a decrease of exchange rates is an important factor in influencing Japanese travel to the US. Read More
Cite this document
  • APA
  • MLA
  • CHICAGO
(“Spss Essay Example | Topics and Well Written Essays - 1250 words”, n.d.)
Spss Essay Example | Topics and Well Written Essays - 1250 words. Retrieved from https://studentshare.org/miscellaneous/1665244-spss
(Spss Essay Example | Topics and Well Written Essays - 1250 Words)
Spss Essay Example | Topics and Well Written Essays - 1250 Words. https://studentshare.org/miscellaneous/1665244-spss.
“Spss Essay Example | Topics and Well Written Essays - 1250 Words”, n.d. https://studentshare.org/miscellaneous/1665244-spss.
  • Cited: 0 times

CHECK THESE SAMPLES OF Analysis of Tasks for SPSS

Internet banking applications

According to the research as soon as technology bulged out from the conventional manual working trends, people who were tired of time consuming repetitive tasks obliged, and accepted it.... The aim of this study is to do a threadbare analysis on internet banking applications that are currently in use in the industry.... The aim of this dissertation is to do a threadbare analysis on internet banking applications that are currently in use in the industry....
9 Pages (2250 words) Research Paper

SPSS Data Analysis

From the paper "spss Data Analysis" it is clear that the output of the spss analysis also shows that most of the Foreign managers consider that the factors: Selection of a suitable Algerian partner, Mutual trust between the partners, Minimizing risks in exploration, production and distribution.... The data gathered from all the participants in the form of filled questionnaires were then arranged as tables in the spss data files in order to be analyzed through the spss processor....
29 Pages (7250 words) Essay

Divisions and Categories of Business Intelligence Technologies

Data mining engage six general groups of tasks.... The actual task revolves around the habitual or semi-automatic analysis of huge quantities of data.... Pre-processing of data is indispensable in the analysis multivariate datasets before the mining of data....
8 Pages (2000 words) Assignment

SPSS for analyzing data with one IV and more than one DV & one-way between subjects MANOVA

You will also need to submit the spss Output files showing the analyses you performed in spss to compute the answers for related questions.... I only have the newest version of spss.... ooking spss for analyzing data with one IV and more than one DV & one-way between s MANOVA This problem set introduces spss for analyzing data with one IV and more than one DV to investigate comparison of means.... se the following information to ensure successful completion of the assignment:• Download the spss/PASW data set that I will upload in a ....
1 Pages (250 words) Essay

SPSS exercises

The study was analysed on spss and a two – way ANOVA was conducted to evaluate their difference in groups, according to gender and disability, and the time spend playing with the kid by their fathers.... Anderson, 2011).... Thus p = .... 56 an indication that null hypothesis is accepted; hence, hair color has a relationship with extroversion. ...
4 Pages (1000 words) Assignment

Using Excel and SPS in a Major Research Paper

In my opinion, using the SPSS functionalities helps to perform a number of tasks more efficiently.... Remember that you will have to communicate your findings clearly to a reader, so the analysis of your data and subsequent presentation of your findings must be clear and accurate.... Importantly, even if you do not have extensive personal knowledge of Statistics, the spss statistical techniques will help you understand and work with your data....
8 Pages (2000 words) Assignment

Synthesis of Systematic Analysis Results

ross-examination and analysis of facts ... t has also prevented analysis of phenomena on the macro-level of how CT and other policies of Western democracies are perceived in the Arab and Muslim world ... n empirical analysis of ethical consideration of digital research ... nterviewing, data collection and analysis using Statistical Programme for Social Science (spss).... egression and factor analysis using spss ...
16 Pages (4000 words) Assignment
sponsored ads
We use cookies to create the best experience for you. Keep on browsing if you are OK with that, or find out how to manage cookies.
Contact Us