StudentShare
Contact Us
Sign In / Sign Up for FREE
Search
Go to advanced search...
Free

Dubai Police Website and Privacy Concern - Statistics Project Example

Cite this document
Summary
This project "Dubai Police Website and Privacy Concern" discusses the contact between the Dubai Police and the people of Dubai. The project focuses on an analysis of the perceived effect of the revelation of fine information to the public. It analyses the level of satisfaction on the tracking system…
Download full paper File format: .doc, available for editing
GRAB THE BEST PAPER95.2% of users find it useful
Dubai Police Website and Privacy Concern
Read Text Preview

Extract of sample "Dubai Police Website and Privacy Concern"

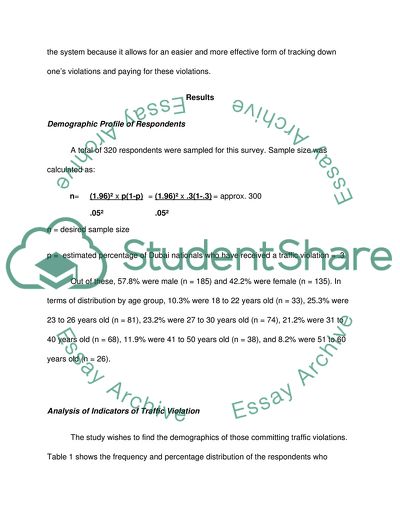
Review of Related Literature People of Dubai consider driving as an important part of their life because of what it offers to their social and professional life. The extremely hot and humid weather conditions for the most part of the year is the main reason why driving around the city is the only means to get around (Bener, et al, 2007). As such, the traffic density in Dubai is considerably high, consequently leading to a high number of traffic violations as well. In an effort to facilitate the contact between the Dubai Police and the people of Dubai, the government established a website which contains a link the stolen cars database and outstanding speeding tickets by motorists (Kostopoulos, 2003). Incidentally, such monitoring is not exclusive to Dubai. Traffic monitoring in England and the USA is done through the use of cameras. Furthermore automated toll collection methods and traffic law enforcements have been carried out through an online system (Blumberg, Keeler, & Shelat, 2005). In effect, massive public surveillance is regularly and extensively being done on the road. However, while intentions for publicly exposing details of traffic violations and fine impositions are not malicious, certain individuals find that such an exposure is an invasion to their privacy. The negative reactions are common in many aspects of the motorist hierarchy, and complaints that such a system invades people’s privacy are abundant. Some people are wary that strangers or ill-thinking people will track them down with the use of the online system of the Dubai Police. However, there are also those who approve of the system because it allows for an easier and more effective form of tracking down one’s violations and paying for these violations. Results Demographic Profile of Respondents A total of 320 respondents were sampled for this survey. Sample size was calculated as: n= (1.96)² x p(1-p) = (1.96)² x .3(1-.3) = approx. 300   .05²   .05²   n = desired sample size p = estimated percentage of Dubai nationals who have received a traffic violation = .3 Out of these, 57.8% were male (n = 185) and 42.2% were female (n = 135). In terms of distribution by age group, 10.3% were 18 to 22 years old (n = 33), 25.3% were 23 to 26 years old (n = 81), 23.2% were 27 to 30 years old (n = 74), 21.2% were 31 to 40 years old (n = 68), 11.9% were 41 to 50 years old (n = 38), and 8.2% were 51 to 60 years old (n = 26). Analysis of Indicators of Traffic Violation The study wishes to find the demographics of those committing traffic violations. Table 1 shows the frequency and percentage distribution of the respondents who received a traffic violation. A total of 66% (n = 212) of the respondents received a traffic violation, with 124 males and 88 females. For both males and females, more respondents received a traffic violation than those who did not receive a traffic violation, n = 124 and n = 88, respectively. For the males, those who are aged from 27 to 30 years old received the most traffic violations while for females, those who were aged 23 to 26 years old received the most traffic violations. Table 1. Frequency and percentage distribution of respondents who received a traffic violation by gender and age group     Received traffic violation? Total     Yes No Gender Age Group Frequency Percentage Frequency Percentage Frequency Percentage Male 18 to 22 6 1.9 4 1.3 10 3.1 23 to 26 32 10.0 8 2.5 40 12.5 27 to 30 39 12.2 21 6.6 60 18.8 31 to 40 26 8.1 7 2.2 33 10.3 41 to 50 12 3.8 8 2.5 20 6.3 51 to 60 9 2.8 13 4.1 22 6.9 Subtotal 124 38.8 61 19.1 185 57.8 Female 18 to 22 17 5.3 6 1.9 23 7.2 23 to 26 26 8.1 15 4.7 41 12.8 27 to 30 10 3.1 4 1.3 14 4.4 31 to 40 20 6.3 15 4.7 35 10.9 41 to 50 15 4.7 3 0.9 18 5.6 51 to 60 0 0.0 4 1.3 4 1.3 Subtotal 88 27.5 47 14.7 135 42.2 Grand Total 212 66.3 108 33.8 320 100.0 Analysis of Indicator of Checking the Details of Traffic Violation The study wishes to find the demographics of those who checked their traffic violations online. From those who received traffic violations, respondents were asked whether they checked the details of their violations on the Dubai Police website. Table 2 shows the results for this inquiry. Figures from Table 2 indicate that 67.9% (n = 144) of those who received a traffic violation checked the details on the Dubai Police website. Out of these, 93 were males and 51 were females. From the males, those aged from 27 to 30 years old were the highest group who checked the details of their traffic violation on the Dubai website (n = 27), while from the females, those who were aged from 23 to 26 years old were the most number who checked their traffic violations online (n = 20). Table 2. Frequency and percentage distribution of respondents who checked the details of their traffic violation by gender and age group Gender Age Group Yes No Total Frequency Percentage Frequency Percentage Frequency Percentage Male 18 to 22 6 2.8 0 0.0 6 2.8 23 to 26 24 11.3 8 3.8 32 15.1 27 to 30 27 12.7 12 5.7 39 18.4 31 to 40 19 9.0 7 3.3 26 12.3 41 to 50 11 5.2 1 0.5 12 5.7 51 to 60 6 2.8 3 1.4 9 4.2 Total 93 43.9 31 14.6 124 58.5 Female 18 to 22 8 3.8 9 4.2 17 8.0 23 to 26 20 9.4 6 2.8 26 12.3 27 to 30 7 3.3 3 1.4 10 4.7 31 to 40 6 2.8 14 6.6 20 9.4 41 to 50 10 4.7 5 2.4 15 7.1 Total 51 24.1 37 17.5 88 41.5 Grand Total 144 67.9 68 32.1 212 100.0 Analysis of Perceived Effect of Revelation of Fine Information to the Public Those who checked the nature of their violations on the Dubai Police website were asked regarding their perceived effect of the revelation of fine information to the public. Overall, the respondents had a perception that there is a somewhat negative effect in the revelation of fine information to the public (Mean = 4.10, SD = .92). Moreover, the study wanted to know if gender played a role in the perceived effect of the revelation of fine information to the public. Results from a t test shows that there was no significant difference in the perceived effect of the revelation of fine information to the public between males (Mean = 4.08, SD = .96) and females (Mean = 4.14, SD = .12), t(114) = - .40, n. s. This means that males and females generally had the same perception that the revelation of fine information to the public had a somewhat negative effect. In addition, it is also in the interest of this research to find out if age played a role in the perceived effect of the revelation of fine information to the public. Analysis of variance on the data reveals that there is no significant difference in the perceived effect of the revelation of fine information to the public among different age groups, F(5, 138) = 1.86, n. s. The respondents were also asked regarding what they perceived to be the effects of revealing fine information on their traffic violations to the public. A summary of these results are found on Table 3, distributed by gender and age group. Because respondents had a generally negative perception on the effect of revealing fine information on their traffic violations to the public, it almost follows that they picked out the negative effects from the list of factors. Analysis of Factors Affecting Perceived Effects of Revelation of Fine Information The study wishes to find the feelings of respondents as a result of the revelation of fine information to the public. Almost half of the respondents felt that revealing fine information to the public intrudes the privacy of individuals at 44% (n = 63) and that it is a threat to individual security at 44% (n = 64). Other respondents noted that revealing fine information to the public made it easier to track the movement of an individual (n = 8), that it was an effective way of controlling fines (n = 4), an easy method of payment (n = 4), and a quick way to get fine information (n = 1). Table 3. Frequency distribution of perceived effects of the revelation of fine information to the public by gender and age group Gender Age Group Frequency of Response Total Intrudes privacy of individuals Threat to individual security Easy to track the movement of an individual Effective way of controlling fines Easy method payment Quick getting of fine information Male 18 to 22 3 3 0 0 0 0 6 23 to 26 10 12 0 1 1 0 24 27 to 30 12 10 2 1 2 0 27 31 to 40 7 9 2 0 0 1 19 41 to 50 4 5 0 1 1 0 11 51 to 60 4 1 0 1 0 0 6 Total 40 40 4 4 4 1 93 Female 18 to 22 4 4 0 0 0 0 8 23 to 26 6 10 4 0 0 0 20 27 to 30 0 7 0 0 0 0 7 31 to 40 6 0 0 0 0 0 6 41 to 50 7 3 0 0 0 0 10 Total 23 24 4 0 0 0 51 Grand Total 63 64 8 4 4 1 144 Analysis of Level of Satisfaction on the Tracking System The study wishes to find the level of satisfaction on the tracking system. The level of satisfaction that respondents had on the fine tracking system of the Dubai Police was also explored in this paper. Overall, respondents were somewhat dissatisfied with the fine tracking system of the Dubai Police (Mean = 3.83, SD = 1.07). Table 4. T test results for effect of gender on satisfaction with tracking system Gender N Mean Std. Deviation Std. Error Mean t df Sig. 95% Confidence Interval of the Difference Lower Upper Male 93 4.08 .958 .099 -0.4 114 0.69 -.369 .245 Female 51 4.14 .849 .119           Moreover, the study is interested to know whether gender and age group played a role in the level of satisfaction with the fine tracking system of the Dubai Police. Results of t test indicate that males (Mean = 3.91, SD = 1.02) were more dissatisfied with the fine tracking system of the Dubai Police than females (Mean = 3.67, SD = 1.13). However, this difference is not significant at the .05 level, t(95) = 1.30, n. s. When grouped by age, analysis of variance was able to determine that the differences in the level of satisfaction of respondents regarding the fine tracking system of the Dubai Police was also not significant at the .05 level, F(5, 138) = 1.60, n. s. Table 5 Anova results for effect of age on satisfaction with tracking system SS df MS F Sig. Between Groups 7.60 5 1.52 1.855 .106 Within Groups 113.04 138 0.82 Total 120.64 143       For those who have visited the online tracking system of the Dubai Police, they were asked if they have experienced an instance where somebody (family member, boss, relative, friend, or unknown person) has tracked their personal information through the Dubai Police’s website. Only 8.3% (n = 12) were actually aware that another person have tracked their personal information through the Dubai Police website and this has happened to them for less than five times. Among them, four respondents felt that it was a positive experience while eight felt that it was a negative experience. Analysis of the Indicators of Satisfaction with Tracking System Table 6. Intercorrelation of variables with Satisfaction with Tracking System   Gender Age Group Effect of revelation Tracked in the past? How was the experience? Pearson Correlation -.111 -.105 .617 .049 -.387 Sig. (2-tailed) .184 .209 < .01 .558 .214 n 144 144 144 144 12 The study wanted to find if the indicators had a relationship with satisfaction with the tracking system. The relationship of the different variables with the respondents’ satisfaction with the fine tracking system of the Dubai police was investigated using correlation. Figures from Table 6 reveal that satisfaction with the tracking system is significantly and positively correlated with the effect of the revelation, r(144) = .617, p < .01. That is, the more negative is the perceived effect of the revelation of traffic violations and fines to the public, the more dissatisfied are the respondents. No other significant relationships were found. It is also of interest to note the relationship of variables through cross tabulation techniques and the chi square test. Relationship between satisfaction and gender, age, effect of revelation, factors of effects, past tracking, and past tracking experience. Table 7. Cross tabulation between gender and satisfaction:   Are you satisfied? Total Satisfied Somewhat satisfied Neither satisfied nor dissatisfied Somewhat dissatisfied Dissatisfied Gender Male 4 6 11 45 27 93 Female 3 5 10 21 12 51 Total 7 11 21 66 39 144 Table 7 shows the cross tabulation of respondents by gender and satisfaction. Figures from Table 8 reveal that there is no significant relationship between gender and satisfaction, Table 8. Summary of Significance Tests for Gender and Satisfaction   Value df Asymp. Sig. (2-sided) Pearson Chi-Square 2.763a 4 0.598 Likelihood Ratio 2.703 4 0.609 Linear-by-Linear Association 1.771 1 0.183 N of Valid Cases 144     Table 9 shows the cross tabulation of respondents by age group and satisfaction. Figures from Table 10 reveal that there is no significant relationship between age group and satisfaction, Table 9. Cross tabulation between age group and satisfaction   Are you satisfied? Total Satisfied Somewhat satisfied Neither satisfied nor dissatisfied Somewhat dissatisfied Dissatisfied Age Group 18 to 22 0 0 3 8 3 14 23 to 26 3 5 3 17 16 44 27 to 30 2 2 6 16 8 34 31 to 40 0 1 2 13 9 25 41 to 50 2 2 6 8 3 21 51 to 60 0 1 1 4 0 6 Total 7 11 21 66 39 144 Table 10. Summary of Significance Tests for Age Group and Satisfaction   Value df Asymp. Sig. (2-sided) Pearson Chi-Square 20.091a 20 0.452 Likelihood Ratio 24.473 20 0.222 Linear-by-Linear Association 1.587 1 0.208 N of Valid Cases 144     Table 11 shows the cross tabulation of respondents by effect of revelation and satisfaction. Figures from Table 12 reveal that there is a significant relationship between gender and satisfaction, Moreover, figures show that satisfaction with the fine tracking of Dubai Police decreased as effect of revelation became less positive. Table 11. Cross tabulation of effect of revelation and satisfaction. Effect of revelation Are you satisfied? Total Satisfied Somewhat satisfied Neither satisfied nor dissatisfied Somewhat dissatisfied Dissatisfied Positive 3 0 0 0 0 3 Somewhat positive 3 4 0 0 0 7 Neither positive nor negative 1 4 6 3 1 15 Somewhat negative 0 2 8 35 22 67 Negative 0 1 7 28 16 52 Total 7 11 21 66 39 144 Table 12. Summary of Significance Tests for Effect of Revelation and Satisfaction   Value df Asymp. Sig. (2-sided) Pearson Chi-Square 139.115a 16 < .01 Likelihood Ratio 82.163 16 < .01 Linear-by-Linear Association 54.438 1 < .01 N of Valid Cases 144     Table 13 shows the cross tabulation of respondents by factors of effect of revelation and satisfaction. Figures from Table 14 reveal that there is a significant relationship between factors of effect of revelation and satisfaction, Moreover, cross tabulation shows that as satisfaction decreased, people were likewise more inclined towards the negative factors of effect of revelation. Table 13. Cross tabulation of factors and satisfaction. Factors Are you satisfied? Total Satisfied Somewhat satisfied Neither satisfied nor dissatisfied Somewhat dissatisfied Dissatisfied Intrudes privacy of individuals 0 2 9 34 18 63 Threat to individual security 1 5 11 30 17 64 Easy to track the movement of an individual 3 2 0 0 3 8 Effective way of controlling fines 2 0 1 1 0 4 Easy method payment 1 2 0 0 1 4 Quick getting of fine information 0 0 0 1 0 1 Total 7 11 21 66 39 144 Table 14. Summary of Significance Tests for Factors of Effect of Revelation and Satisfaction   Value df Asymp. Sig. (2-sided) Pearson Chi-Square 68.437a 20 0 Likelihood Ratio 51.743 20 0 Linear-by-Linear Association 18.229 1 0 N of Valid Cases 144     Table 15 shows the cross tabulation of respondents by existence of past tracking and satisfaction. Figures from Table 16 reveal that there is no significant relationship between existence of past tracking and satisfaction, Table 15. Cross tabulation of tracking and satisfaction   Are you satisfied? Total Satisfied Somewhat satisfied Neither satisfied nor dissatisfied Somewhat dissatisfied Dissatisfied Tracked in the past? Yes 7 10 19 61 35 132 No 0 1 2 5 4 12 Total 7 11 21 66 39 144 Table 16. Summary of Significance Tests for Tracking and Satisfaction   Value df Asymp. Sig. (2-sided) Pearson Chi-Square .922a 4 0.921 Likelihood Ratio 1.492 4 0.828 Linear-by-Linear Association 0.347 1 0.556 N of Valid Cases 144     Table 17 shows the cross tabulation of respondents by experience of tracking and satisfaction. Figures from Table 18 reveal that there is no significant relationship between experience of tracking and satisfaction, Table 17. Cross tabulation of effect of tracking and satisfaction:   Are you satisfied? Total Somewhat satisfied Neither satisfied nor dissatisfied Somewhat dissatisfied Dissatisfied How was the experience? Positive 0 0 2 2 4 Negative 1 2 3 2 8 Total 1 2 5 4 12 Table 18. Summary of Significance Tests for Effect of Tracking and Satisfaction   Value df Asymp. Sig. (2-sided) Pearson Chi-Square 2.100a 3 0.552 Likelihood Ratio 3.001 3 0.391 Linear-by-Linear Association 1.65 1 0.199 N of Valid Cases 12     Based on these relationships, it is now possible to find out if there is a causative effect by these factors on the satisfaction of respondents with the fine tracking system of Dubai Police. In order to provide the answer to this question, multiple regression will be used, with Satisfaction as the dependent variable, and gender, age, effect of revelation, factors of effects, past tracking, and past tracking experience as the independent variables. Analysis from SPSS indicates that gender and existence of past tracking are removed from the regression analysis because they are either constants or have missing correlations. Thus, the only variables left in consideration are age, effect of revelation, factors of effects, and past tracking experience as the independent variables. Table 19. Results of Pearson R correlation R R Square Adjusted R Square Std. Error of the Estimate .847 .717 .555 .636 Figures from Table 19 reveal that the Pearson correlation factor, R2 is .717. This is quite a high correlation value, indicating that 71.7% of the variance in the dependent variable is accounted for by the independent variables. Results from the Anova test found in Table 20 further indicates that the resulting regression is significant, F(4, 7) = 4.429, p = .042. Table 20. Anova for significance of regression equation   SS df MS F Sig. Regression 7.168 4 1.792 4.429 .042 Residual 2.832 7 .405 Total 10.000 11       Table 21 contains the coefficient of the predictors under consideration. Results reveal that only Effect of revelation is a significant predictor of satisfaction, p = .012. Thus, the regression equation for satisfaction may be stated as such, (Eqn. 1) Satisfaction = .973*(Effect of revelation). Table 21. Coefficients of Predictors.   B Std. Error t Sig. (Constant) .298 1.802 .165 .873 Age Group -.061 .120 -.509 .627 Effect of revelation .973 .292 3.336 .012 Factors .400 .198 2.023 .083 Experience of tracking -.459 .408 -1.124 .298 The regression equation indicates that for every increase in the level of effect of revelation which corresponds to a more negative perceived effect, there is an almost equivalent level of increase in the dissatisfaction level of respondents. Because of this phenomenon, it may be also wise to investigate the indicators of the perceived effects of the revelation of traffic violations to the public in order to further understand its effects on the satisfaction with the online tracking system. Analysis of Perceived Effects of the Revelation of Traffic Violations to Public The study wanted to find if the indicators had a relationship with perceived effects of the revelation of traffic violations to the public. Table 22 shows the cross tabulation of respondents by gender and perceived effect of revelation of traffic violations online. Figures from Table 23 reveal that there is no significant relationship between gender and perceived effect of revelation of traffic violations online, Table 22. Crosstabulation of Gender and Perceived Effect of Revelation of Traffic Violations Online.   Effect of revelation Total Gender Positive Somewhat positive Neither positive nor negative Somewhat negative Negative Male 3 4 9 44 33 93 Female 0 3 6 23 19 51 Total 3 7 15 67 52 144 Table 23. Summary of Significance Tests for Gender and Perceived Effect of Revelation of Traffic Violations Online.   Value df Asymp. Sig. (2-sided) Pearson Chi-Square 2.016 4 0.733 Likelihood Ratio 2.987 4 0.560 Linear-by-Linear Association 0.15 1 0.699 N of Valid Cases 144     Table 24 shows the cross tabulation of respondents by age group and perceived effect of revelation of traffic violations online. Figures from Table 25 reveal that there is a significant relationship between age group and perceived effect of revelation of traffic violations online, This indicates that perceived effect of revelation of traffic violations online becomes more negative as people get older. Table 24. Crosstabulation of Age Group and Perceived Effect of Revelation of Traffic Violations Online.   Effect of revelation   Age Group Positive Somewhat positive Neither positive nor negative Somewhat negative Negative Total 18 to 22 0 0 0 6 8 14 23 to 26 0 4 4 27 9 44 27 to 30 1 2 6 15 10 34 31 to 40 0 1 2 10 12 25 41 to 50 2 0 1 6 12 21 51 to 60 0 0 2 3 1 6 Total 3 7 15 67 52 144 Table 25. Summary of Significance Tests for Age Group and Perceived Effect of Revelation of Traffic Violations Online.   Value df Asymp. Sig. (2-sided) Pearson Chi-Square 31.494 20 0.049 Likelihood Ratio 32.645 20 0.037 Linear-by-Linear Association 0.002 1 0.96 N of Valid Cases 144     Table 26 shows the cross tabulation of respondents by existence of past tracking and perceived effect of revelation of traffic violations online. Figures from Table 27 reveal that there is no significant relationship between existence of past tracking and perceived effect of revelation of traffic violations online, Table 26. Crosstabulation of Existence of Past tracking and Perceived Effect of Revelation of Traffic Violations Online.   Effect of revelation   Tracked in the past? Positive Somewhat positive Neither positive nor negative Somewhat negative Negative Total Yes 3 7 13 61 48 132 No 0 0 2 6 4 12 Total 3 7 15 67 52 144 Table 27. Summary of Significance Tests for Existence of Past tracking and Perceived Effect of Revelation of Traffic Violations Online.   Value df Asymp. Sig. (2-sided) Pearson Chi-Square 1.462 4 0.833 Likelihood Ratio 2.224 4 0.695 Linear-by-Linear Association 0.075 1 0.784 N of Valid Cases 144     Table 28 shows the cross tabulation of respondents by past tracking experience and perceived effect of revelation of traffic violations online. Figures from Table 29 reveal that there is no significant relationship between past tracking experience and perceived effect of revelation of traffic violations online, Table 28. Crosstabulation of Past Tracking experience and Perceived Effect of Revelation of Traffic Violations Online.   Effect of revelation   How was the experience? Positive Somewhat positive Neither positive nor negative Somewhat negative Negative Total Positive 0 0 0 3 1 4 Negative 0 0 2 3 3 8 Total 0 0 2 6 4 12 Table 29. Summary of Significance Tests for Past Tracking Experience and Perceived Effect of Revelation of Traffic Violations Online.   Value df Asymp. Sig. (2-sided) Pearson Chi-Square 1.875 2 0.392 Likelihood Ratio 2.46 2 0.292 Linear-by-Linear Association 0.081 1 0.776 N of Valid Cases 12     Based on these relationships, it is now possible to find out if there is a causative effect by these factors on the respondents’ perceived effect of revelation of traffic violations online. In order to provide the answer to this question, multiple regression will be used, with Effect of Revelation as the dependent variable, and gender, age, past tracking, and past tracking experience as the independent variables. Analysis from SPSS indicates that gender and existence of past tracking are removed from the regression analysis because they are either constants or have missing correlations. Thus, the only variables left in consideration are age and past tracking experience as the independent variables. Table 30. Results of Pearson R correlation R R Square Adjusted R Square Std. Error of the Estimate .340 .116 -.081 .746 Figures from Table 30 reveal that the Pearson correlation factor, R2 is .116. This is quite a low correlation value, indicating that only 11.6% of the variance in the dependent variable are accounted for by the independent variables. Results from the Anova test found in Table 31 further indicates that the resulting regression is not significant, F(2, 9) = .588, n. s. Thus, there is no need to find the regression equation. Table 31. Anova for significance of regression equation   SS df MS F Sig. Regression .655 2 .328 .588 .575 Residual 5.011 9 .557 Total 5.667 11       References Blumberg, A., Keeler, L., & Shelat, A. (2005). Automated traffic enforcement which respects “driver privacy”. Intelligent Transformation Systems , 941 - 946. Kostopoulos, G. (2003). E-government in the Arabian Gulf: A vision towards reality. Proceedings of the 2003 Annual National Conference on Digital Government Research . Read More
Cite this document
  • APA
  • MLA
  • CHICAGO
(“Dubai Police Website (Fines Section) and Privacy Concern Statistics Project”, n.d.)
Dubai Police Website (Fines Section) and Privacy Concern Statistics Project. Retrieved from https://studentshare.org/miscellaneous/1585039-dubai-police-website-fines-section-and-privacy-concern
(Dubai Police Website (Fines Section) and Privacy Concern Statistics Project)
Dubai Police Website (Fines Section) and Privacy Concern Statistics Project. https://studentshare.org/miscellaneous/1585039-dubai-police-website-fines-section-and-privacy-concern.
“Dubai Police Website (Fines Section) and Privacy Concern Statistics Project”, n.d. https://studentshare.org/miscellaneous/1585039-dubai-police-website-fines-section-and-privacy-concern.
  • Cited: 0 times

CHECK THESE SAMPLES OF Dubai Police Website and Privacy Concern

Economics of the UAE

The development and principal features of an oil economy The article by Issac John, titled, “Dubai government owned e-commerce website to expand in Gulf” published in Khaleej Times on 20 February 2013, explains this phenomenon.... This shows that the seven countries in the GCC region (Ajman, Abu Dhabi, dubai, Al Fujayrah, Sharjah, Ras al Khaymah and Umm al Qaywayn) have reflected spectacular economic growth till mid 2008 (EIA, 2013)....
17 Pages (4250 words) Case Study

Justice and policing in United Arab Emirates

One of them is that “unlike in some Western jurisdictions, there is no system of precedent in dubai or the UAE.... The essay explores the justice system in the UAE.... It is governed primarily by the Shariah laws.... The justice system of the UAE is inspired by religious values as well as the phenomenal developments in legal frameworks around the world....
5 Pages (1250 words) Research Paper

Diffusion of the Mobile Commerce in Dubai

dubai has always been a city taking cues from the developed world.... Being the largest city in UAE, dubai has always set an example for other Middle East nations in taking up newer initiatives.... With a dependable mobile communication network and a high level of mobile communication penetration, it will be interesting to know the kind of value-added services are on offer in dubai.... dubai is being promoted as an attractive tourist destination and as a business center....
12 Pages (3000 words) Research Paper

The Strategy of the Abu Dhabi Department of Transport

From the paper "The Strategy of the Abu Dhabi Department of Transport " it is clear that The Department of Transport in Abu Dhabi operates within the jurisdiction of the leadership of Abu Dhabi which falls into the wider scope of the United Arab Emirates.... .... ... ... Johnson, Scholes & Whittington identify that the primary method of analysing the external environment within which an organisation operates is through the use of PESTEL....
13 Pages (3250 words) Research Paper

Noteworthy Features of United Arab Emirates

This paper studies online resources to determine several noteworthy features of United Arab Emirates (UAE) Society and Culture.... It's important to highlight that native ethnic group in the society is Emiratis, who are only 15 % - 20 % of the total population.... ... ... ... The study explores that folklore; education and sports play a vital role in society....
12 Pages (3000 words) Research Paper

Comparisons between Tourism Websites

"Comparisons between Tourism Websites" paper compares the Dubai Department of Tourism and Commerce Marketing website and states that they are quite well balanced.... The site lacks the impressive features that such a tourism attraction website should have to as to ensure as many visitors as possible, hence, much need to be done on it still n terms of beautification and information precision.... Qatar Tourism Authority website provides quick preview icons demarking each and every location with its suitable events i....
6 Pages (1500 words) Term Paper

Transforming Dubai Government Entities into Smart Organization

This research 'Transforming dubai Government Entities into Smart Organization' uses interview analysis and survey technique to collect data across different government organizations in dubai.... More than 55 employees were invited to participate in a close-ended questionnaire....
15 Pages (3750 words) Essay

Information and Education in the UAE

This report "Information and Education in the UAE" discusses the 'information society' that symbolizes the present state of the world in which information has become abundant.... The adoption of the internet in the education system of the UAE is one of its own in the whole Middle East.... ... ... ...
17 Pages (4250 words) Report
sponsored ads
We use cookies to create the best experience for you. Keep on browsing if you are OK with that, or find out how to manage cookies.
Contact Us