StudentShare
Contact Us
Sign In / Sign Up for FREE
Search
Go to advanced search...
Free

Toyota Motor Corporation - Essay Example

Cite this document
Summary
The paper "Toyota Motor Corporation" describes that Toyota Motors Corporation is one of the top five automobile manufacturers and sellers. The company recorded phenomenal business growth and expansion until 2008 when its Earnings per Share peaked at 540 Yen…
Download full paper File format: .doc, available for editing
GRAB THE BEST PAPER97.3% of users find it useful
Toyota Motor Corporation
Read Text Preview

Extract of sample "Toyota Motor Corporation"

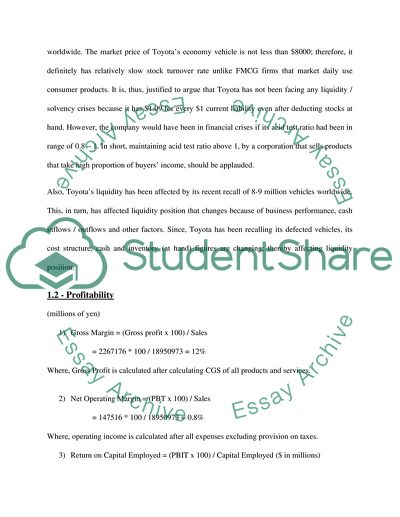
Task One Important s It should be mentioned that Toyota Motor Corporation’s annual report presented all consoli d financial ments (Income statement, Cash Flows and Balance Sheets) in Japanese Yen; however, some statements also provide US Dollars conversion. Hence, the researcher has used both Dollar and Yen figures (where necessary for personal ease) to calculate ratios. 1.1 - Liquidity/Solvency 1) Current Ratio = Current Assets / Current Liabilities (in millions of US $) = 140516 / 114856 = 1.22 2) Acid Test = Current Assets – Stock / Current Liabilities (in millions of US $) = 140516 - 15288 / 114856 = 1.09 As far the liquidity / solvency of Toyota Motors is concerned, it should be pointed out that the current ratio indicates that for every $1 that Toyota Corporation owes imminently, it has $1.22 of available liquid resource. The financial experts usually argue that an excellent current is in the range of 1.5 – 2.0 because it enables the firms to easily pay off their debts and future financial obligations to creditors / lenders. Hence, Toyota Motors could not be considered as a highly liquid corporation because it has only $1.22 liquid assets for each $1 liability. For instance, the acid test ratio indicates that for every $1 that Toyota Motors Corporation owes imminently, it has $1.09 of available liquid resource if it is unable to sell its stock. Quite unequivocally, Toyota is an international automobile manufacturer / assembler, which sells luxury and normal vehicles worldwide. The market price of Toyota’s economy vehicle is not less than $8000; therefore, it definitely has relatively slow stock turnover rate unlike FMCG firms that market daily use consumer products. It is, thus, justified to argue that Toyota has not been facing any liquidity / solvency crises because it has $1.09 for every $1 current liability even after deducting stocks at hand. However, the company would have been in financial crises if its acid test ratio had been in range of 0.8 – 1. In short, maintaining acid test ratio above 1, by a corporation that sells products that take high proportion of buyers’ income, should be applauded. Also, Toyota’s liquidity has been affected by its recent recall of 8-9 million vehicles worldwide. This, in turn, has affected liquidity position that changes because of business performance, cash inflows / outflows and other factors. Since, Toyota has been recalling its defected vehicles, its cost structure, cash and inventory (at hand) figures are changing; thereby affecting liquidity position. 1.2 - Profitability (millions of yen) 1) Gross Margin = (Gross profit x 100) / Sales = 2267176 * 100 / 18950973 = 12% Where, Gross Profit is calculated after calculating CGS of all products and services. 2) Net Operating Margin = (PBT x 100) / Sales = 147516 * 100 / 18950973 = 0.8% Where, operating income is calculated after all expenses excluding provision on taxes. 3) Return on Capital Employed = (PBIT x 100) / Capital Employed ($ in millions) = 1586 * 100 / 117481 = 1.35% 4) Net Margin = (Net profit x 100) / Sales ($ in millions) = 2251 * 100 / 203687 = 1.1% Where, net income also includes other income 5) Return on Shareholders’ Funds = (Profit after tax x 100) / Shareholders’ Funds = 209456 * 100 / 10359723 = 2% Toyota earned a healthy 12% Gross Profit margin in extremely challenging economic conditions. The net operating margin became positive 0.8% in 2010 in comparison to -2.2% in 2009. The improvement in operating margin also improved net margin which was estimated to be 1.1% in 2010. The return on capital employed was 1.35% whereas return on shareholders’ funds was nearly 2%. In simple words, global automobile industry is extremely competitive because of many global producers (Honda, Nissan, Kia, Hyundai, Ford, Chrysler, GM etc.); hence Toyota’s profitability ratios indicate the top performance of global automobile producer during 2009 – 2010. It is worthwhile to mention that fiscal year 2009 – 2010 was, in fact, one of the most challenging years for automobile businesses because of global economic meltdown and financial crises. Undoubtedly, the situation was extremely bleak and American competitors such as General Motors and Chrysler would have also declared bankruptcies if US government had not announced bailout packages (GM Annual Report, 2010). Taking above into consideration, it is justified to argue that Toyota has done a relatively better job as it ended up with over $2.2 billion profit even though sales reduced to $203.6 billion in 2010 from nearly $215 billion in 2010. The company faced immense difficulties because its sales in core European, North American and Japanese markets (geographic regions) were reduced substantially because of employment and inflation followed by decline in consumer spending due to weak purchasing power. Nevertheless, the company paid special attention to control its operating costs, selling and administrative expenditures. Toyota also dismissed its additional employees to bring its cost structure in-line with revenue streams. Also, the increase in value of Japanese Yen and subsequent decline in worth of US Dollar also created financial problems for Toyota. The R&D costs were reduced by a nearly 20% year-on-year basis because of decline in sales volume. In short, Toyota incurred a net loss of 436.9 billion Yen during 2008 – 2009, while generated a net profit of 209.4 billion Yen during 2009 – 2010 which is the evidence that Toyota’s performance has improved significantly year-on-year basis (Toyota Annual Report, 2010). 1.3 - Working capital efficiency (Yens) 1) Assets Turnover Ratio = Sales / Total Assets (in US$) = 203687 / 326196 = 0.624 2) Stock Turnover = Cost of Goods Sold / Average Stocks = 16683797 / 1440883.5 = 11.57 3) Stock days = (Average Stocks x 365) / Cost of Goods Sold = 1440883.5 * 365 / 16683797 = 31.5 days 4) Debtors Turnover = (Debtors x 365) / Sales = 6095769 * 365 / 18950973 = 117.4 days 5) Creditors Turnover = (Creditors x 365) / Purchases* = Purchases can’t be calculated in above from financial report It should be mentioned that Toyota Company has assets worth $326 billion in 2010 and it successfully generated $203 billion from its revenue streams. Hence, the assets turnover rate of 0.624 indicates that Toyota generated $0.62 for every $1 asset. Indeed, this ratio would have increased to 0.7 if monetary sales of global seller had not declined to $203 billion in 2010 from $215 billion of fiscal year 2009. There were two major reasons behind reduction in monetary sales. First, Toyota reduced its prices to clear off inventories at hand, while the second reason was decrease in demand of automobiles because of global recession. It should be noted that all major global companies reduced prices of their automobiles so that they could entice a large pool of potential customers towards their automobiles. The above mentioned strategy worked and Toyota was able to reduce stock days to 31.5 during 2010 in comparison to 35 days in 2009. For instance, the stocks in 2010 also reduced to 1422 billion Yen against nearly 1460 billion Yen in last fiscal year. Debtors’ turnover rate also reduced to 117 days in 2010 against 122 days in 2009 that shows considerable improvement in working capital efficiency (Toyota Annual Report, 2010). 1.4 - Long term financial structure 1) Gearing = (Prior Charge Capital (PCC) x 100) / (Shareholders Funds + PCC) = Can’t be calculated because of non-availability of values. 2) Interest Cover = PBIT / Interest Charges = Interest charges can’t be calculated neither given in financial report Toyota initiated a restructuring programme during 2009 – 2010 mainly because it incurred colossal losses of 436.9 billion Yen in 2008 – 2009. The strategic planners and top executives of Toyota Motors Corporation were aware of the fact that the external factors (such as recession, unemployment, inflation, decline in aggregate consumption and consumer spending, increase in raw-material prices, discount / interest rate of financial institutions etc.) are uncontrollable. Therefore, they formulated and implemented policies so that they could reduce their financing costs, expenses on operational leases, mortgages, debentures and loans etc. For this purpose, the corporation raises funds not only from external financial institutions but also from its “financial services subsidiary” (Toyota Annual Report, 2010). However, the results are not satisfactory because the growth in total assets of Toyota Corporation is significantly lower than growth long-term debts. The total assets (nearly $326 billion) grew at a pace of just under 4.5% during 2009 – 2010, whereas long-term debt (totalled to $75.4 billion) recorded a phenomenal growth of more than 11% year-on-year basis. 1.5 - Investors’ perspective 1) Dividend Yield = (Dividend x100) / Market value of shares (In US $) = 0.48 * 100 / 40.25 = 1.19% 2) Earnings per share (EPS) = (Profit after tax – Preferred Div) / No of ordinary shares = $0.72 as provided by Annual Report (it can’t be calculated because data is not available about preferred dividend) 3) Price/earnings ratio = Share Price / EPS = 40.25 / 0.72 = 55.90 The dividend yield refers to return a shareholder get on a share against its market value. For instance, the yield on Toyota’s share is only 1.19% which means that an investor will earn only $1.19 if he / she buy $100 worth shares of Toyota Motors. Obviously, the return is extremely low for investors that may force them to sell off company’s shares in stock markets. Toyota’s earning per share has increased to $0.72 because it generated $2.2 billion profit (or 209.4 billion yen) in 2010 against the loss of 436.9 billion yen in 2009, despite the fact the monetary sales were reduced in 2010 against 2009. The aforementioned is the evidence that Toyota could increase its sales (volumetric and monetary) in upcoming followed by control on costs, which would then enable this corporation in increasing EPS. In short, the financial performance of 2010 is much better than that of 2009; however, it is well-below Toyota’s performance in 2008 (when per share income was 540 Yen) and preceding years. In addition, the market price of Toyota’ share has reduced by cumulative 50% from 7550 Yen in 2007 to 3750 ($40.25) Yen in 2010. The earnings per share has also come down to $0.72; thereby resulting in P/E ratio of 55.90. This means that an investor is ready to pay $55.9 in the market for every $1 earning. According to investors’ perspective, the P/E ratio is not satisfactory because they have to invest a considerable sum of money to earn $1. Unequivocally, they will prefer buying shares that have higher dividend yields and high P/E ratio, for profit-maximisation. Task Two “Toyota’s speed to market, lean manufacturing, and ground breaking technology has helped to attain near legendary status in the industry. But many of the features that made it the largest, and until last year, the most profitable car maker in history started to look more like liabilities this week.” (Reed, J., ‘Toyota’s long climb comes to an abrupt halt’, Financial Times, London, 5th February 2010) The above mentioned statement by Reed (2010) is, in fact, true portrayal of Toyota’s rising current and long – term debts followed by declining growth of fixed and current assets simultaneously. It is worthwhile to mention the fact that Toyota Corporation used to be the most profitable automobile producer, assembler and seller in the history because of its cost leadership, efficient management systems, constant focus on brand recognition, product innovation / development and differentiation, market development and diversification strategies. The situation first aggravated during 2007 - 2008 when Toyota recorded a nominal decline in growth of total assets because of rising economic / financial costs, reduction in consumer demand due to escalating global oil prices, beginning of recession and subsequent weakening in value of US Dollar in financial markets (GM Annual Report, 2010). Indeed, it should be pointed out that Toyota (in years preceding 2008) on average recorded a 10 - 15% yearly growth in both assets and liabilities. Nevertheless, the increasingly large quantity of assets plus high annual growth rate directly benefited global automobile player because even 10 – 15% growth in liabilities / financial debts were not a real threat at that time amid rise in sales volume and profitability. For instance, the situation was still under Toyota’s control in 2008 when it recorded a negative growth of paltry 0.5 - 1% in Total assets, whereas the long – term debts reduced by significant 5%. However, the fiscal year 2009, in fact, should be viewed as a major setback in Toyota’s performance (during 2001 – 2010) because its total assets recorded a considerable 10% negative growth rate, while the long – term debts observed a surge of 7 - 8% year-on-year basis. In simple words, Toyota’s performance was adversely impacted in fiscal year 2009 largely because global financial meltdown resulted in business closures and subsequently increased unemployment rates. In fact, all major markets (Japan, North America and Europe) of Toyota Corporation suffered with negative economic growth rates due to decline in aggregate production, consumption / spending and saving. It should not be forgotten that oil prices also declined considerably from record peak of $147 to $40 per barrel, yet consumers changed their preferences and started demanding fuel – efficient and alternative fuel vehicles fearing escalation in international oil prices in near future. The total assets of Toyota were nearly 29,060 billion Yen; whereas long-term liabilities alone amounted to 7,872 billion Yen while current liabilities were nearly 10,590 billion Yen in fiscal year 2009. One of the major reasons behind this increase in payables and future obligations was sharp reduction in sales volume and increase in inventories at hand of Toyota vehicles. For instance, Toyota was unable to pay back its loans / liabilities because of sales drop and subsequent cash inflows / liquidity issues that negatively affected growth of its Total Assets. Nonetheless, Toyota was not the only producer that faced this critical situation rather General Motors, Daimler Chrysler, Honda, Ford etc. also faced difficulties in survival because of impairment of income statement, cash flows and balance sheet figures (Soble & Reed, 2010). The financial performance of Toyota Motors Corporation, although, improved in fiscal year 2010 when it successfully generated profits of $2.2 billion after mammoth losses in 2009; however, it could not be solely considered as an indicator of financial sustainability and development. The total assets (nearly $326 billion) grew at a pace of just under 4.5% during 2009 – 2010. In contrast, the long-term debt totalled to $75.4 billion recorded a phenomenal growth of more than 11% year-on-year basis. Hence, it is justified to argue that Toyota’s financial structure has been changing because its assets (that benefited the company in previous years) have become liabilities in 2010 (Reed, 2010). For instance, Toyota started announcing recalls of 8 – 9 millions after reports of 2000 fatal accidents and 19 deaths from its defective vehicles with accelerator and brake pedal issues. By February 2010 (just before ending of fiscal year on March 31), Toyota had recalled nearly 2 million vehicles from its main markets that also reflected in Income Statement, Cash Flows and Balance Sheet. In fact, the assets and liabilities / debts section were greatly affected from that recall because sales declined and products recalled simultaneously. Toyota Corporation estimated that recall would cost, at least, $2 billion in 2010 – 2011, which may increase in near future if suppliers would increase raw-material / inputs prices followed by high labour expenditures. It is worth mentioning that Toyotas sales in North America reduced by 16% alone in February 2010 in comparison to February 2009 just after the recall. On the other hand, the competitors operational in American markets were among the actual beneficiaries, since ‘General Motors recorded sales increase of 15%, Ford observed a growth of 24%, Nissan recorded the growth of 15%, and Hyundai observed a phenomenal 24% growth in USA. Indeed, the recall enabled Ford Corporation to become second largest automobile seller across North America after General Motors (Economist Article, 2010). The recall sabotaged Toyota’s strategic and financial position because customers started switching to other brands, which later resulted in decline in market share. This just happened when Toyota had certain plans / aspirations to benefit from improvements in global economic outlook. Without any doubt, the company in the short - run has been unable to win trust of potential customers and maximise its monetary gains because of additional repair and delivery costs to be incurred from this recall. In addition, the loss of goodwill and reputation alone could prove quite devastating for company in near future when it will launch newly developed products. For instance, potential customers and industry analysts may raise questions about safety, security and reliability of Toyota’s vehicles. In a nut shell, it is justified to argue that Toyota’s balance sheet figures (assets and liabilities) position will deteriorate in fiscal year of 2011 because of mixed consumer confidence on Toyota’s market offerings. Also, the recall of 8 – 9 million vehicles will adversely affect debts section of Toyota and reduce profitability. Consequently, the possible decline in equity will have a subsequent adverse impact on assets (cash inflows and stocks at hand); thereby affecting Toyota Motors’ strategic business position in the short and long run (Toyota Annual Report, 2010). Task Three It is worthwhile to mention the fact that Toyota Motors Corporation is one of the top five automobile manufacturers and sellers. The company recorded phenomenal business growth and expansion until 2008 (fiscal year ended on March 31, 2008) when its Earnings per Share peaked at 540 Yen. However, the economic recession of 2008 - 2009 adversely impacted financial performance of Toyota and it incurred a stupendous 436 billion Yen loss in 2009. Nevertheless, the global corporation only suffered losses in fiscal year 2009 during 2001 – 2010, which is largely attributable to bleak external business environment. For instance, the global restructuring and business reengineering programme / initiatives have, although, helped Toyota in reducing its escalating costs and enhancing its internal efficiency, effectiveness and performance. However, it should not be forgotten that growth rate in Toyota’s assets is significantly lower than growth rate in short and long – term debts / financial obligations. For instance, the recall of 8 – 9 million defective vehicles from North America, Japan, Europe and Asia regions have sabotaged Toyota’s reputation in the market as well as the consumer confidence (Reed, 2010). According to an estimate, the recall and repair of defective vehicles will cost over $2 – 2.5 billion, which is equivalent to profit generated during 2009 – 2010 (Lim, 2010). Hence, this is an additional financial burden that not only impacted cost structure but also shattered investors’ confidence. Toyota Corporation’s share price as recorded on March 31, 2010 was 3745 Yen that reduced to 3240 Yen on December 22, 2010. The aforementioned is the evidence that investors, in general, are unwilling to invest in Toyota’s shares to avert any financial losses. Also, the repair programme has already been started and industry analysts speculate that Toyota’s share price will reduce further in near provided an increase in Yen’s valuation and subsequent decline in Dollar’s worth in international markets. I would, therefore, recommend all investors to sell Toyota’s shares at the earliest because it’s no longer a lucrative option for investment portfolio (Reuters Report, 2010). Reference Annual Report (2010) “Toyota’s Financial Report 2010” Toyota Motors [Online] Available at http://www.toyota.co.jp/en/ir/library/annual/pdf/2010/index.html Reuters Report (2010) “Toyota Motors Corporation” Reuters [Online] Available at http://www.reuters.com/finance/stocks/overview?symbol=7203.T Soble, Jonathan and John Reed (2010) “Toyotas stumbling scion; The aloof chief executive needs to engage with the public” Financial Times UK Lim, Kenny (2010) “Toyota fights to save reputation” Media. Hong Kong Economist Article (2010) “Business: No quick fix; Toyotas troubles deepen” The Economist, Vol. 394, Issue# 8668, p. 71 Annual Report (2010) “GM’s Financial Report 2009” General Motors www.gm.com (Investor Relations) Reed, J. (2010) ‘Toyota’s long climb comes to an abrupt halt’, Financial Times, London, Read More
Cite this document
  • APA
  • MLA
  • CHICAGO
(Toyota Motor Corporation Essay Example | Topics and Well Written Essays - 3000 words, n.d.)
Toyota Motor Corporation Essay Example | Topics and Well Written Essays - 3000 words. Retrieved from https://studentshare.org/marketing/1574370-a-financial-report-for-a-case-study
(Toyota Motor Corporation Essay Example | Topics and Well Written Essays - 3000 Words)
Toyota Motor Corporation Essay Example | Topics and Well Written Essays - 3000 Words. https://studentshare.org/marketing/1574370-a-financial-report-for-a-case-study.
“Toyota Motor Corporation Essay Example | Topics and Well Written Essays - 3000 Words”, n.d. https://studentshare.org/marketing/1574370-a-financial-report-for-a-case-study.
  • Cited: 0 times

CHECK THESE SAMPLES OF Toyota Motor Corporation

TOYOTA Motor Corporation. SWOT Analysis

This essay will focus on the definition of SWOT analysis and its purpose and then witting a SWOT matrix for Toyota Motor Corporation.... SWOT analysis means Strengths, weaknesses, opportunities and Threats.... It is very important to set up a strategy that helps a manufactory to develop....
7 Pages (1750 words) Essay

Strategic Management at Toyota Motor Corporation

MGT499 - Strategic Management Module 3 Case- Internal Analysis and SWOT Name: Institution: Introduction The following paper will focus at Toyota Motor Corporation in general.... It will also be looking at the internal analysis and SWOT of the Toyota Motor Corporation and how they use these findings to improve on their business.... Toyota Motor Corporation Toyota Motor Corporation is a company that is leading globally in manufacturing and sales, in the automobile industry....
5 Pages (1250 words) Essay

Marketing Information System: case of Toyota Motor Corporation

The firm that is analyzed in the paper is Toyota Motor Corporation.... hellip; In relation to the study the company which has been selected is Toyota Motor Corporation, a renowned Japanese automobile company.... The automobile giant having its headquarters in toyota, Aichi, Japan, was established by Kiichiro Toyoda in the year of 1937.... toyota entered USA market by doing a joint venture with General Motors in the year 1984....
4 Pages (1000 words) Essay

Toyota and Ford Marketing Strategies

Two major competitors in the automobile industry are Toyota Motor Corporation and Ford Motor Company.... Toyota Motor Corporation Toyota Motor Corporation is a Japanese based automobile company that sells its brands locally and in the international market.... Ford motor corporation Ford motor corporation is an American based corporation whose headquarter is located in Michigan, US.... Running head: ford motor and the toyota motor corporations 15th November 2013 Introduction Based on the stiff competition that is currently been experienced by local and international companies, majority of firms have turned into use of extensive marketing strategies as well as unique strategic plans with an objective of keeping at bay their competitors....
7 Pages (1750 words) Essay

Managing Information in Toyota Motor Corporation

The objective of this paper is managing information in the area of cost control with reference to Toyota Motor Corporation, one of the most successful and widely respected business organizations in the world.... For information to be useful, it needs to fulfill criteria.... hellip; Managing information is an extremely important element in a competitive business environment....
11 Pages (2750 words) Research Paper

Research Paper Thesis Statement

The present effective operation strategic plans as well as realistic marketing plans have enabled the Toyota Motor Corporation to be among the eleventh most flourishing companies in the global motor vehicles market.... For the company to prosper in contemporary global market, the… Some of the common drivers of globalisations affecting Toyota Motor Corporation include competitive drivers, cost drivers, technological drivers, market drivers and political drivers....
1 Pages (250 words) Research Paper

How Toyota Motor Corporation Has Become the Largest Automobile Manufacturer

The study "How Toyota Motor Corporation Has Become the Largest Automobile Manufacturer" gives a detailed background of the breakneck success of the company which started as a textile firm which opened a car department and has now grown to a multinational automobile company.... hellip; toyota is among the companies that started from humble beginnings and have grown to become one among the large companies in the automotive sector.... The guiding policy of toyota company has been the production of the best quality vehicles at the lowest possible cost and in the safest environment....
7 Pages (1750 words) Case Study

Toyota Motor Corporation - an Overview of the Company

This paper "Toyota Motor Corporation - an Overview of the Company" focuses on the fact that Toyota is a leading brand in the automobile industry and it holds a strong identity for its strong, fuel efficient, and environment-friendly cars.... nbsp;  The leading brands for Toyota corporation include; Toyota, Lexus, Scion and Hino.... toyota was incorporated in Japan.... nbsp;… It is interesting to say that the US is one of the largest markets of toyota....
10 Pages (2500 words) Assignment
sponsored ads
We use cookies to create the best experience for you. Keep on browsing if you are OK with that, or find out how to manage cookies.
Contact Us