StudentShare
Contact Us
Sign In / Sign Up for FREE
Search
Go to advanced search...

Data analysis - Speech or Presentation Example

Cite this document
Summary
Data have been collected in an excel spread sheet from 138 teachers with the help of the questionnaires in relation to the topic that is teachers’ mobility and turnover. The collected data is then analyzed using the software SPSS to determine the result. The teachers were…
Download full paper File format: .doc, available for editing
GRAB THE BEST PAPER96.7% of users find it useful
Data analysis
Read Text Preview

Extract of sample "Data analysis"

Download file to see previous pages

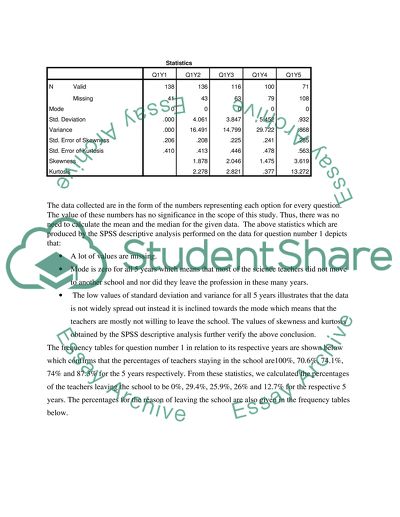
If your answer is to change the school then please, indicate that is this change would be you 2nd, 3rd or 4th school. The data collected are in the form of the numbers representing each option for every question. The value of these numbers has no significance in the scope of this study. Thus, there was no need to calculate the mean and the median for the given data. The above statistics which are produced by the SPSS descriptive analysis performed on the data for question number 1 depicts that: The low values of standard deviation and variance for all 5 years illustrates that the data is not widely spread out instead it is inclined towards the mode which means that the teachers are mostly not willing to leave the school.

The values of skewness and kurtosis obtained by the SPSS descriptive analysis further verify the above conclusion. The frequency tables for question number 1 in relation to its respective years are shown below which confirms that the percentages of teachers staying in the school are100%, 70.6%, 74.1%, 74% and 87.3% for the 5 years respectively. From these statistics, we calculated the percentages of the teachers leaving the school to be 0%, 29.4%, 25.9%, 26% and 12.7% for the respective 5 years.

The percentages for the reason of leaving the school are also given in the frequency tables below. The low values of standard deviation and variance for all 5 years illustrates that the data is not widely spread out instead it is inclined towards the mode which means that the mostly teachers are not quitting the school. The values of skewness and kurtosis obtained by the SPSS descriptive analysis further verify the above conclusion. The frequency tables for question number 2 in relation to its respective years are shown below which confirms that the percentages of teachers staying in the school are100%, 70.8%, 73.9%, 68.6% and 90.1% for the 5 years respectively.

From these statistics, we calculated the percentages of the teachers

...Download file to see next pages Read More
Cite this document
  • APA
  • MLA
  • CHICAGO
(“Data analysis Speech or Presentation Example | Topics and Well Written Essays - 750 words - 2”, n.d.)
Data analysis Speech or Presentation Example | Topics and Well Written Essays - 750 words - 2. Retrieved from https://studentshare.org/miscellaneous/1567842-data-analysis
(Data Analysis Speech or Presentation Example | Topics and Well Written Essays - 750 Words - 2)
Data Analysis Speech or Presentation Example | Topics and Well Written Essays - 750 Words - 2. https://studentshare.org/miscellaneous/1567842-data-analysis.
“Data Analysis Speech or Presentation Example | Topics and Well Written Essays - 750 Words - 2”, n.d. https://studentshare.org/miscellaneous/1567842-data-analysis.
  • Cited: 0 times

CHECK THESE SAMPLES OF Data analysis

The Business Strategies of an Industry Named Handy Hydraulics Limited

Unit Title: Business data analysis Assignment Title: “Handy Hydraulics (HH) Industries” Submission due date: Week 11 (Friday 20/05/'11) Unit coordinator's name: C F Shoostarian Author's Name: Department: Submission due date: Week 11 (Friday 20/05/'11) ABSTRACT Handy Hydraulics Industries is a growing company.... This report is aimed to conduct the data analysis for the company.... Since there was enormous data recorded already it was hooped that the analysis of this data would more likely produce some beneficial results and recommendations....
14 Pages (3500 words) Essay

Demographic Data Analysis

data analysis Results Sample Characteristics The demographic characteristics of the sample size were identified.... These data were gathered to correspond with the variable of Moderate and Vigorous Physical Activity (MVPA) of the respondents.... These included the gender, ethnicity, academic level, and college of study of respondents....
3 Pages (750 words) Research Paper

Longitudinal Data Analysis

In the paper “Longitudinal data analysis” the author analyzes the relationship between the level of qualifications attained by individuals and their financial position based on the ethnical background of individuals' living in Britain over a period from 1990 to 2001 who took part in the BHPS survey.... Fixed Variable: The analysis is performed on the basis of ethnic background of individuals.... Fixed Variable: The analysis is performed on the basis of ethnic background of individuals....
14 Pages (3500 words) Essay

Survey Data analysis

The age break-up of the random sample can be illustrated in the following graph. Taking this sample to be representative of the population at ARU, we can Section A Part 2: Survey data analysis This survey data gives information about the study methods studying at the Anglia Ruskin (ARU).... The sample size for this data set is 94.... The sample size for this data set is 94.... egarding how the students found out about this particular course, the data is summarized in the table below....
2 Pages (500 words) Coursework

Financial data analysis

Through data analysis, various stakeholders are able to deduce important information from specific data.... In addition, the data analysis also identifies Time series analysis also assist stakeholders and other interested parties in understanding how the various sets of data behave within a given period.... After which, the correlation function under the data analysis was used in order to identify the correlation coefficient.... A descriptive data analysis was also conducted....
4 Pages (1000 words) Essay

Performing Data Analysis

It involves Performance data analysis January 30, Performance data analysis Research aims at analyzing data on a phenomenon of interest but errors may induce external factors.... Hypothesis informs data collection strategy and data analysis approaches because it dictates the type of data to be collected.... Data cleaning is important because it detects and eliminates possible errors in a data set to ensure accuracy and consistency in collected data and validity and reliability of analysis results....
1 Pages (250 words) Coursework

Method of Data Analysis

This essay "Method of data analysis" discusses the test of relationships such as linear regression or correlation techniques.... hellip; Data that seem to depend on some relationships would necessitate the selection of test of relationships over the measure of dispersion as the technique of data analysis.... Test of relationships is usually a necessary technique of data analysis in the cases where one variable affects the other.... In such a case, a negative correlation in the analysis would indicate that studying relates to a lower score....
1 Pages (250 words) Essay

Multivariate Data Analysis

The author examines Structural Equations Models, the purpose of which is to estimate the values of all such endogenous variables in terms of the exogenous ones, through assessing the interrelationships being defined, and Confirmatory Factor analysis… The arrowheads pointing towards the endogenous variables clearly suggest that out of the three exogenous variables, the factor 'Coworkers' impose the greatest impact on the dependent variable 'Job Satisfaction', while the least effect is bestowed by the factor 'Supervision'....
6 Pages (1500 words) Assignment
sponsored ads
We use cookies to create the best experience for you. Keep on browsing if you are OK with that, or find out how to manage cookies.
Contact Us