StudentShare
Contact Us
Sign In / Sign Up for FREE
Search
Go to advanced search...

Statistical Analysis Math - Speech or Presentation Example

Cite this document
Summary
This is an observational type of research question that answers the ‘what’ question as opposed to the analytical type of research question that answers the ‘why’ question. The question is fully researchable and realistic given that the type and scope of information…
Download full paper File format: .doc, available for editing
GRAB THE BEST PAPER92.3% of users find it useful
Statistical Analysis Math
Read Text Preview

Extract of sample "Statistical Analysis Math"

Download file to see previous pages

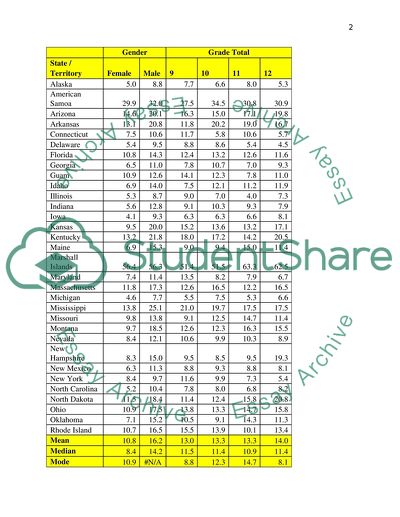
The entire student population of the US has been divided into state/territories as different strata. Samples are then obtained from each stratum. The advantages of this technique are: This structure and design of the frequency table was chosen because it makes it easier to analyze data using tools such as Microsoft Excel and SPSS. It is also simple to extract data from or to do cross tabulations. As you can see the measures of central tendency: mean, mode and median have been easily calculated using MS-Excel.

The section in Table 1 written #N/A shows no mode / multimodal data. From chart 2 we can conclude that Grade 12 students had the highest percentage mean of those who rarely or never wore a seat belt when riding in a car driven by someone else. This is different from Chart 3 below which shows us that Grade 9 had the highest percentage median of the same data. This implies that the data has extreme values. From charts above and below looking at the samples for gender we see we have a skewed distribution.

We can see long right-tails which implies positive skewness. A normal distribution is symmetric and has a skewness value of 0. The standard deviation is a measure of dispersion around the mean. In our case the standard deviation is very high when compared to the mean, 9.066 for Male data and 9.575 for Female data. This means that our data has a very wide spread from the centre. a. Parameters are numbers that are used to describe characteristics of an entire population while statistics are numbers that describe characteristics derived from a sample that has been drawn from a larger population.

  The standard deviation is a measure of dispersion around the mean. It is the positive square root of the variance. Range is the difference between the highest and lowest values in a sample or population. The inter-quartile range is got from the difference between the 3rd and 1st quartiles of the sample/population data. b.

...Download file to see next pages Read More
Cite this document
  • APA
  • MLA
  • CHICAGO
(“Statistical Analysis Math Speech or Presentation”, n.d.)
Statistical Analysis Math Speech or Presentation. Retrieved from https://studentshare.org/miscellaneous/1566641-statistical-analysis-math
(Statistical Analysis Math Speech or Presentation)
Statistical Analysis Math Speech or Presentation. https://studentshare.org/miscellaneous/1566641-statistical-analysis-math.
“Statistical Analysis Math Speech or Presentation”, n.d. https://studentshare.org/miscellaneous/1566641-statistical-analysis-math.
  • Cited: 0 times

CHECK THESE SAMPLES OF Statistical Analysis Math

Best Practices in improving student success rate in college - developmental/remedial math

statistical analysis of the data has been used to find out recommendations to improve the students success rate in developmental mathematics.... Supplementary methods like mastery learning, computer aided learning, mentoring practice and innovative math lab have been adopted along with this pilot course.... Based on the research data analysis, it has been recommended that computer based teaching and mastery assessment needs to be continued....
27 Pages (6750 words) Dissertation

Statistical Analysis Research Paper

Define "causation" in statistical analysis.... Describe at least two factors that influence relationships between two variables and can lead to misinterpretation of data analysis.... necessary that occurrence of first event must always leads to the occurrence of second event....
4 Pages (1000 words) Research Paper

Statistics and Data Analysis

The author examines positively and negatively skewed distribution curve, bimodal distribution curve.... The author states that probability distribution is chosen for each measure that best describes its variations.... The distribution is used to predict possibilities of occurrences of different values....
17 Pages (4250 words) Assignment

Statistical analysis

Inferred assumption of statistical analysis December 4, statistical analysis Adams, Chien, and Sheryl used logistic regression in their study that investigated breast cancer treatment between two categories of women and the statistic is applicable to the level of measurement that is ordinal.... Badger and Werrett however used descriptive statistics for analysis and this is consistent with the discrete and ordinal scope of the analyzed data.... The discrete nature of the investigated variables, measurable on ordinal scale, justifies use of descriptive statistics such as percentages but no assumption can be deduced from the analysis to justify the statistics....
1 Pages (250 words) Essay

Statistical analysis of data

ata analysis:In this dataset we can find out the average emission of the pollutants over the years for different activities and can report which activity has the most notorious impact on the environment.... In excel we can do moving average and trend analysis like linear trend, quadratic trend etc for the data.... Time series analysis can be done in tools like minitab to forecast each sector emission of greenhouse gases for next five years.... Time series forecast like moving average, blended moving average, trend analysis can be done in excel too....
2 Pages (500 words) Statistics Project

SPSS Statistics Project

These aspects include some basic terms, methods of data collection, data capturing and editing, statistical analysis, interpretation and report writing.... So the Pearson correlation (r) of popularity and math scores is equal to -0.... This may imply as popularity level increases, math test scores decrease, and vice versa.... hellip; There are various statistical packages designed to carry out quantitative data analysis, the most widely used package is SPSS....
8 Pages (2000 words) Research Paper

Statistical Analysis of Geographical Data

The study "statistical analysis of Geographical Data" focuses on the critical analysis of geographical data using regression and correlation techniques to establish the relationship between two data sets, categorized as independent and dependent variables.... hellip; Geography utilizes many statistical tools to make conclusions about the features of geographical data.... A particular statistical technique is useful in analyzing the category of data....
6 Pages (1500 words) Case Study

Statistical Data Analysis

The assignment "Statistical Data analysis" focuses on the critical analysis of the tasks in statistical data, i.... .... the price and dist variables.... The price variable shows a normal distribution with a mean of $22511.... 1.... However, the dist variable is not normally distributed....
7 Pages (1750 words) Assignment
sponsored ads
We use cookies to create the best experience for you. Keep on browsing if you are OK with that, or find out how to manage cookies.
Contact Us