StudentShare
Contact Us
Sign In / Sign Up for FREE
Search
Go to advanced search...

Frequency Distribution - Essay Example

Cite this document
Summary
Based on the Frequency distribution and the Histogram chart, the frequency of the data is centered at 1.43 – 1.53 which is covers the statistical mean of 1.48. The distribution looks a normal bell curve with high peak; however, the data has a longer tail starting from…
Download full paper File format: .doc, available for editing
GRAB THE BEST PAPER97.5% of users find it useful
Frequency Distribution
Read Text Preview

Extract of sample "Frequency Distribution"

Download file to see previous pages

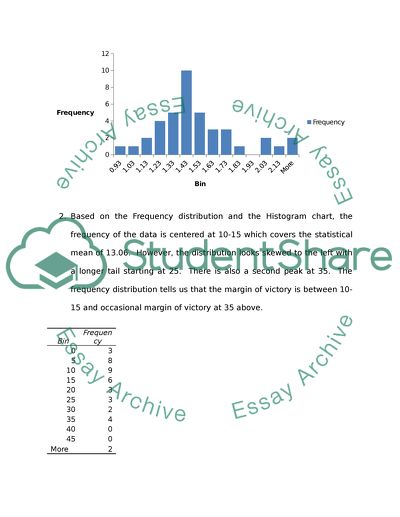
However, the distribution looks skewed to the left with a longer tail starting at 25. There is also a second peak at 35. The frequency distribution tells us that the margin of victory is between 10-15 and occasional margin of victory at 35 above. 3. Based on the Frequency distribution and the Histogram chart, the distribution of the data has 3 peaks at 111-119, 127-135, 159-167. This means that the data may contain three types or categories because it is not normally distributed. The frequency distribution tells us that the different brands of vehicles can be categorized into three, depending on their vehicle quality ratings.

The number of defects per 100 vehicles would depend on where the vehicle brand belongs. 4. Based on the Frequency distribution and the Histogram chart, the distribution of the consumer fraud complaints is centered on 30 to 49 years of age. The distribution follows a normal bell curve. This means that younger and older people has filed less consumer fraud complaints than those at the middle age. Younger people aged 19 and under files lesser complaints as shown by the negative skewness of the distribution. 5. The table was made into a chart that easily analyzes the trends in terms of investment type.

Since the data is categorized into investment types, the data is color coded according to its type. Since the table is a time-series with data from 1996 to 2002, the x-axis of the graph is labeled with years. With this type of column graph, the reader can easily identify the different percentages per year as well as the different trends over

...Download file to see next pages Read More
Cite this document
  • APA
  • MLA
  • CHICAGO
(“Frequency Distribution Essay Example | Topics and Well Written Essays - 1250 words”, n.d.)
Frequency Distribution Essay Example | Topics and Well Written Essays - 1250 words. Retrieved from https://studentshare.org/miscellaneous/1562887-frequency-distribution
(Frequency Distribution Essay Example | Topics and Well Written Essays - 1250 Words)
Frequency Distribution Essay Example | Topics and Well Written Essays - 1250 Words. https://studentshare.org/miscellaneous/1562887-frequency-distribution.
“Frequency Distribution Essay Example | Topics and Well Written Essays - 1250 Words”, n.d. https://studentshare.org/miscellaneous/1562887-frequency-distribution.
  • Cited: 0 times

CHECK THESE SAMPLES OF Frequency Distribution

Dental statistics

For example if we consider a sample of 35 20-year-old dental students and their Frequency Distribution is given as; So, it is clear from the above example, if we change the sample size the value of mean also changes.... If the value of standard deviation is large, then the calculated mean value is less accurate....
4 Pages (1000 words) Essay

The Independent Variable and the Dependent Variable

Describe the shape of the Frequency Distribution in terms of modality and skewness.... 3 3 4 1 0 2 0 1 2 0 4 0 0 3 2 6 0 0 0 1 0 2 1 0 1 1 3 2 1 0 1 3 1 1 0 4 6 7 0 1 Construct a Frequency Distribution for this set of data, showing the absolute frequencies, relative frequencies, and cumulative relative frequencies.... Using information from the Frequency Distribution in Exercise 5, answer the following: a.... Would it be advantageous to group the data in Exercise 5 before constructing a Frequency Distribution?...
4 Pages (1000 words) Assignment

Frequency Distributions (mod 3 slp)

The sum of all these products is computed (as 542825) and divided by size of the distribution (20) to From the data collected in Module a Frequency Distribution can be prepared as shown in Table Table Frequency Distribution Time (in Minutes) Frequency81-1001101-1203121-1400141-1603161-1808181-2003201-2202Figure 1: Graph for Frequency DistributionThe distribution resembles a normal distribution as evidenced by the bar and line graphs depicted in Figure 1.... The sum of all these products (3230) is divided by the total distribution size (20) to compute the mean....
2 Pages (500 words) Essay

Frequency Distributions

A company has 70 employees whose salaries are summarized in the Frequency Distribution below.... Create a Frequency Distribution table for the number of times a number was rolled on a die....     3,   5,   1,   6,   1,   2,   2,   6,   3,   4,   5,   1,   1,   3,   4,   2,   1,   6,   5,   3,   4,   2,   1,   3,   2,   4,   6,   5,   3,   1Ans: Frequency Distribution is shown below:8....
2 Pages (500 words) Assignment

Creating Math Quiz

This quiz is open book and open notes, and you may take as long as you like on it provided that you submit the quiz no later than the due date posted in our course schedule of the syllabus.... You may refer to your textbook, notes, and online classroom materials, but you may not… Please type your work in your copy of the quiz, or if you prefer, create a document containing your work....
3 Pages (750 words) Coursework

FREQUENCY DISTRIBUTIONS

To measure the… The below Frequency Distribution table shows the collected data relating to the amount of time spent on physical fitness training every day, in the form The average minutes that I use in physical fitness training, every day, is equal to 50.... % of the data fall within the range reflecting the fact that the data has a normal distribution....
3 Pages (750 words) Assignment

Management Science

Construct a Frequency Distribution in the chart belowb.... b) Use your solution in (a) for Frequency Distribution to construct a Histogram of the data.... symmetricThe result of the test scores as observed from the above depicted histogram will show the distribution of the sets, which is left skewed (Powell and Baker 200).... Construct a relative frequency distributionAgeFrequency DistributionRelative frequency Distribution20-2433/20= 0....
2 Pages (500 words) Assignment

Assessment of Students Satisfaction with Universities Services

Frequency Distribution tables and charts were used to aid in the analysis of findings.... 51)Skewness – A statistical measure of the asymmetry of a distribution around its mean.... The paper "Assessment of Students' Satisfaction with Universities' Services" highlights that the students are most satisfied with their university's teaching quality, and are least satisfied with its Sports Facilities, but only slightly less than its Accommodations....
8 Pages (2000 words) Research Paper
sponsored ads
We use cookies to create the best experience for you. Keep on browsing if you are OK with that, or find out how to manage cookies.
Contact Us