StudentShare
Contact Us
Sign In / Sign Up for FREE
Search
Go to advanced search...
Free

Frequency Distributions - Assignment Example

Cite this document
Summary
The math grades on the final exam varied greatly. Using the scores below, how many scores were within one standard deviation of the mean? How many scores were within two standard deviations of the mean?
   …
Download full paper File format: .doc, available for editing
GRAB THE BEST PAPER92.8% of users find it useful
Frequency Distributions
Read Text Preview

Extract of sample "Frequency Distributions"

Case Assignment Answer the following problems showing your work and explaining (or analyzing) your results The math grades on the final exam varied greatly. Using the scores below, how many scores were within one standard deviation of the mean? How many scores were within two standard deviations of the mean?       99   34   86   57   73   85    91   93   46    96   88   79    68   85   89Ans: The mean is 77.93 and the Standard deviation is 18.38.

There were 12 observations within one Standard Dev of mean limitsThere were 14 observations within two Standard Dev of mean limits 2. The scores for math test #3 were normally distributed. If 15 students had a mean score of 74.8% and a standard deviation of 7.57, how many students scored above an 85%?Ans: Mean=74.8 and S.D= 7.57, then z= (85-74.8) / 7.57 i.e 1.3474Cumulative area for z score 1.3474 is 0.911 i.e. cumulative area for z score>1.3474 is (1-0.911) = 0.089.Therefore student scoring above 85% is 15*0.

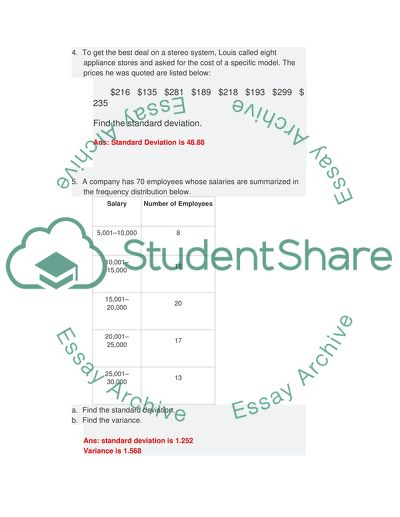
089 which is 1.335 or 1 (approx).3. If you know the standard deviation, how do you find the variance? Ans: If we square the Standard Deviation we get Variance.Variance= (Standard Deviation)^24. To get the best deal on a stereo system, Louis called eight appliance stores and asked for the cost of a specific model. The prices he was quoted are listed below:       $216   $135   $281   $189   $218   $193   $299   $235Find the standard deviation.Ans: Standard Deviation is 48.885. A company has 70 employees whose salaries are summarized in the frequency distribution below.

SalaryNumber of Employees5,001–10,000810,001–15,0001215,001–20,0002020,001–25,0001725,001–30,00013a. Find the standard deviation.b. Find the variance.Ans: standard deviation is 1.252Variance is 1.5686.  Calculate the mean and variance of the data. Show and explain your steps. Round to the nearest tenth.       14,   16,   7,   9,   11,   13,   8,   10Ans: Mean is 11 and Variance is 8.5.The steps are shown below:a) calculate the mean i.e sum(all obsv)/no.of obsv.(14+16+7+9+11+13+8+10) / 8b) calculate ( obsv-mean )^2 as shown belowc) Calculate sum of (obsv-mean) ^2 and divide it by no of obsv to get the variance. i.e. 68/87. Create a frequency distribution table for the number of times a number was rolled on a die.

(It may be helpful to print or write out all of the numbers so none are excluded.)    3,   5,   1,   6,   1,   2,   2,   6,   3,   4,   5,   1,   1,   3,   4,   2,   1,   6,   5,   3,   4,   2,   1,   3,   2,   4,   6,   5,   3,   1Ans: Frequency distribution is shown below:8. Answer the following questions using the frequency distribution table you created in No. 7.a. Which number(s) had the highest frequency?b. How many times did a number of 4 or greater get thrown?c. How many times was an odd number thrown?d. How many times did a number greater than or equal to 2 and less than or equal to 5 get thrown?

Ans: The table below gives the answer: 9. The wait times (in seconds) for fast food service at two burger companies were recorded for quality assurance. Using the data below, find the following for each sample.a. Rangeb. Standard deviationc. VarianceLastly, compare the two sets of results.Ans: The answer is given below in table: CompanyWait times in secondsBig Burger Company105677812017511512059The Cheesy Burger1331242007910114711812510. What does it mean if a graph is normally distributed? What percent of values fall within 1, 2, and 3, standard deviations from the mean?

Ans: A graph is said to be normally distributed if it is symmetric and bell shaped with a single peak. For any normal distribution two quantities must be defined, the mean “mu” where the peak of the curve occurs and standard deviation “sigma” which signifies the spread of the curve from its mean value.68% of the observations fall within 1 standard deviation of the mean.95% of the observations fall within 2 standard deviation of the mean.99.7% of the observations fall within 3 standard deviation of the mean.

ReferenceDas, N.G. (2006). Statistical Methods. Kolkata: Word Press

Read More
Cite this document
  • APA
  • MLA
  • CHICAGO
(“Frequency Distributions Assignment Example | Topics and Well Written Essays - 500 words”, n.d.)
Frequency Distributions Assignment Example | Topics and Well Written Essays - 500 words. Retrieved from https://studentshare.org/statistics/1657570-frequency-distributions
(Frequency Distributions Assignment Example | Topics and Well Written Essays - 500 Words)
Frequency Distributions Assignment Example | Topics and Well Written Essays - 500 Words. https://studentshare.org/statistics/1657570-frequency-distributions.
“Frequency Distributions Assignment Example | Topics and Well Written Essays - 500 Words”, n.d. https://studentshare.org/statistics/1657570-frequency-distributions.
  • Cited: 0 times

CHECK THESE SAMPLES OF Frequency Distributions

Presentation of statistics using a frequency

: Use of frequency distribution in reporting data # Purpose Frequency Distributions used 1 Duration of unemployment < 5 weeks , 5-14 weeks, 15-26 weeks, >27 weeks 2 Employment status by age 16-19 years, 16-17 years, 18-19 years, > 20 years, 20-24 years, >25 years, 25-54 years, 24-34 years, 35-44 years, 45-54 years, >55 years, 16 years and over, 20 years and over, 16-64 years,>65 years (many mutually inclusive ranges, used differently at different places) 3 Employment status by education level Less than high school, High school but no college, Some college or associate degree, Bachelor's degree & higher (Qualitative ranges) 4 …....
3 Pages (750 words) Research Paper

Business problem analysis

These are further divided into sub-models such as Frequency Distributions, cumulative Frequency Distributions, scatter grams and time series distributions.... Such strategic planning is done using special spreadsheets in excel that have special provisions for entering the figures to produce easy-to-read… Managers, therefore, bear this responsibility of ensuring that the right figures and procedures are applied while entering the numbers so that the outcomes can reflect the true form of the business....
1 Pages (250 words) Assignment

Application of Descriptive Statistics

Examples include Frequency Distributions tables, histograms, mean, mode, and standard deviation.... frequency distribution tables and histograms groups data and illustrate frequencies of each group of data.... As a producer, frequency distribution tables, graphs and histograms helps the company to predict trend and hence determine its production capacity.... Similarly, frequency distribution by geographical markets helps the company to understand the market capacity....
2 Pages (500 words) Essay

Frequency Distribution

In a project it might be… However, with the use of Frequency Distributions we can easily get exact figures for every task or data collected for each and every employee (Lewis, 2006).... However, with the use of Frequency Distributions we can easily get exact figures for every task or data collected for each and every employee (Lewis, 2006).... Frequency Distributions allows for measuring of specific results for different people within a project....
1 Pages (250 words) Assignment

Language/Levels

Frequency Distributions show data on times series basis such as in per week, month, and year, while the charts show cumulative values in the periods.... Probability distributions also help in improving understanding of data through increased precision of statistics.... The probability distributions also incorporate both measures of central tendencies and measures of dispersion to ensure comprehensiveness of communicated data to stakeholders.... Summary and description of the data also assumes graphical approach in which frequency distribution graphs and charts are used to describe trends....
2 Pages (500 words) Assignment

Frequency Distributions (mod 3 slp)

The product of midpoint of the salary and the frequency is calculated.... The sum of all these products (3230) is… In the last column, the product of frequency and the square of mid-point of salary is computed for each salary range.... The sum of all these products is computed (as 542825) and divided by size of the distribution (20) to From the data collected in Module a frequency distribution can be prepared as shown in Table Table frequency Distribution Time (in Minutes) Frequency81-1001101-1203121-1400141-1603161-1808181-2003201-2202Figure 1: Graph for frequency DistributionThe distribution resembles a normal distribution as evidenced by the bar and line graphs depicted in Figure 1....
2 Pages (500 words) Essay

Handy Hydraulics Industries in the USA

This report “Handy Hydraulics Industries in the USA” is aimed to conduct the data analysis for the company.... This would be done in pursuance of the newly hired business data analyst.... This analysis would contain the basic and advanced statistical practices including evaluation of different statistics....
12 Pages (3000 words) Research Proposal
sponsored ads
We use cookies to create the best experience for you. Keep on browsing if you are OK with that, or find out how to manage cookies.
Contact Us