StudentShare
Contact Us
Sign In / Sign Up for FREE
Search
Go to advanced search...
Free

In Examples - Statistics Project Example

Cite this document
Summary
The paper "Statistics in Examples" analyzes that apply for positions at Company A and Company B. The probability of getting an offer from Company A is 0.4, and the probability of getting an offer from Company B is 0.3. Assuming that the two job offers are independent of each other…
Download full paper File format: .doc, available for editing
GRAB THE BEST PAPER95.1% of users find it useful
Statistics in Examples
Read Text Preview

Extract of sample "In Examples"

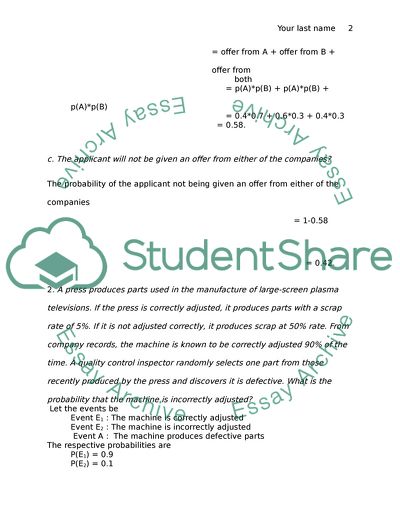
of the of the of the Stat 2300 Exam 1. An applicant has applied for positions at Company A and at Company B. The probability of getting an offer from Company A is 0.4, and the probability of getting an offer from Company B is 0.3. Assuming that the two job offers are independent of each other, what is the probability that a. The applicant gets an offer from both companies? The probability of getting the offer from A is 0.4 and that of getting the offer from B is 0.3. Hence, the probability of getting an offer from both the companies = 0.4*0.3 = 0.12. b. The applicant will get atleast one offer? The probability of the applicant receiving at least one offer = offer from A + offer from B + offer from both = p(A)*p(B) + p(A)*p(B) + p(A)*p(B) = 0.4*0.7 + 0.6*0.3 + 0.4*0.3 = 0.58. c. The applicant will not be given an offer from either of the companies? The probability of the applicant not being given an offer from either of the companies = 1-0.58 = 0.42. 2. A press produces parts used in the manufacture of large-screen plasma televisions. If the press is correctly adjusted, it produces parts with a scrap rate of 5%. If it is not adjusted correctly, it produces scrap at 50% rate. From company records, the machine is known to be correctly adjusted 90% of the time. A quality control inspector randomly selects one part from those recently produced by the press and discovers it is defective. What is the probability that the machine is incorrectly adjusted? Let the events be Event E1 : The machine is correctly adjusted Event E2 : The machine is incorrectly adjusted Event A : The machine produces defective parts The respective probabilities are P(E1) = 0.9 P(E2) = 0.1 Probability of machine producing defective parts after correctly adjusted P(A| E1) = 0.05, and Probability of machine producing defective parts after incorrectly adjusted P(A| E2) = 0.5 From Bayes’ theorem The required probability that the machine is incorrectly adjusted after it produced the defective part P(E2|A) =  =  =  =  = 0.5263. 3. Thirty-five percent of the students who enroll in a statistics course go to the statistics laboratory on a regular basis. Past data indicates that 20.5% of students make a grade of B or better. Additionally, 6.5% of students who do not go to the lab on a regular basis make a grade of B or better. Let L be the event that a student attended the lab on a regular basis. Let B be the event that a student earned a grade of B or better. a. Show the joint probability table for events L,Lc,B and Bc. The joint probability table for events L,Lc,B and Bc is B Bc Total L 0.14 0.21 0.35 Lc 0.065 0.585 0.65 Total 0.205 0.795 1 b. If a student is selected at random, what is the probability that the student both attended the lab and earned a grade of B or better? From the above depicted joint probability table, the required probability P(L ^B) = 0.14 c. Given that student regularly attended the lab, what is the probability that he or she earned a grade of B or better? The required probability P(B|L) = P (B ^L) / P(L) = 0.14 / 0.35 = 0.4. d. If a particular student made an A, determine the probability that she or he used the lab on a regular basis. The required probability P(L|B) = P(L^B)/P(B) = 0.14/0.205 = 0.6829 e. Are L and B mutually exclusive events? Explain using probabilities. For mutually exclusive events, the probability of an event occurring after one of them has already taken place is equal to zero. Hence if L, B are mutually exclusive then P(L|B)=P(B|L)=0. Let us calculate P(L|B) from the joint probability table P(L|B) = P(L ∩ B)/P(B) = 0.14 / 0.205 = 0.6829 Since this not equal to zero, the two events can take place in conjunction. Hence L,B are not mutually exclusive events. 4. A poll by the Gallup Organization sponsored by Philadelphia-based CIGNA Integrated Care found that about 40% of the employees have missed work dude to a musculoskeletal (back) injury of some kind. A random sample of 10 workers is to be drawn from a particular manufacturing plant. a. Find the probability that none of the workers have missed work due to back injuries, i.e find P(x=0). Let x be the no of workers who missed work due to back injuries n be the number of workers in sample = 10, Therefore, p the probability of employees missing work due to back injury = 0.4 q = 1-p = 0.6 From the binomial distribution we have P(x=0) =  × 0 × (0.6)10 = 0.0060. b. Find the probability that more than 7 of the workers have missed work due to back injuries, i.e find P(x>7) The required probability P(x>7) = P(x=8) + P(x=9) +P(x=10) =  × 8 × (0.6)2+× 9 × (0.6)1 + × 10 × (0.6)0 = 45 × 0.00065 ×0.36 + 10 × 0.00026×0.6 + 0.00010 = 0.0122. c. Suppose another random sample of 10 workers is selected the following year and it is found that 8 of the workers missed work due to back injuries. Based on your calculation in part C, do you believe the rate of missed work has gone up, or could it just be due to chance? If 8 people missed work in selected random sample of 10, it can be assumed that the rate of missed work has gone up. 5. Assume that the number of network errors experienced in a day in a local area network (LAN) is distributed as a passion random variable. The mean number of network errors experienced in day is 2.4. a. What is the probability that in any given day zero network errors will occur? P(x=0) = e-2.4 × 2.40 / 0! = 0.0907. b. What is the probability that in any given day at least 2 network errors will occur? Required probability P(x>1) = 1- P(x Read More
Cite this document
  • APA
  • MLA
  • CHICAGO
(Statistics in Examples Project Example | Topics and Well Written Essays - 2000 words, n.d.)
Statistics in Examples Project Example | Topics and Well Written Essays - 2000 words. https://studentshare.org/mathematics/1738799-stat-2300-exam-1
(Statistics in Examples Project Example | Topics and Well Written Essays - 2000 Words)
Statistics in Examples Project Example | Topics and Well Written Essays - 2000 Words. https://studentshare.org/mathematics/1738799-stat-2300-exam-1.
“Statistics in Examples Project Example | Topics and Well Written Essays - 2000 Words”. https://studentshare.org/mathematics/1738799-stat-2300-exam-1.
  • Cited: 0 times

CHECK THESE SAMPLES OF Statistics in Examples

Importance of Statistics in Research Process

The paper "Importance of statistics in Research Process" tells us about the process of systematic collection of information.... Statistics such as measures of central tendency, measures of variation, graphs, and bar charts, etc are examples of descriptive statistics.... The various examples of inferential statistics techniques include t-test, Analysis of Variance, Correlation analysis, regression analysis, factor and cluster analysis and discriminant function analysis, etc....
5 Pages (1250 words) Essay

How Statistics Is Applied in Our Everyday Life and Why It Is Useful

Use of statistics in tackling criminal activities.... examples include linear regression and correlation analysis.... This paper “How statistics Is Applied in Our Everyday Life and Why It Is Useful” talks about the effectiveness of statistical analysis in different areas of everyday life and analyzes if the statistics can tell us trends on what happened in the past and predict what will happen in the future.... statistics is defined as a branch of applied mathematics which is concerned with the collection and interpretation of quantitative data, and the use of probability theory to estimate population parameters....
7 Pages (1750 words) Coursework

Statistics1

examples of such measures are measures of central tendency such as mean, median, mode and measured of dispersion such as standard deviation and range.... examples ofsuch measures are measures of central tendency such as mean, median, mode and measured of dispersion such as standard deviation and range.... Inferential statistics are… In simplest of terms, sample is a subset of population which is the whole set for which we want to make inferences about....
2 Pages (500 words) Statistics Project

Statistical Errors in Expected Inflation Rates

To the common man this would mean that if a product was 100% then we expect to buy it at 102% because of adding the 2% that is there and This is a good example of a story of the mistakes that people make about statistics.... This year was no exception and going through one of the news given by Draghi I find that there are a lot more that is untold about inflation rates leading to misleading information to the general… The central bank president from the European announced that this year 2012, there would be 2% inflation....
3 Pages (750 words) Research Paper

Find an example of descriptive or inferential statistics

The report further indicates that an average of WEEK THREE statistics: DESCRIPTIVE statistics Summary of the report ‘Health department announces 41% drop in deaths among black New Yorkers living with HIV' was published by the New York's government press on 7 February 2012.... Descriptive statistics.... Data preparation and descriptive statistics....
1 Pages (250 words) Essay

Statistics in Business

While inferential statistics involves the description of the population based on the results drawn statistics in Business Introduction Statistics as an activity or discipline is concerned with the collection, organization, manipulation, interpretation and presentation of data (Anderson, Sweeney & Williams, 1994).... Role of statistics in Business Decision MakingStatistics plays an integral role in business decision making in the modern setup.... However, the data that falls in this category is known to have no starting point, examples being the Celsius and Fahrenheit scales used to measure temperature (Thompson, 2006)....
2 Pages (500 words) Essay

Chi-Squared Testing

In the essay “Chi-Squared Testing” the author provides the one-sample chi-square test to evaluate whether cooking method affects taste.... From the analysis, it is evident that there is a significant difference in the preference of potato chips hence we fail to accept the null hypothesis....
3 Pages (750 words) Essay

Healthcare and Statistics: Examples

The aim of this assignment "Healthcare and Statistics: examples" is to analyze the concepts of statistical abuse, statistical significance, sample size, etc as well as answer some of the most common questions regarding statistics as a science and its relationship with the healthcare....
7 Pages (1750 words) Term Paper
sponsored ads
We use cookies to create the best experience for you. Keep on browsing if you are OK with that, or find out how to manage cookies.
Contact Us