StudentShare
Contact Us
Sign In / Sign Up for FREE
Search
Go to advanced search...
Free

Modelling the Amount of a Drug in the Bloodstream - Lab Report Example

Cite this document
Summary
In the "Modelling, the Amount of a Drug in the Bloodstream" paper, the rate of deterioration of a malaria-treating drug in a human being’s bloodstream is investigated. A graph, which gives statistics over a 10-hour period of this rate after a 10µg dose has been administered is used…
Download full paper File format: .doc, available for editing
GRAB THE BEST PAPER97.2% of users find it useful
Modelling the Amount of a Drug in the Bloodstream
Read Text Preview

Extract of sample "Modelling the Amount of a Drug in the Bloodstream"

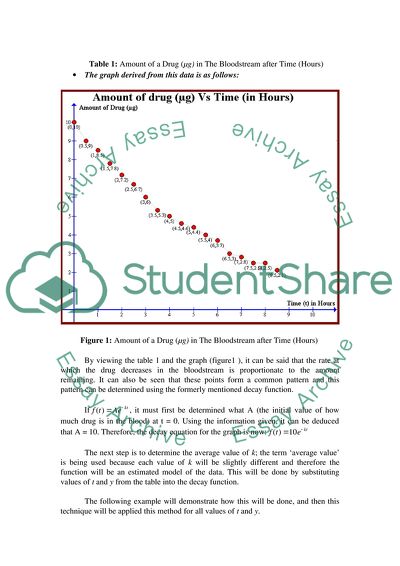
Math Portfolio- Modelling the Amount of a Drug in the Bloodstream Introduction In this portfolio, the rate of deterioration of a malaria-treating drug in a human being’s bloodstream will be investigated. A graph, which gives statistics over a 10-hour period of this rate after a 10µg dose has been administered, will be used to help find a suitable function to model the data. The effect of doses being continually administered during regular 6 hour periods for a whole day, and then from these values estimate what would happen over the next week if no further does were taken, will be calculated, and finally what would happen if doses would continue to be taken every 6 hours. The graph is an exponential decay graph. Examples of data that fit exponential decay are those of radioactive decay, first order loss rates in the atmosphere, and even simply water loss from a bucket with a hole in the bottom. The general formula for the amount present at any time t in an exponential decay graph is given by the formula:, where A is the amount present at time t = 0, and k is a constant 1. In a decay graph, k < 0. Using the graph, the following data results table can be drawn: Time in Hours (t) Amount of drug in µg (y) 0 10 0.5 9 1 8.5 1.5 7.8 2 7.2 2.5 6.7 3 6 3.5 5.3 4 5 4.5 4.6 5 4.4 5.5 4 6 3.7 6.5 3 7 2.8 7.5 2.5 8 2.5 8.5 2.1 9 1.9 9.5 1.7 10 1.5 Table 1: Amount of a Drug (µg) in The Bloodstream after Time (Hours) The graph derived from this data is as follows: Figure 1: Amount of a Drug (µg) in The Bloodstream after Time (Hours) By viewing the table 1 and the graph (figure1 ), it can be said that the rate at which the drug decreases in the bloodstream is proportionate to the amount remaining. It can also be seen that these points form a common pattern and this pattern can be determined using the formerly mentioned decay function. If, it must first be determined what A (the initial value of how much drug is in the blood) at t = 0. Using the information given, it can be deduced that A = 10. Therefore, the decay equation for the graph is now: The next step is to determine the average value of k; the term ‘average value’ is being used because each value of k will be slightly different and therefore the function will be an estimated model of the data. This will be done by substituting values of t and y from the table into the decay function. The following example will demonstrate how this will be done, and then this technique will be applied this method for all values of t and y. For the values t = 0.5 and y = 9: Then using the knowledge that , and using logarithm rules: Therefore : (4 d.p.) The obvious general formula that can be seen from this process, , can be used to simplify the process. Using this technique, and the value of A=10, all known values of (t) and (y) were calculated to find (k) at each value. (t) (y) (k) 0.5 9 0.2107 1 8.5 0.1625 1.5 7.8 0.1656 2 7.2 0.1642 2.5 6.7 0.1602 3 6 0.1703 3.5 5.3 0.1814 4 5 0.1733 4.5 4.6 0.1726 5 4.4 0.1642 5.5 4 0.1666 6 3.7 0.1657 6.5 3 0.1852 7 2.8 0.1818 7.5 2.5 0.1848 8 2.5 0.1733 8.5 2.1 0.1836 9 1.9 0.1845 9.5 1.7 0.1865 10 1.5 0.1897 Table 2: Values of k The average of all the (k) values must now be calculated in order to obtain a general value for (k). AVERAGE = TOTAL SUM TOTAL AMOUNT OF VALUES AVERAGE = 3.5267 20 AVERAGE = 0.176335 Therefore, the function derived from the above data becomes : , if initial drug amount in 10 µg or , if initial drug amount in not known To test the suitability of this function, a graph (figure 2) was drawn of it and compared it to the initial data graph. Figure 2: Graph of function and Data Plots The values of the original graph are marked by the red circles, and the green curve is the curve of the function. As can be seen, the values of the graph of the function are very similar to the values of the first graph. It is obvious that the graph is not completely accurate for several reasons- mainly, because the (k) values were rounded up to 4 decimal places and therefore when the average was calculated, it was not completely accurate. Therefore, when the function was used to draw the graph, all points were slightly off the correct value. In addition, when the function was used to plot the graph, the exponent of e was rounded to 4 decimal points. This being taken into account however, this model is a very suitable representation of the initial graph. The function, slightly differ from the given values of the graph (between hour 4-7). However, for the all other points, the graph follows the same path as the one given. Therefore, we can say that the function, is suitable to model the data of the graph. A graph illustrating what will happen to a patient if they are instructed to take 10µg of the drug every 6 hours, over a 24 hour period, will now be sketched. The calculations made here will assume that the patient takes their first dose without any previous drug in their system. They also assume that the drug will follow a regular pattern of decay in the patient’s body that does not change according to amount present in the blood at any current time. In the initial data, it can be seen that after 6 hours, the amount of the drug in the blood has reached 3.7µg- a decrease of 6.3µg. If another 10µg dose is taken, this means that the amount in the blood will rise to 13.7µg. Left for 6 hours, and assuming that it will drop by 6.3µg as in the first dosage, the amount of drug in the blood will now be 7.4µg. Table 3 was drawn up to illustrate the results, using the pattern of calculation described above: Hours (t) Amount of drug present in blood (µg) before addition of new dose Amount of drug present in blood (µg) after addition of new dose 0 0 10 6 3.7 13.7 12 7.4 17.4 18 11.1 21.1 24 14.8 ------ Table 3: The Drug dosage for 24-hour period based on data The diagram for this data is as follows: Figure 3: The Drug dosage for 24-hour period based on Table 3 As can be seen, the trend follows an increase, shown on the graph (figure 3) by a translation of the curve as it moves upwards and to the right. As this graph is just a sketch, it is not completely accurate because in reality the graph is curved, not just straight lined (similarly to the first graph-figure 1). The maximum level of the malaria drug in the system during this 24-hour period is 21.1µg at the start of fourth period (at start of 19th hour), and the minimum level is 3.7µg after 6 hours (at the end of first period). To gain even more accurate results, the function will be used to calculate further values of this situation, and another graph drawn. Amount of drug at the start (first dose) is 10 µg and if we calculate amount remained after 6 hours using our model (function), then it will come as 3.5 µg. Now this dose remained will be available at the start of new dose after six hours and the combined those will be 13.5 µg. Now this 13.5 µg dose will be taken for the determining the amount of drug remained after 12 hours and it will come as 4.7µg. Similarly, the amount remained for each period will be calculated and is given in below table 4. Here only 24-hour time is considered for calculation. Hours (t) Amount of drug present in blood (µg) before addition of new dose Amount of drug present in blood (µg) after addition of new dose 0 0 10 6 3.5 13.5 12 4.7 14.7 18 5.1 15.1 24 5.2 --- Table 4: The Drug dosage for 24-hour period based on function Figure 4: The amount of the drug in the bloodstream over a 24-hour period Figure 4 represents the amount of the drug in the bloodstream over a 24-hour period. In the graph (figure 4 ) assumption is made that after every six hour 10 µg of drug is given to patient and it adds in the drug remained in the bloodstream ( value of constant ‘A’ in function , will change after every six hours). Therefore, the function will change after every six hours as the remaining drug adds into the given drug every six hours. Initially the drug given was 10 µg. After six hour, it remains to 3.5 µg. Now when 10 µg is again give to patient then it will become 13.5 µg. Moreover, this pattern will be continues for every six hours. Since we wanted to plot for 24-hour period, so for the second, third and fourth period the function can be written as, and . The value of t is changed here, so that the graph plotted continuous from the last point, other wise it will start from the starting point. Maximum amount will be 15.1 µg at start of 19th hour. Minimum amount will be 3.5 µg at end of 6th hour. Now, predictions will be made for what would happen over the next week if no further doses of the drug were taken, again assuming that the decay would follow the model function . Figure 5: Drug in the bloodstream over a week period when initially 10µg is given From the figure 5, it can be seen that, when after initially 10µg of drug is given to the patient and thereafter no drug is given to the patients then the function is when plotted for week period, the value of y approaches to 0 (actual value will be 0.0524 µg) after 30 hours. However, it will never become zero because the value of in function will be always greater than 0. Finally, predictions will be made for what would happen over the next week if doses continue to be taken after every 6 hours, again assuming that the decay would follow the model function . Table 5 shows the amount of drug present in blood (µg) before addition of new dose and the amount of drug present in blood (µg) after addition of new dose for every six-hour period. Hours (t) Amount of drug present in blood (µg) before addition of new dose Amount of drug present in blood (µg) after addition of new dose 0 0 10 6 3.5 13.5 12 4.7 14.7 18 5.1 15.1 24 5.2 15.2 30 5.3 15.3 36 5.3 15.3 42 5.3 15.3 --- ---- ---- Table 5: The Drug dosage for long period (week) based on function Figure 6: The amount of the drug in the bloodstream over a long period (week) From table 5 it is obvious that after some time the value of the drug remain will be constant and will not change thereafter. Here after period five the drug remains is constant and is 5.3 µg. In figure 6 (graphs based on table 5), initially the drug given was 10 µg (first dose). After six hour, it remains to 3.5 µg (using function). Now when 10 µg is again give to patient then it became 13.5 µg. Moreover, this pattern will be continues for every six hours. Therefore for the second, third, fourth, fifth, sixth…. period the function can be written as , , , , … The value of t is changed here, so that the graph plotted continuous from the last point, other wise it will start from the starting point. Maximum amount will be 15.3 µg at start of 31st hour and will remain thereafter at the start of each period. Minimum amount will be 3.5 µg at end of 6th hour. Read More

In the initial data, it can be seen that after 6 hours, the amount of the drug in the blood has reached 3.7µg- a decrease of 6.3µg. If another 10µg dose is taken, this means that the amount in the blood will rise to 13.7µg. Left for 6 hours, and assuming that it will drop by 6.3µg as in the first dosage, the amount of drug in the blood will now be 7.4µg.Table 3 was drawn up to illustrate the results, using the pattern of calculation described above: Hours (t) Amount of drug present in the blood (µg) before addition of new dose Amount of drug present in the blood (µg) after addition of a new dose0 0 106 3.7 13.712 7.4 17.418 11.1 21.124 14.

8 ------Table 3: The Drug dosage for a 24-hour period based on data• The diagram for this data is as follows:Figure 3: The Drug dosage for the 24-hour period based on Table 3As can be seen, the trend follows an increase, shown on the graph (figure 3) by a translation of the curve as it moves upwards and to the right. As this graph is just a sketch, it is not completely accurate because in reality the graph is curved, not just straight-lined (similarly to the first graph-figure 1). The maximum level of the malaria drug in the system during this 24-hour period is 21.

1µg at the start of the fourth period (at the start of the 19th hour), and the minimum level is 3.7µg after 6 hours (at the end of the first period).• To gain even more accurate results, the function will be used to calculate further values of this situation, and another graph drawn.The amount of drug at the start (first dose) is 10 µg and if we calculate the amount remaining after 6 hours using our model (function), then it will come as 3.5 µg. Now this does remain will be available at the start of the new dose after six hours and the combined those will be 13.

5 µg. Now this 13.5 µg dose will be taken the determining the amount of drug remained after 12 hours and it will come as 4.7µg. Similarly, the amount that remained for each period will be calculated and is given in table 4. Here only 24-hour time is considered for calculation.Hours (t) Amount of drug present in the blood (µg) before addition of new dose Amount of drug present in the blood (µg) after addition of a new dose0 0 106 3.5 13.512 4.7 14.718 5.1 15.124 5.

2 ---Table 4: The Drug dosage for the 24-hour period based on function Figure 4: The amount of the drug in the bloodstream over a 24-hour periodFigure 4 represents the amount of the drug in the bloodstream over a 24-hour period. In the graph (figure 4 ) assumption is made that after every six-hour 10 µg of a drug is given to a patient and it adds in the drug remained in the bloodstream ( value of constant ‘A’ in function, will change after every six hours). Therefore, the function will change after every six hours as the remaining drug adds into the given drug every six hours.

Initially, the drug given was 10 µg. After six-hour, it remains at 3.5 µg. Now when 10 µg is again given to the patient then it will become 13.5 µg. Moreover, this pattern will continue every six hours. Since we wanted to plot for a 24-hour period, so for the second, third, and fourth periods the function can be written as, and.The value of t is changed here so that the graph plotted continuous from the last point, otherwise, it will start from the starting point.The maximum amount will be 15.

1 µg at the start of the 19th hour.The minimum amount will be 3.5 µg at end of the  6th hour.• Now, predictions will be made for what would happen over the next week if no further doses of the drug were taken, again assuming that the decay would follow the model function.Figure 5: Drug in the bloodstream over a week period when initially 10µg is givenFrom figure 5, it can be seen that when after initially 10µg of a drug is given to the patient and thereafter no drug is given to the patients then the function is when plotted for a week period, the value of y approaches 0 (actual value will be 0.

0524 µg) after 30 hours. However, it will never become zero because the value of in function will be always greater than 0.

Read More
Cite this document
  • APA
  • MLA
  • CHICAGO
(Modelling the Amount of a Drug in the Bloodstream Lab Report Example | Topics and Well Written Essays - 2000 words, n.d.)
Modelling the Amount of a Drug in the Bloodstream Lab Report Example | Topics and Well Written Essays - 2000 words. https://studentshare.org/mathematics/1710414-maths-standard-portfolio
(Modelling the Amount of a Drug in the Bloodstream Lab Report Example | Topics and Well Written Essays - 2000 Words)
Modelling the Amount of a Drug in the Bloodstream Lab Report Example | Topics and Well Written Essays - 2000 Words. https://studentshare.org/mathematics/1710414-maths-standard-portfolio.
“Modelling the Amount of a Drug in the Bloodstream Lab Report Example | Topics and Well Written Essays - 2000 Words”. https://studentshare.org/mathematics/1710414-maths-standard-portfolio.
  • Cited: 0 times

CHECK THESE SAMPLES OF Modelling the Amount of a Drug in the Bloodstream

Alternative solutions for Animal testing on medication

There was a high-quality data available for them for most of the enzymes of glycolysis in the bloodstream form of Trypanosoma brucei, including all of those likely to be influential in controlling glycolytic flux in this organism (Cornish-Bowden, Eisenthal 165).... In Computer Simulation as a Tool for Studying Metabolism and drug Design authors studied the Trypanosoma brucei (parasitic protist species that causes African trypanosomiasis or sleeping sickness) using computer simulation....
4 Pages (1000 words) Essay

Asthma and Pathophisiological Template Case Study

Due to edema, mucus plug formation, bronchoconstriction, and remodeling, the amount of oxygen entering the lungs diminish and carbon dioxide retention(Morris, 2011, n.... Lungs primary function is to deliver oxygen into the bloodstream and remove carbon dioxide from the blood.... As Jason suffers from asthma, various structural and functional changes may occur such as airway disturbance, filling of mucous plugs in the airways, larger and numerous mucus-producing cells, edematous bronchioles, increasing number of inflammatory cells infiltrating airways, thickened connective tissue, denuded respiratory epithelium, and increased amount of smooth muscles surrounding the airway....
3 Pages (750 words) Essay

How Malaria Is Caused

According to the authors, when a person is bitten by a female mosquito, the parasite enters the bloodstream through the mosquito's saliva and then makes its way to the liver.... Malaria Malaria Introduction Malaria is a contagious disease that costs the world several billions of dollars every year....
4 Pages (1000 words) Research Paper

The Toxicity of Nanomaterials

Fish was used as a specimen in this study which showed results that the fish had accumulated nanomaterials in their gills intestine and the bloodstream.... The Toxicity of Nanomaterials Introduction The science of nanotechnology has become popular in the modern world making it a common application for a large number of scientific studies and research....
4 Pages (1000 words) Dissertation

Biology - Infectious Diseases

Instructor Date Infectious Diseases Infectious diseases occur when a parasite infects an organism causing illness and characteristic symptoms to occur.... The parasite may be bacteria, virus, protozoa or fungi.... Most of the infections come with symptoms.... ... ... ... For example, coughing, high body temperature, pimples, scabs or stomach upsets....
6 Pages (1500 words) Research Paper

THE ROLE OF CONTROLLED DRUG RELEASE IN CANCER THERAPEUTICS

Multi drug Resistance This leads to most of the drugs to have little efficacy unless used in huge doses which will in turn lead to toxic side effects.... The main problem in cancer treatment is the multi-drug resistance of the cancerous cells to chemotherapeutics.... Loss of P53 genes that promotes cell apoptosis, over-expression of bd-z genes that blocks cell death, reduced drug uptake due to damage of foliate carriers, and increased DNA repair (Dass and Choong 2008, p....
10 Pages (2500 words) Essay

Case Study Regarding Asthma

Lungs primary function is to deliver oxygen into the bloodstream and remove carbon dioxide from the blood.... The aim of the study : (1) to explain the process that leads to the structural and functional changes resulting from Jason's asthma; (2) to explain how four of Jason's clinical manifestations are related to the structural and functional changes....
5 Pages (1250 words) Essay

The Role of Drug Couriers and Drug Trafficking Industry

They risk not only their personal liberty if caught, but also face the possibility of death due to lethal doses of the drug entering their bloodstream, if a swallowed packet ruptures.... This essay analyzes that drug trafficking is a capital offense in most nations across the globe, including the western democracies, Singapore, Thailand, China, and Egypt.... drug couriers also known as 'mules' 'physically transport illegal drugs across international rather than national borders'....
12 Pages (3000 words) Research Paper
sponsored ads
We use cookies to create the best experience for you. Keep on browsing if you are OK with that, or find out how to manage cookies.
Contact Us