StudentShare
Contact Us
Sign In / Sign Up for FREE
Search
Go to advanced search...

Statistical Mathematics - Statistics Project Example

Cite this document
Summary
The data set (Table 1) represents values of daytime and nighttime accidents as well as total number of vehicles on the street over twelve months period. These values were used to construct three histograms to represent frequencies of accidents that took place during daytime,…
Download full paper File format: .doc, available for editing
GRAB THE BEST PAPER92.8% of users find it useful
Statistical Mathematics
Read Text Preview

Extract of sample "Statistical Mathematics"

Download file to see previous pages

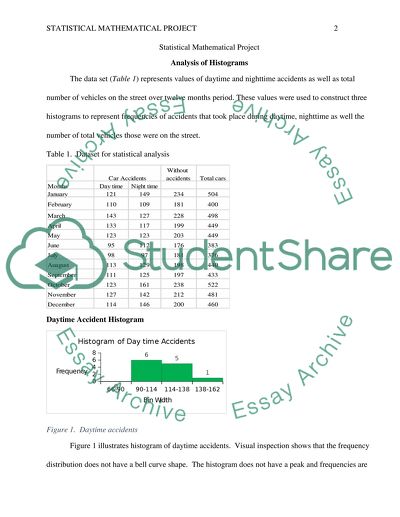
The peak is flat, which is characterized by kurtosis = -0.05. The peak is off centered; the distribution is slightly skewed to the right, which is marked by skewness = 0.06. Figure 2 illustrates histogram of daytime accidents. Visual inspection shows that the frequency distribution does not have a bell curve shape. The histogram does not have a peak and frequencies are not equally distributed. The peak is flat, which is characterized by kurtosis = -0.07. The peak is off centered; the distribution is moderately skewed to the right, which is marked by skewness = 0.42. Figure 3 illustrates histogram of total vehicles on the street.

Visual inspection shows that the frequency distribution does not have a bell curve shape. The histogram resembles the back of a two-humped camel; it is close to a bimodal distribution. The histogram does not have a peak and frequencies are not equally distributed. The peak is flat, which is characterized by kurtosis = -0.88. The peak is off centered; the distribution is moderately skewed to the left, which is marked by skewness = -0.14. The assignment is using a data set that has three variables: daytime car accidents, nighttime car accidents and total observed cars in evaluating number of accidents (Table 1). . The distribution characters of the variable in statistics are measured through the calculation and analysis of central tendency and dispersion of the data set.

The following section provides the analysis mentioned above. Each variable has twelve values. The assignment uses mean, mode, median, and midrange to study the central tendency of the data set. Table 2 describes the central tendency. The mean and median tell us about data those are on the right and left sides of theses values. For example, total cars mean is 450. In ascending orders, the set shows that five values are on the left, and seven values are on the right side of the average. When we compare the same set with the median value of

...Download file to see next pages Read More
Cite this document
  • APA
  • MLA
  • CHICAGO
(“Statistical Mathematics Statistics Project Example | Topics and Well Written Essays - 1000 words”, n.d.)
Statistical Mathematics Statistics Project Example | Topics and Well Written Essays - 1000 words. Retrieved from https://studentshare.org/mathematics/1695676-statistical-mathematics
(Statistical Mathematics Statistics Project Example | Topics and Well Written Essays - 1000 Words)
Statistical Mathematics Statistics Project Example | Topics and Well Written Essays - 1000 Words. https://studentshare.org/mathematics/1695676-statistical-mathematics.
“Statistical Mathematics Statistics Project Example | Topics and Well Written Essays - 1000 Words”, n.d. https://studentshare.org/mathematics/1695676-statistical-mathematics.
  • Cited: 0 times

CHECK THESE SAMPLES OF Statistical Mathematics

Inferential Statistics: Michaelis-Menten equation

This paper assumes that this error is insignificant since it is statistically independent and it is a normal distribution within Statistical Mathematics.... Despite the fact that statistical limitations have been developed in terms Km and Vmax, there are still large inherent errors when it comes to estimation of these two parameters.... statistical calculation of the standard error when it comes to Km and Vmax has been neglected for long despite the availability of techniques of determining these parameters....
3 Pages (750 words) Essay

MATHEMATICAL STATISTIC AND ITS IMPACT ON LAWENFORCEMENT

There is need for lawyers to be equipped with this knowledge (Society for Industrial and Applied mathematics, 2009).... ociety for Industrial and Applied mathematics.... mathematics and the law.... Philadelphia: society for industrial and applied mathematics.... There are many methods of applying these statistical tools and the methods applied depend on the complexity of the… Old methods of analysis involve manual computing and processing of data while modern statistics involve the use of computer and tailor made programs to aid in statistical analysis. ...
2 Pages (500 words) Term Paper

Qualitative and Quantitative Research

nbsp;Quantitative research involves the heavy use of applied mathematics.... While quantitative methods of research use mathematics and statistics, qualitative methods of research make use of in-depth analysis of secondary research approaches.... The author of this essay "Qualitative and Quantitative Research" comments on certain kinds of research that require either a qualitative or quantitative research depending on the nature and methodology of the paper....
1 Pages (250 words) Essay

Global Business Analysis: Japan

This research paper presents the analysis of the factors that an American company should consider while establishing business units in Japan, a country which has diverse culture and politics compared to that in America and was reluctant in embracing globalization.... hellip; Until the mid-80's Japan's economic progress was in the right direction....
15 Pages (3750 words) Research Paper

Six Fundamental Steps in Implementing a Research Design

The paper "Six Fundamental Steps in Implementing a Research Design" states that the three dimensions of research could rely on secondary and primary data; that is, they can all rely on information that is already documented or even first-hand information from the field.... hellip; Theoretical studies are majorly qualitative in nature; this simply means that the dominant method of data collection applied is qualitative data collection methods as compared to phenomenal studies that may depend on qualitative or quantitative data (Aldag & Tinsley, 2013); phenomenal studies are also majorly scientific....
6 Pages (1500 words) Assignment

Globally Optimized Operations

The complexity and dynamic nature of today's business world presents a variedly increased operating drawbacks for companies aiming at achieving sustainability while promotionally working with a chain of with globally established trading partners, regulators, risk management… Globally, optimized operations aim at controlling the challenges of supply chain management....
5 Pages (1250 words) Research Paper

Identity in Context and Stereotyping

As far as gender is concerned, there exists a stereotype that females are poor in mathematics and this has proven to negatively impact them by having them down their tools in the subject, thereby compromising their performance.... This article "Identity in Context and Stereotyping" describes the main stereotypes that exist in our society, concerning gender and education....
9 Pages (2250 words) Article

Mathematical Thinking

From the analysis it can be concluded that female students have a higher achievement ratio in total mathematics compared to that of male students.... it can be generalized that female students are better in mathematics classes as compared to male studentsQuestion fourDifferences in schoolsIn overall performance suburban schools indicate higher performance index than the urban or rural schools....
4 Pages (1000 words) Essay
sponsored ads
We use cookies to create the best experience for you. Keep on browsing if you are OK with that, or find out how to manage cookies.
Contact Us