StudentShare
Contact Us
Sign In / Sign Up for FREE
Search
Go to advanced search...
Free

Slender Vision Ltd Activity Analysis - Case Study Example

Cite this document
Summary
In the case study 'Slender Vision Ltd Activity Analysis '  provides a statistical analysis of the activities of this corporation in the sale of flat screens for computers. The study used data such as screen types, the total number of units sold, the cost of screens, as well as the influence of the manager’s gender, etc…
Download full paper File format: .doc, available for editing
GRAB THE BEST PAPER95.6% of users find it useful
Slender Vision Ltd Activity Analysis
Read Text Preview

Extract of sample "Slender Vision Ltd Activity Analysis"

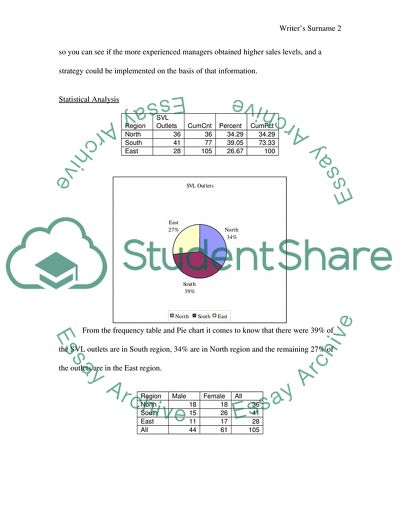
Assignment Introduction Slender Vision Ltd (SVL) is one of the large company selling Flat screens for computers. It has many shops throughout the United Kingdom (UK). Most of the shops are located in the regions: North, South and East of the UK. There are a total of 105 outlets. Three types of screens are predominately sold (Type A= 12inches, Type B= 15inches and Type C= 19inches). In this study we are using total sales data together with other useful information that is stored by the assistant managing director of SVL. The data is going to be analyzed using the software package Minitab, version 13, which is designed to make data analysis easier. The first step was to create an extra column ‘C10’ to hold the total sales figures – for each outlet, as this was to make it easier to see which outlets were performing well. Descriptive statistics were used to provide summaries of the information, which makes it easier to compare and analyze different types of data. Correlation and regression was another useful feature of Minitab, which was applied to see which factors may affect the total sales and to what extent. For example, it would be viable to look at the experience of the managers running the outlets, to the sales achieved by that outlet – so you can see if the more experienced managers obtained higher sales levels, and a strategy could be implemented on the basis of that information. Statistical Analysis Region SVL Outlets CumCnt Percent CumPct North 36 36 34.29 34.29 South 41 77 39.05 73.33 East 28 105 26.67 100 From the frequency table and Pie chart it comes to know that there were 39% of the SVL outlets are in South region, 34% are in North region and the remaining 27% of the outlets are in the East region. Region Male Female All North 18 18 36 South 15 26 41 East 11 17 28 All 44 61 105 The frequency table shows that numbers of female managers are more than male managers in SVL outlets. Variable N Mean StDev TYPE A 105 176.26 40.18 TYPE B 105 250.76 28.08 TYPE C 105 327.22 42.8 The mean (average) takes the total sales of SVL flat screens of computer and divides it by 105 – the number of data sets there are, to give the average value of the sales for that flat screen. The Type C flat screen clearly provides the highest average revenue, with Type A having the lowest. This leads to the idea that the Type C screens could be invested in further, to generate more sales or the other two brands improved. The standard deviation measures how much the data varies – i.e. how much the sales figures vary from one another. The highest variation is for the Type C and the Type A screens, meaning that more of these brands may be sold in a particular region. The lowest standard deviation is for the Type B screens, indicating that the sales for this are more stable and vary less. The experience of the manager could also be an important factor in the sales (investigated using correlation and regression further), therefore a Minitab output is provided of this numerical information: Mean of Experience: Mean of Experience = 9.5 Variable Experien N Mean Median Tr Mean StDev SE Mean Total 1 1 884.00 884.00 884.00 * * Sale 4 3 641.7 676.0 641.7 62.1 35.8 5 9 628.6 633.0 628.6 50.7 16.9 6 9 696.3 707.0 696.3 94.8 31.6 7 9 700.1 705.0 700.1 74.6 24.9 8 11 718.3 705.0 720.2 59.6 18.0 9 16 752.1 758.5 756.8 84.5 21.1 10 8 756.7 779.0 756.7 123.3 43.6 11 9 829.6 840.0 829.6 46.6 15.5 12 7 805.9 838.0 805.9 58.9 22.3 13 6 833.2 845.0 833.2 50.8 20.7 14 7 786.9 825.0 786.9 83.2 31.4 15 6 850.33 846.50 850.33 19.53 7.97 16 4 864.2 861.5 864.2 23.0 11.5 Variable Experien Min Max Q1 Q3 Total 1 884.00 884.00 * * Sale 4 570.0 679.0 570.0 679.0 5 550.0 713.0 591.5 669.0 6 567.0 800.0 600.0 795.5 7 561.0 782.0 640.5 763.5 8 614.0 805.0 666.0 762.0 9 571.0 867.0 686.8 810.2 10 515.0 890.0 678.0 859.2 11 770.0 903.0 785.5 866.5 12 716.0 864.0 743.0 855.0 13 741.0 885.0 797.2 871.5 14 653.0 880.0 695.0 843.0 15 830.00 885.00 835.25 864.00 16 842.0 892.0 843.8 887.5 The average years of experience is almost 10 years for management, although the standard deviation is also the highest at this point – showing that the sales may vary quite a bit. The median shows the middle value once the data (sales) is put in ascending order, which is generally increasing as the years of experience increase. The quarter 1 values show what 25% of the managers get below (in terms of sales) and the quarter 3 values show what 25% of the managers get above. 50% of the managers get between the quarter 1 and quarter 3 figures (i.e. it excludes the two extreme values). For example, out of the 16 managers that had 9 years experience (highlighted), 25% created below £686,800 sales, whilst 25% created above £810,200. The remaining 50% earned in-between these two values. The minimum and maximum columns show the highest and lowest values recorded. What could be the reasons for this variation? It could be that they are in different regions – e.g. would the north need as many phones as in the east, and vice versa. Assessment of Sales Performance The above output shows that overall, the Type C screen has the highest value of sales, followed by the Type B and lastly the Type A screen – which is almost only half of the sales of the Type C flat screens. Descriptive Statistics: Type A (£000s), Type B (£000s), Type C (£000s) by Region Variable Region N Mean Median Tr Mean StDev SE Mean TYPE A 1 36 181.03 187.00 182.59 40.88 6.81 2 41 173.22 175.00 174.27 41.95 6.55 3 28 174.57 171.50 175.38 37.37 7.06 TYPE B 1 36 253.47 265.00 255.97 32.73 5.45 2 41 251.66 254.00 252.65 23.13 3.61 3 28 245.96 257.50 246.58 28.67 5.42 TYPE C 1 36 328.22 336.00 330.47 42.52 7.09 2 41 325.88 341.00 329.84 45.87 7.16 3 28 327.89 339.50 328.81 39.86 7.53 Variable Region Min Max Q1 Q3 TYPE A 1 96.00 250.00 150.25 213.75 2 100.00 228.00 128.50 209.50 3 104.00 224.00 138.25 211.50 TYPE B 1 182.00 286.00 237.50 279.50 2 198.00 288.00 237.00 269.00 3 195.00 281.00 219.50 268.75 TYPE C 1 236.00 382.00 307.00 364.50 2 180.00 384.00 301.50 358.00 3 252.00 380.00 293.25 359.50 The above output shows that the Type C flat Screens of SVL have the highest ‘maximum’ values in all three regions, with its ‘minimum’ values being almost as high as Type B Screens ‘maximum’ values. The median value shows that for Type A, region 1 (North) had the highest value. For Type B, the north, again, had the highest value and for Type C, region 2 (east) had the highest value. These could be indicators to show which type of screen is selling best in which region. Descriptive Statistics: Total sales by Gender Variable Gender N Mean Median Tr Mean StDev SE Mean Total Sa 1 44 745.6 758.5 747.7 96.0 14.5 2 61 760.5 782.0 764.8 97.8 12.5 Variable Gender Min Max Q1 Q3 Total Sa 1 550.0 903.0 686.0 803.5 2 515.0 892.0 671.0 843.0 The Minitab output shown above displays the total sales split by gender of the managers. Out of 105, 61 were females. The average of the sales, though, is only slightly lower for the males. The ‘box plot’ shown on the following page makes this data easier to understand… The line in the box indicates the median, the ‘top whisker’ displays the maximum value for the sales and the ‘bottom whisker’ displays the minimum value for the sales generated. This shows that a male manager managed to achieve little higher than any of the female managers. This shows that the male managers do have the potential to obtain high sales, although there is not a very high percent of them employed. Here the Bar chart shows that female managers are performing well in the east region, with their average mean of total sales almost being level to their male colleagues. They are doing well in almost all the regions of England, so it may be feasible to introduce greater female managers in the all regions Factors Which Affect Sales The following results were obtained from Minitab by using the correlation and regression functions to see how certain factors are related to sales. . Regression Analysis: Total sales versus Advertising The regression equation is Total Sales = 499 + 0.248 Advertising expense Predictor Coef StDev T P Constant 499.08 21.59 23.12 0.000 x 0.24849 0.02018 12.31 0.000 S = 61.91 R-Sq = 59.5% R-Sq(adj) = 59.2% Y = a + b X Y-intercept = 499.078 Slope = 0.248 Total Sales = 499.078 + (0.248) Advertising expense The estimated regression coefficient b = 0.248 indicates that the values of Y change by (0.248) units for a unit increase in X. The correlation between Total sales and advertising is 0.772 that shows a positive association between these variables. As much advertising expense will increase the total sales will also increase. If we want to know the total annual sales if the SVL spend £ 300 in monthly advertising expenditure then we have the total annual sales: Regression Analysis: Total sales versus Experience The regression equation is y = 591 + 17.2 x Predictor Coef StDev T P Constant 590.57 23.05 25.62 0.000 x 17.185 2.284 7.52 0.000 S = 78.20 R-Sq = 35.5% R-Sq(adj) = 34.8% Y = a + b X Y-intercept = 591 Slope = 17.2 Total Sales = 591 + (17.2) Managers’ Experience The estimated regression coefficient b = 17.2 indicates that the values of Y change by (17.2) units for a unit increase in X. Regression Analysis: Total sales versus Distance (miles) The regression equation is y = 941 - 84.3 x Predictor Coef StDev T P Constant 940.81 15.61 60.28 0.000 x -84.260 6.531 -12.90 0.000 S = 60.18 R-Sq = 61.8% R-Sq(adj) = 61.4% Y = a + b X Y-intercept = 941 Slope = -84.26 Total Sales = 941 + (-84.26) Distance from high street The estimated regression coefficient b = -84.26 indicates that the values of Y change by (-84.26) units for a unit increase in X. The correlation between Total sales and distance from the high street is -0.786 that shows a negative association between these variables. It means the sales in SVL outlets that are near to high streets is more than in those outlets that are far from the high street. Conclusion The following results were obtained after the analysis: 1. Highest numbers of SVL outlets are in South. 2. Most of the managers in SVL outlets are females. 3. The highest annual sales are of 19” flat screen of computers. 4. Nearest outlets from high street and annual expenditure on advertising both are beneficial for the significant raise in the annual sales of SVL flat screens. Task 2 Apple used 13 million pounds of e-waste in the year 2006 that is equal to 9.5 percent of the weight of all goods Apple sold seven years past. Apple expects that this percentage to grow to 13percent in year 2007, and to 20 percent in 2008. By 2010, it is to be forecasted that Apple will recycle 19 million pounds of e-waste per year; here is the graph of current and forecasted present below. Weight Recycled as % of Past Sales The graph shows that the there is a continuous improvement from the year 2002 to 2007 and it is predicted that it will be grow further in coming years. Read More
Cite this document
  • APA
  • MLA
  • CHICAGO
(Slender Vision Ltd Activity Analysis Case Study, n.d.)
Slender Vision Ltd Activity Analysis Case Study. https://studentshare.org/marketing/1710405-essential-data-analysis
(Slender Vision Ltd Activity Analysis Case Study)
Slender Vision Ltd Activity Analysis Case Study. https://studentshare.org/marketing/1710405-essential-data-analysis.
“Slender Vision Ltd Activity Analysis Case Study”. https://studentshare.org/marketing/1710405-essential-data-analysis.
  • Cited: 0 times

CHECK THESE SAMPLES OF Slender Vision Ltd Activity Analysis

American and European Central Banks

analysis of American and European Central Banks Introduction: To answer this issue properly there is a requirement for a country-specific measure as well as data to be obtained from the central bank.... Many economists have developed measures of CBI from various legal indicators, some of which are conferred in this essay....
9 Pages (2250 words) Essay

Analysis of Business Groups in China

An analysis of Business Groups in China: Should China Be Adopting Them?... hellip; An analysis of Business Groups in China: Should China Be Adopting Them?... An analysis of business groups in China Introduction Business groups are found virtually everywhere in Asian nations....
10 Pages (2500 words) Essay

Modelling Human Activity Systems

This report corresponds to some problems in the problem situation given in the analysis of QES P/L and the case study provided.... In order to resolve these problems the report has provided a human activity system (HAS) and an information system serving it (IS) to solve the problems that are caused by the cultural differences among different units of QES P/L.... The suggested solution to this problem is the cultural adaptation human activity system and the information system that serves it which is expected to resolve the problems initiated by cultural differences....
6 Pages (1500 words) Essay

Florence Nightingale as one of the most powerful and influential women in history

In the western industrial societies, there came a vast expansion of feminist activity, which empowered women and helped them to shape the future generations of women.... This movement was behind transforming the ignorance of society and educating all people about gender differences and how these differences should be provided for in a social perspective....
5 Pages (1250 words) Essay

Democracy in West Germany and Mexico

A democratic society is one that is free of restricting choices by the government or any institution that may limit idea generation.... hellip; It is a country that is governed by the people and power is delegated from the authority figure to the grass root level.... In another definition, democracy can be used to define the power of the people to elect the government representative that is capable of enacting just judgment without prejudice and hate freely....
7 Pages (1750 words) Essay

Corporate Social Responsibility in Australian Mining Industries

hellip; Customers, employees, business partners and importantly societies have a vital role in the success of a company's CSR activity.... This paper discusses various criticisms and discusses those criticisms pointed out by the people of Australia with their justification.... The paper analyzes global standards of corporate social responsibility which has been set a guideline for mining industries to prevent environmental destruction....
8 Pages (2000 words) Term Paper

Golden Agri-Resources Ltd

This case study "Golden Agri-Resources ltd" analyzes Golden Agri-Resources ltd company, its strengths and weaknesses, financial performance and gives recommendations.... hellip; Golden Agri-Resources ltd (GAR) ranks second among the world's oil palm plantations.... GAR has its operations in China, with refinery facilities located in the provinces of Zhuhai and Ningbo (Golden Agri-Resources ltd-a, n.... Besides this the company also produces refined products like margarine, shortening, cooking oil, butter oil substitute, fats for restaurants, cafes, hotels and industrial markets (Golden Agri-Resources ltd-b, n....
8 Pages (2000 words) Case Study

Sidney Waters Customer Information Billing System

  In the essay “Sidney Water's Customer Information Billing System” the author discusses the culture of the company.... Very large and complex projects were expected to be fraught with delays and changes, rescheduling of completions times and budgets overruns, and based on what happens from the start....
8 Pages (2000 words) Case Study
sponsored ads
We use cookies to create the best experience for you. Keep on browsing if you are OK with that, or find out how to manage cookies.
Contact Us