StudentShare
Contact Us
Sign In / Sign Up for FREE
Search
Go to advanced search...
Free

A Research and Analysis of Returns on the Viability For the Hobbits Choice Restaurant - Assignment Example

Cite this document
Summary
A research and analysis study was done on a sample of 400 potentially loyal patrons to determine how the Hobbit’s Choice Restaurant would fare with the local population. The following answered questions are the analyzed responses to the survey (31 questions) provided with the database. …
Download full paper File format: .doc, available for editing
GRAB THE BEST PAPER92% of users find it useful
A Research and Analysis of Returns on the Viability For the Hobbits Choice Restaurant
Read Text Preview

Extract of sample "A Research and Analysis of Returns on the Viability For the Hobbits Choice Restaurant"

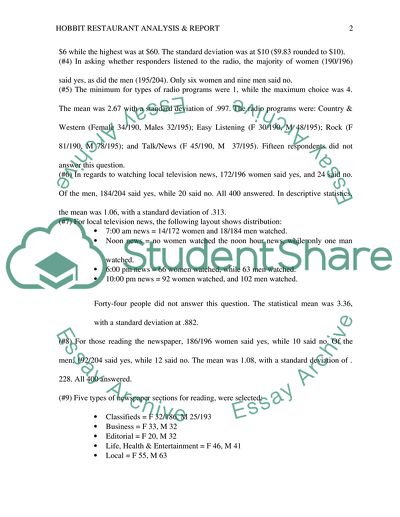
A Research and Analysis of Returns on the Viability For the Hobbit’s Choice Restaurant A research and analysis study was done on a sample of 400 potentially loyal patrons to determine how the Hobbit’s Choice Restaurant would fare with the local population. The following answered questions are the analyzed responses to the survey (31 questions) provided with the database. In the first answer, the questions in Descriptive Statistics output, are in different order than the listing in the SPSS Variable View Tab. Please refer to Appendix A for the questions and responses given in the first question. Both SPSS and Excel’s Pivot tool were used to gain answers. Q.1 Each survey response is analyzed for its particulars, using the Gender variable.. (#1) The least amount of money spent on meals was $5, while $450 was the highest amount, with $151 as the mean (middle) point overall. Standard deviation was $92.71. In this population, there were 196 females and 204 males, overall. Women, who made $100,000 or more, had an overall count of 52/196 (ages 45 to 59), while men, who made $100,000 or more, were between the ages of 49 to 61, at a count of 57/204. (#2) Of those who were Very Likely or Somewhat Likely, the count for women was 51, while men were 59 (total 110). For those who were Neither Likely Nor Unlikely, the count for women was 83, and 78 for men (total 161). For those who were Somewhat Unlikely or Very Unlikely, the count for women was 62, and 67 for men (total 129). The highest counted group was 161, who did not seem to care one way or another. In SPSS, the descriptive shows 1 as the lowest selection and 5 as the highest, with 3 as the mean (neutral or uncaring). The standard deviation was 1.237, showing the slight changes across the groups. (#3) The average price expected by the responder for an entrée was $19. The lowest was at $6 while the highest was at $60. The standard deviation was at $10 ($9.83 rounded to $10). (#4) In asking whether responders listened to the radio, the majority of women (190/196) said yes, as did the men (195/204). Only six women and nine men said no. (#5) The minimum for types of radio programs were 1, while the maximum choice was 4. The mean was 2.67 with a standard deviation of .997. The radio programs were: Country & Western (Female 34/190, Males 32/195); Easy Listening (F 30/190, M 48/195); Rock (F 81/190, M 78/195); and Talk/News (F 45/190, M 37/195). Fifteen respondents did not answer this question. (#6) In regards to watching local television news, 172/196 women said yes, and 24 said no. Of the men, 184/204 said yes, while 20 said no. All 400 answered. In descriptive statistics, the mean was 1.06, with a standard deviation of .313. (#7) For local television news, the following layout shows distribution: 7:00 am news = 14/172 women and 18/184 men watched. Noon news = no women watched the noon hour news, while only one man watched. 6:00 pm news = 66 women watched, while 63 men watched. 10:00 pm news = 92 women watched, and 102 men watched. Forty-four people did not answer this question. The statistical mean was 3.36, with a standard deviation at .882. (#8) For those reading the newspaper, 186/196 women said yes, while 10 said no. Of the men, 192/204 said yes, while 12 said no. The mean was 1.08, with a standard deviation of .228. All 400 answered. (#9) Five types of newspaper sections for reading, were selected: Classifieds = F 32/186, M 25/193 Business = F 33, M 32 Editorial = F 20, M 32 Life, Health & Entertainment = F 46, M 41 Local = F 55, M 63 The mean was 3.16, with a standard deviation (SD) of 1.329 over those who responded, at 379 total. In rankings, Local news was #1, LH&E was #2, Business was #3, and Classifieds was #4, with Editorial as #5. (#10) For those who subscribed to City Magazine, the mean was 1.55, with SD at .498. By gender, this was reflected as F 80/196, yes, and M 101/204, yes. Those who said no were F 116/196 and M 103/204. More men subscribed and read City Magazine, but the spread was almost half and half. (#11) Those who would prefer a Waterfront View at the restaurant, had five choices, and the mean was 3.42, with a SD at 1.333. F = 114 who either Very Strongly Prefer (51) or Somewhat Prefer (63). M = 123 who either Very Strongly Prefer (45) or Somewhat Prefer (78). For those who were neutral (Neither Prefer Nor Not Prefer), F = 24 and M = 19, for a total of 43. Very Strongly Not Prefer were F = 18/58, M = 27/62, and Somewhat Not Prefer, F = 40/58 and M = 35/62. (#12) Those who answered whether they would prefer to drive less than 30 minutes to get to the restaurant, F = Very Strongly Prefer (27/196) or Somewhat Prefer (30/196); Neutral (31/196); Somewhat Not Prefer (83/196) or Very Strongly Not Prefer (25/196). M = Very Strongly Prefer (29/204) or Somewhat Prefer (33/204); Neutral (37/204); Somewhat Not Prefer (58/204) or Very Strongly Not Prefer (47/204). Essentially, those who preferred were 119; Neutral was 68; and did not prefer were 213, overall. The majority did not prefer to drive less than 30 minutes, meaning that they would drive long enough to get to a good restaurant. The statistical mean was 2.72, with SD at 1.311. (#13) The statistical mean was 2.47, with SD at 1.516 when asked if respondents preferred waitstaff to wear formal tuxedos. Choice F M All Somewhat Prefer 24 21 45 Very Strongly Prefer 34 41 75 Neither Prefer Nor Not Prefer 4 6 10 Somewhat Not Prefer 84 47 131 Very Strongly Not Prefer 50 89 139 Total 196 204 400 (#14) The mean was 2.41, with SD at 1.514 for those who were asked if they wanted unusual desserts. The majority of respondents really not want unusual desserts. Choice F M All Somewhat Prefer 31 24 55 Very Strongly Prefer 27 38 65 Neither Prefer Nor Not Prefer 8 9 17 Somewhat Not Prefer 54 50 104 Very Strongly Not Prefer 76 83 159 Total 196 204 400 (#15) For those who prefer a large variety of entrees, the mean was 2.47, with SD at 1.466. The majority did not want too many varieties in entrees. Choice F M All Somewhat Prefer 30 33 63 Very Strongly Prefer 28 29 67 Neither Prefer Nor Not Prefer 19 19 38 Somewhat Not Prefer 53 44 97 Very Strongly Not Prefer 66 79 145 Total 196 204 400 (#16) For those who might prefer unusual entrees, the mean was 2.40, with SD at 1.550. The majority did not prefer unusual entrees, particularly women. Choice F M All Somewhat Prefer 24 26 50 Very Strongly Prefer 34 36 70 Neither Prefer Nor Not Prefer 3 20 23 Somewhat Not Prefer 43 43 86 Very Strongly Not Prefer 92 79 171 Total 196 204 400 (#17) When asked if respondents preferred simple décor, the mean was 3.57, with SD at 1.492. Most respondents preferred a simple décor at the restaurant and this was split evenly between men and women. Choice F M All Somewhat Prefer 60 60 120 Very Strongly Prefer 72 75 147 Neither Prefer Nor Not Prefer 6 7 13 Somewhat Not Prefer 29 27 56 Very Strongly Not Prefer 29 35 64 Total 196 204 400 (#18) When asked if there was a preference for elegant décor, the mean was 2.33, with SD at 1.510. This matches the question about the preference to simple décor above, although there is a slight variation in the spread. Choice F M All Somewhat Prefer 28 35 63 Very Strongly Prefer 30 27 57 Neither Prefer Nor Not Prefer 6 5 11 Somewhat Not Prefer 48 44 92 Very Strongly Not Prefer 84 93 177 Total 196 204 400 (#19) Respondents were asked if they preferred a string quartet, with a mean at 2.50 and SD at 1.420. The majority did not prefer a string quartet, split evenly between men and women. Choice F M All Somewhat Prefer 32 37 69 Very Strongly Prefer 26 25 51 Neither Prefer Nor Not Prefer 21 19 40 Somewhat Not Prefer 52 58 110 Very Strongly Not Prefer 65 65 130 Total 196 204 400 (#20) If not the string quartet, perhaps the jazz combo? Mean was 3.70, with SD at 1.221. Choice F M All Somewhat Prefer 60 58 118 Very Strongly Prefer 63 67 130 Neither Prefer Nor Not Prefer 33 44 77 Somewhat Not Prefer 23 27 50 Very Strongly Not Prefer 17 8 25 Total 196 204 400 (#21) For the year born, the oldest person was born in 1928, while the youngest person was born in 1975. The mean year of birth was 1957.45, and SD was 9.516. (22) For the question on the highest level of education attained, there were eight choices. (Mean 5.77 and SD 1.413; N= 400; Bachelor’s degree was the highest at 238.) Choice F M All Less than High School 4 7 11 Some High School 12 2 14 HS Graduate 4 10 14 Some college – no degree 7 7 14 Associate 8 7 15 Bachelor’s degree 113 125 238 Master’s degree 46 40 80 Doctorate degree 2 7 9 Total 196 204 400 (23) Marital Status: Mean was 1.86, with SD at .547. The majority were married (272). Choice F M All Single 40 53 93 Married 137 135 272 Other (divorced, widow, etc.) 19 16 35 Total 196 204 400 (24) Family size had seven choices; the mean was 2.67, with SD at 1.379. Choice F M All 1 47 52 99 2 43 58 101 3 50 38 88 4 38 36 74 5 16 10 26 6 2 7 9 7 - 3 3 Total 196 204 400 (25) The Zip Code by location. Mean 2.70, with SD at .715. The majority live in the C zip code area. Choice F M All A (1, 2) 11 9 20 B (3, 4, 5) 58 62 120 C (6, 7, 8, 9) 108 112 220 D (10, 11, 12) 19 21 40 Total 196 204 400 (26) Annual income before taxes; Mean = 4.18, SD = 1.749. The majority made $50,000 to $74,999, with $25,000 to $49,999 in second place. Choice F M All Rank < $15,000 10 16 26 7 $15,000 to $24,999 20 14 34 5 $25,000 to $49,999 47 35 85 2 $50,000 to $74,999 59 74 133 1 $75,000 to $99,999 8 8 16 6 $100,000 to $149,999 23 20 43 4 $500,000+ 29 37 66 3 Total 196 204 400 (27) Gender has been shown to be 196 women and 204 men. Mean = 1.49, SD = .501. (28) Probable patrons for the Hobbit’s Choice is: F = 51, M = 59 (Total = 110). Mean = 1.73, SD = .447. (29) Recoded income was shown as the lowest at $7,500, with the highest at $175,000. The mean was $76,470, SD = 53.13583. (30) The lowest age was at 28, while the highest was 75. The mean age was 45.5375, SD = 9.51577. (31) Probable Patron (recoded) count = F = 51, M = 59 (Total = 110). Mean = .2750, SD.44707. ********* Q.2. What are the population estimates for each of the following? a. Preference for easy listening radio programming = 78/385 said yes. b. Viewing of 10 P.M. local news on TV = 356/400 said yes. c. Average age of heads of household = 45.5375 was the average age. d. Average price paid for an evening meal entré = $18.84 was the average price paid. Q.3. Because Jeff Dean’s restaurant will be upscale, it will appeal to high-income consumers. Jeff hopes that at least 30 percent of the households have an income level of $100,000 or higher. Test this hypothesis. In coding returns parameters, code 6 = $100,000 to $149,999 (11%), while code 7 = $150,000+ (17%). Therefore, both returns with codes 6 and 7 combined, equaled 28%, which meant that Jeff’s goal was not quite attainable. However, 4% of patrons make $88,000 annually, so Jeff could lower his goal projection to attain 32% of his population as making $88,000+, a reasonable alternative goal. Q.4. Most responders prefer a simple décor (267 – see #17 in Q1), and also did not want a wait staff to wear tuxedos (270 – see #13 in Q.1). However, the majority did prefer the jazz combo for a musical background (248 - see #20 in Q.1). Q.5. What this response showed, as to whether women would prefer the Hobbit Choice Restaurant more than men, 59 men were very likely or somewhat likely to prefer the restaurant more than women (51) but only by a small amount, 8. The neutral amount could be added on if women were undecided or did not have an opinion. Overall, F = 134 while M = 137 (See green shade below). The mean was 3, while standard deviation was 1.237 (See #2 in Q.1). Response F M All Very Likely or Somewhat Likely 51 59 110 Neutral 83 78 161 Somewhat Unlikely or Very Unlikely 62 67 129 Total (See #2 in Q.1) 196 204 400 Q. 6. When determining whether the waterfront view for the restaurant is more preferable than a drive of 30 minutes or less, the following was determined by gender, based on the response of “Very Strongly Preferred” in both questions. Choice F M All Waterfront 51 45 96 Drive 27 29 56 Total 78/196 74/204 152/400 Q.7. In determining whether higher-income households would be more attracted to the Hobbit’s Choice than lower income households, the following was determined: Those who made $87,000 or more, would be most likely to prefer the Hobbit’s Choice Restaurant. Q.8. Middle-aged people (45 to 61) preferred unusual desserts, while younger people were definitely against trying them. The same was also true in the age group, 49 to 75, although the counts were predominate in the 50s, when preferring unusual entrees. Q.9. When determining the most likely patron by age and gender first, F = 51, with M = 59. Largest Age group is highlighted in green. The majority of the yes group preferred Easy Listening (58/110), with Talk News next (39/110). The majority lived in the B zip code (105/110). HC Patrons Female Male Totals Totals (yes) 51 59 110 37   1 1 38 1   1 42   3 3 45 1   1 48 1   1 49 1 1 2 50 8 3 11 51 4 4 8 52 3 10 13 53 6 4 10 54 5 5 10 55 8 5 13 56 8 6 14 57 3 7 10 58 1 5 6 59 1 1 2 60   3 3 61   1 1 Grand Total 51 59 110 $10,000 Salary F M Count $63 1 3 4 $88 6 4 10 $125 23 17 40 $175 21 35 56 Grand Total 51 59 110 EDU Level F M Total Associate Degree 2 1 3 Bachelors Degree 33 33 66 Masters Degree 14 20 34 Doctorate Degree 2 5 7 Grand Total 51 59 110 Zip Code F M Total B (3, 4, & 5) 50 55 105 C (6, 7, 8, & 9) 1 4 5 Grand Total 51 59 110 Q.10. In regression analysis, the following features of unusual entrees, variety of entrees, variety of desserts, water, drive, simple décor, and formal attire waitpersons, were determined as potentially likely indicators for potential customers to patronize the Hobbit’s Choice Restaurant. ANOVAa,b Model Sum of Squares df Mean Square F Sig. 1 Regression 36745.554 7 5249.365 5.953 .000c Residual 89936.264 102 881.728 Total 126681.818 109 a. Dependent Variable: Recoded income to $1,000s using midpoints of questionnaire ranges b. Selecting only cases for which Probable Patron of Hobbits Choice? = Yes c. Predictors: (Constant), Prefer Simple Decor, Prefer Drive Less than 30 Minutes, Prefer Large Variety of Entrees, Prefer Waterfront View, Prefer Formal Waitstaff Wearing Tuxedos, Prefer Unusual Entrees, Prefer Unusual Desserts Coefficientsa,b Model Unstandardized Coefficients Standardized Coefficients t Sig. B Std. Error Beta 1 (Constant) 173.342 50.669 3.421 .001 Prefer Waterfront View -7.656 5.785 -.162 -1.323 .189 Prefer Drive Less than 30 Minutes -.806 5.642 -.015 -.143 .887 Prefer Formal Waitstaff Wearing Tuxedos 13.811 5.396 .328 2.559 .012 Prefer Unusual Desserts -8.857 6.558 -.206 -1.351 .180 Prefer Large Variety of Entrees 1.699 5.530 .041 .307 .759 Prefer Unusual Entrees -4.111 5.719 -.092 -.719 .474 Prefer Simple Decor -14.631 5.968 -.369 -2.451 .016 a. Dependent Variable: Recoded income to $1,000s using midpoints of questionnaire ranges b. Selecting only cases for which Probable Patron of Hobbits Choice? = Yes Probable patrons do not want or need to have a waterfront view at their restaurant. Probable patrons for Hobbit’s Choice tend to prefer driving 30 minutes or less to get to their restaurant. As to waitstaff in formal attire, do prefer (majority) to have their waitstaff professionally dressed. Probable patrons do prefer in the majority to have unusual desserts. Probable patrons do prefer to have a variety of entrees on their menu to choose from Probable Patrons also like (majority) to have unusual entre offerings as well. Probable Patrons also like to have a more fancy décor, rather than a simple one, which the rest of the respondents preferred. Source: The Hobbit’s Choice Restaurant Survey and Response Database. (2014). Appendices Appendix A: Descriptive Statistics (SPSS) Descriptive Statistics N Minimum Maximum Mean Std. Deviation 1 How many total dollars do you spend per month in restaurants (for your meals only)? 400 $5.00 $450.00 $150.0525 $92.70629 2 How likely would it be for you to patronize this restaurant (new upscale restaurant)? 400 1 5 3.00 1.237 3 What would you expect an average evening meal entree item alone to be priced? 340 $6.00 $60.00 $18.8353 $9.82784 4 Would you describe yourself as one who listens to the radio? 400 1 2 1.04 .190 5 To which type of radio programming do you most often listen? 385 1 4 2.67 .997 6 Would you describe yourself as a viewer of TV local news? 400 1 2 1.11 .313 7 Which newscast do you watch most frequently? 356 1 4 3.36 .882 8 Do you read the newspaper? 400 1 2 1.06 .228 9 Which section of the local newspaper would you say you read most frequently? 379 1 5 3.16 1.329 10 Do you subscribe to City Magazine? 400 1 2 1.55 .498 11 Prefer Waterfront View 400 1 5 3.42 1.333 12 Prefer Drive Less than 30 Minutes 400 1 5 2.72 1.311 13 Prefer Formal Waitstaff Wearing Tuxedos 400 1 5 2.47 1.516 14 Prefer Unusual Desserts 400 1 5 2.41 1.514 15 Prefer Large Variety of Entrees 400 1 5 2.47 1.466 16 Prefer Unusual Entrees 400 1 5 2.40 1.550 17 Prefer Simple Decor 400 1 5 3.57 1.492 18 Prefer Elegant Decor 400 1 5 2.33 1.510 19 Prefer String Quartet 400 1 5 2.50 1.420 20 Prefer Jazz Combo 400 1 5 3.70 1.221 21 Year Born 400 1928 1975 1957.46 9.516 22 What is your highest level of education? 400 1 8 5.77 1.413 23 What is your marital status? 400 1 3 1.86 .547 24 Including children under 18 living with you, what is your family size? 400 1 7 2.67 1.379 25 Please check the letter that includes the Zip Code in which you live (coded by letter). 400 1 4 2.70 .715 26 Which of the following categories best describes your before tax household income? 400 1 7 4.18 1.749 27 What is your gender? 400 1 2 1.49 .501 28 Probable Patron of Hobbits Choice? 400 1 2 1.73 .447 29 Recoded income to $1,000s using midpoints of questionnaire ranges 400 7.50 175.00 76.4688 53.13583 30 age 400 28.00 75.00 45.5375 9.51577 31 1 if Prob Patron 400 .00 1.00 .2750 .44707 Valid N (listwise) 312 Appendix B Survey Questions Survey Questions 1. Do you eat at this type of restaurant at least once every two weeks? 2. How many total dollars do you spend per month in restaurants (for your meals only)? 3. How likely would it be for you to patronize this restaurant (new upscale restaurant)? 4. What would you expect an average evening meal entree item alone to be priced? 5. Including children under 18 living with you, what is your family size? 6. To which type of radio programming do you most often listen? 7. Would you describe yourself as a viewer of TV local news? 8. Which newscast do you watch most frequently? 9. Do you read the newspaper? 10. Which section of the local newspaper would you say you read most frequently? 11. Do you subscribe to City Magazine? 12. Prefer Waterfront View 13. Prefer Drive Less than 30 Minutes 14. Prefer Formal Waitstaff Wearing Tuxedos 15. Prefer Unusual Desserts 16. Prefer Large Variety of Entrees 17. Prefer Unusual Entrees 18. Prefer Simple Decor 19. Prefer Elegant Decor 20. Prefer String Quartet 21. Prefer Jazz Combo 22. Year Born 23. What is your highest level of education? 24. What is your marital status? 25. Including children under 18 living with you, what is your family size? 26. Please check the letter that includes the Zip Code in which you live (coded by letter). 27. Which of the following categories best describes your before tax household income? 28. What is your gender? 29. Probable Patron of Hobbits Choice? 30. Recoded income to $1,000s using midpoints of questionnaire ranges 31. State age 1 if Prob Patron (code response provides new right-hand column in SPSS (not survey Q) Read More
Cite this document
  • APA
  • MLA
  • CHICAGO
(“A Research and Analysis of Returns on the Viability For the Hobbits Assignment”, n.d.)
Retrieved from https://studentshare.org/marketing/1667566-a-research-and-analysis-of-returns-on-the-viability-for-the-hobbits-choice-restaurant
(A Research and Analysis of Returns on the Viability For the Hobbits Assignment)
https://studentshare.org/marketing/1667566-a-research-and-analysis-of-returns-on-the-viability-for-the-hobbits-choice-restaurant.
“A Research and Analysis of Returns on the Viability For the Hobbits Assignment”, n.d. https://studentshare.org/marketing/1667566-a-research-and-analysis-of-returns-on-the-viability-for-the-hobbits-choice-restaurant.
  • Cited: 0 times

CHECK THESE SAMPLES OF A Research and Analysis of Returns on the Viability For the Hobbits Choice Restaurant

Castle's Family Restaurant in the Hospitality Sector

With the focus on a small group – Castle's Family restaurant – it has been found that strategic HRIS can help an organization to enhance performance, reduce costs and retain staff for enhanced service delivery.... Introduction Castle's Family restaurant, a small group with under 350 workers has eight units which require the HR manager to travel frequently to each of the units to interact with the workers.... Stage I Business Assessment Family restaurant, a part of the hospitality sector, is a high potential, high-competition sector....
12 Pages (3000 words) Research Paper

Conway Inn & Restaurant

Conway Inn & restaurant: A Project Outline Anand A.... et MGMT-591 Professor Richard Swersey July 16th, 2013 Conway Inn & restaurant: A Project Outline Overview of the Organization The organization that will be covered in my final project paper is Conway Inn & restaurant.... However, Conway Inn & restaurant began to suffer a downturn in the customer flow in 2010, and this decline has been a major area of concern ever since.... With the decrease in the customer flow, Conway Inn & restaurant has been forced to cut back on its discounted cab service as discussed....
7 Pages (1750 words) Research Paper

Subway Restaurants in Middle East

For instance, Subway restaurant has a lot of competitors in the Middle East.... However, it is an obvious assumption that international restaurant ventures in the Middle East have a great consumer attention level which creates a fair level of competition in the international organizations in the venture.... Many organizations in the Middle East offer the same services with an aim of acquiring the same profit returns as the Subway restaurant.... Top restaurant ventures across the globe such as McDonalds, Dorman's, Costa Coffee and the local organizations create a large variety of substitutes in the market....
4 Pages (1000 words) Research Paper

Restaurant Industry

orporate Growth StrategiesThe business strategy is focused on a prudent allocation of capital intended to enhance overall earnings per share growth and increase returns on invested capital.... restaurant industry in the United States projected sales of $558 billion in 2008 with the industry employing 13.... million individuals in 945,000 restaurant-and-foodservice outlets.... million by 2018. According to the National restaurant Association's 2008 restaurant Industry Forecast, the industry is expected to advance 4....
7 Pages (1750 words) Research Paper

Social Media Marketing for KOPI Restaurants

KOPI is a restaurant in the New York City's Washington Square that is designed to offer exclusively Indonesian foods to Americans and Indonesians in this region among other customers.... The restaurant has been established in a place that is surrounded by several universities… In this regard, it is clear that in its establishment, the target group in focus were these students, most of whom are young people aged between 18 and 26 years old as well as many other young professionals residing in this region....
8 Pages (2000 words) Research Paper

Opening up Kazakh restaurant in Oxford

hellip; A Kazakh restaurant in Oxford might at first glance seem too long a shot that can possibly be a commercially viable venture, but a closer analysis of all the parameters and variables that can influence the outcome leads the analyst to form a different opinion....  This paper tries to analyze the important factors and their impact in determining the success or otherwise of a proposed Kazakh restaurant that is to be opened at Oxford.... The basic idea is to keep revenue expenditure to the minimum till the restaurant expands to a size where outside labor becomes imperative and the cash inflows also reach a level where such revenue expenses can be met without much difficulty....
11 Pages (2750 words) Research Paper

The Canton Village Restaurant

In the paper “The Canton Village restaurant” the author analyzes the Canton Village restaurant, which has been a staple of Southern California's Chinese community for more than 30 years.... Established in the 1970s, the Canton Village restaurant is located on the ground floor of a former hotel.... hellip; The author states that the Canton Village restaurant now boasts two rooms which are used for dining as well as for private parties....
9 Pages (2250 words) Research Paper

Type of Business Structure

hellip; Some research has proven that organic food is not necessarily healthier than standard food.... From the paper "Type of Business Structure" it is clear that technological factors are very important for capital intensive business and in these days for every kind of business in organic farming the emphasis is on the food is as natural as possible....
7 Pages (1750 words) Research Paper
sponsored ads
We use cookies to create the best experience for you. Keep on browsing if you are OK with that, or find out how to manage cookies.
Contact Us