StudentShare
Contact Us
Sign In / Sign Up for FREE
Search
Go to advanced search...
Free

Growth and Strategy of Vodafone Company - Essay Example

Cite this document
Summary
This essay "Growth and Strategy of Vodafone Company" assesses the financial health of Vodafone Group PLC, by evaluating its financial performance, its market position, and its future strategy. It would recommend whether to make an investment of £1Million in the stocks of Vodafone…
Download full paper File format: .doc, available for editing
GRAB THE BEST PAPER93.2% of users find it useful
Growth and Strategy of Vodafone Company
Read Text Preview

Extract of sample "Growth and Strategy of Vodafone Company"

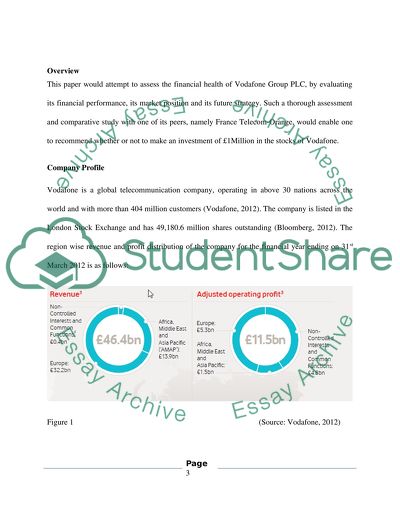
?Analyst Management Summary Report of Vodafone UK Table of Contents Overview 3 Company Profile 3 Financial Summary 4 Financial Ratio Analysis 5 Company Growth and Strategy 7 Market Competition 8 Risks 11 Recommendation 11 References 13 Appendices 15 1.Income Statement 15 2.Balance Sheet 17 3.Financial Ratios 20 Overview This paper would attempt to assess the financial health of Vodafone Group PLC, by evaluating its financial performance, its market position and its future strategy. Such a thorough assessment and comparative study with one of its peers, namely France Telecom-Orange, would enable one to recommend whether or not to make an investment of ?1Million in the stocks of Vodafone. Company Profile Vodafone is a global telecommunication company, operating in above 30 nations across the world and with more than 404 million customers (Vodafone, 2012). The company is listed in the London Stock Exchange and has 49,180.6 million shares outstanding (Bloomberg, 2012). The region wise revenue and profit distribution of the company for the financial year ending on 31st March 2012 is as follows: Figure 1 (Source: Vodafone, 2012) Financial Summary The following table presents the financial details of Vodafone Group during the past two financial years: Millions of British Pounds March 31, 2012 March 31, 2011 Income Statement Total Revenue 46,417 45,884 Gross Profit 14,871 15,070 Operating Profit 6,559 6,687 Profit before Tax 9,549 9,498 Net Profit 6,957 7,968 EPS 14.91p 16.75p Balance Sheet Current Assets 20,025 17,003 Total Assets 139,576 151,220 Current Liabilities 24,025 27,075 Total Liabilities 61,374 63,659 Total Equity 78,202 87,561 Cash Flow Cash From Operations 12,755 11,995 Cash From Investing 3,843 -1,882 Cash From Financing -15,369 -8,259 Change in Net Cash 883 1,842 Table 1 (Source: London Stock Exchange, 2012; Bloomberg Businessweek, 2012) It should be noted that the difference between Vodafone’s operating profit and its profit before tax is owing to the high value of its ‘income on equity investments’. The following figure represents the share price movements of Vodafone from April 2011 to May 2012, against that of the FTSE: Figure 2 (Source: Vodafone, 2012) It can be observed that Vodafone had performed relatively better than the FTSE stock in terms of share price movements. Additionally, the company had been continuously giving out dividends to its shareholders since the last four years. Financial Ratio Analysis The liquidity position of an organization can be evaluated with the assistance of its current ratio and quick ratio. These ratios establish the organization’s capacity to meet its short-term liabilities. The current ratio can be determined as the ratio of the current assets to the current liabilities of the company, while the quick ratio is computed by dividing the quick assets by the current liabilities. It should be noted that the quick asset of an organization cosist of its cash, receivables and short term marketable investments (Brigham & Ehrhardt, 2010). The liquidity ratios of Vodafone are as follows: Year Mar-11 Mar-12 Current Ratio 0.63 0.83 Quick Ratio 0.61 0.81 The analysis of a company’s capability to generate cost-effective sales by means of its resources can be assessed by means of its profitability ratios. These ratios include the gross profit margin, the net profit margin as well as the returns on equity and assets of the company. The gross profit margin of a firm is the ratio of its gross profit to revenue, while net profit margin is the ratio of net profit to revenue. Then again, the return on equity (ROE) of a company is the value of net income as a percentage of total shareholders’ equity while the return on asset is the value of net income as a percentage of its total assets (Brigham & Ehrhardt, 2010). The profitability ratios of Vodafone are as follows: Year Mar-11 Mar-12 Gross Profit Margin 32.84% 32.04% Net Profit Margin 17.37% 14.99% Return on Equity 9.10% 9.04% Return on Asset 5.27% 4.98% The solvency position of a company can be determined by means of its long-term debt ratios, such as the debt to equity, debt to capital, and the interest coverage ratios. These ratios assess the ability of the firm to meet its long-term commitments. The debt to equity ratio of a firm is computed by dividing its total debt by its total shareholders’ equity, while its debt to capital ratio is derived by dividing its total debt by the sum of its shareholders’ equity and its total debt. The interest coverage of a company is calculated as the ratio of its earnings before interest and tax (EBIT) and its interest payables (Brigham & Ehrhardt, 2010). Year Mar-11 Mar-12 Debt to Equity 0.32 0.37 Debt to Asset 0.19 0.20 Debt to Capital 0.24 0.27 Interest Coverage ratio 5.46 3.99 Company Growth and Strategy Vodafone is one of the foremost mobile operators in terms of revenue market share. The company has been highly cash generative over the past years and has continuously returned their market capitalization to the stockholders by means of dividends as well as share buybacks (Vodafone, 2012). The table below illustrates the growth of the company, Table 2 (Source: Reuters, 2012) The high growth performance of Vodafone had been possible owing to three of its main strengths. First, the company enjoys the advantage of its worldwide reach and its focus to cost efficiency. Second, the appliance of thorough capital discipline in terms of investment decisions. And, finally, the successful generation of satisfactory cash flow from Vodafone’s non-controlled interests (Vodafone, 2012). The strategy employed by Vodafone to strengthen its future market position is based on the following growth drivers, namely, ‘data services, new services, enterprise and total communications, and, emerging markets’. Vodafone intends to emphasize on the rising demand for mobile internet and associated services for its business growth. The company also perceives that it would come across enormous growth in its new services segment as well as its enterprise segment and hence considers these two segments as its growth drivers. Additionally, Vodafone’s business in India and Africa are expanding enormously and it is expected to do better in the coming years (Vodafone, 2012). Market Competition The figure below illustrates the top ten companies in the telecommunications sector across the world in context of their share market capitalization. Figure 3: Position of Telecom Companies in terms of Stock market Capitalization (Source: Telefonica, 2010). And the end of the year 2010, Vodafone (100.14 billion Euros) held the third position where as France Telecom-Orange (42.11 billion Euros) held the tenth position in terms of market capitalization in the telecom sector (Telefonica, 2010). At the end of March 2012, the annual revenue of Vodafone was 46,417 million pounds, while during the same period, Orange earned revenue worth 45.27 billion Euros (Orange, 2011). While, Vodafone had more than 404 million customers as of March 2012, France Telecom-Orange had 226.3 million customers during the financial year 2011 (Euro Investor, 2011). The following graph illustrates the share price movements of France Telecom-Orange over the last one year (December 2011 to November 2012). It can be observed from the above graph that share price of France Telecom-Orange had considerably declined during the past one year. The shares of the company were trading at 12.46 Euro on November 10, 2011, whereas on November 9, 2012, the shares of France Telecom-Orange were quoted at 8.30 Euro, which is a decrease of approximately around 33% (Yahoo Finance (a), 2012). Figure 4: Share Price movements of France Telecom-Orange (Source: Yahoo Finance (a), 2012) Similarly, the subsequent graph (Fig 5) illustrates the share price movements of Vodafone Group over the last one year (December 2011 to November 2012). The graph reveals that the stock prices of Vodafone followed an unstable trend from 177.85 GBP on November 10, 2011 to 167.6 GBP as on November 9, 2012. This decline in the share prices was equivalent to approximately around 5.76% (Yahoo Finance (b), 2012). Figure 5: Share Price movements of Vodafone (Source: Yahoo Finance (b), 2012) Thus, in terms of share price volatility as well as market share, it has been assessed that Vodafone is in a much stronger position than France Telecom-Orange. Risks One of the major risks that Vodafone is exposed to is that its business can be badly impacted by a breakdown or noteworthy disruption to telecommunications networks. Moreover, the Group’s business could suffer owing to actual or perceived health hazards related to radio wave transmissions from mobile phones and other allied equipments. Furthermore, Vodafone could encounter loss of customer loyalty as well as legal actions if the Group fails to safeguard its client informations. Other than this, the company would be exposed to the impacts of regulatory changes and fluctuations in the economic conditions across the world, and particularly in Europe (Vodafone, 2012; Ernst & Young, 2012). Recommendation The extent of Vodafone's business operations in Europe gives it a competitive edge over its peers, permitting it to procure handsets as well as equipments at relatively less prices. Owing to its multinational existence, Vodafone can also build up a product in one nation and market it to a number of other nations at negligible added expense. Historically, Vodafone has been successful in efficiently utilising these advantages to get into new markets, particularly the emerging markets of Africa and India. Despite the fact that the emerging markets at present make up only for about 25% of the company’s revenue, they are considered to be the chief driver of potential growth. Ultimately, Vodafone intends to encourage revenues with pioneering progress in their offerings related to 3G technologies in addition to enhancing their operational competence by means of cost reduction endeavours (Vodafone 2012). It has been observed from the financial ratio analysis that the liquidity ratios of Vodafone are very low, though they have risen in comparison to the previous year. It is indicative that the liquidity position of Vodafone or its capability to meet sudden obligations needs to be improved. The profitability ratios indicate that the company had been able to generate decent returns and had utilised its asset and equity optimally. Though the percentage returns generated by Vodafone had declined in 2012 in comparison to than of 2011, the decline in very minute and hence insignificant. The solvency ratios of Vodafone imply than the company is not very leveraged, however, it can be observed that the leverage of the company had increased in 2012 as against that of 2011. Moreover, the interest coverage capability of the company had also declined over the year. Therefore, considering the decent past four year performance of Vodafone and its dividend payment trend, along with its market position, it would be advisable to invest ?1Million in the stocks of Vodafone. This view is supported by the recommendation provided by Richard Wachman and David Stevenson, according to whom Vodafone's shares are moderately cheap and present defensive attributes at a time when the economic scenario of the developed nations is not as stable and positive as compared to the emerging nations (The Guardian, 2011; Money Week, 2011). References Bloomberg Businessweek, 2012. Balance Sheet [Online] Available at: http://investing.businessweek.com/research/stocks/financials/financials.asp?ticker=VOD:LN&dataset=balanceSheet&period=A¤cy=native [Accessed on November 10, 2012]. Bloomberg Businessweek, 2012. Cash flow [Online] Available at: http://investing.businessweek.com/research/stocks/financials/financials.asp?ticker=VOD:LN&dataset=cashFlow&period=A¤cy=native [Accessed on November 10, 2012]. Bloomberg Businessweek, 2012. Income Statement [Online] Available at: http://investing.businessweek.com/research/stocks/financials/financials.asp?ticker=VOD:LN&dataset=incomeStatement&period=A¤cy=native [Accessed on November 10, 2012]. Bloomberg, 2012. Snapshot for Vodafone Group PLC (VOD). [Online] Available at: http://www.bloomberg.com/quote/VOD:LN [Accessed on November 10, 2012]. Brigham, E. F., & Ehrhardt, M. C., 2010. Financial Management Theory and Practice. USA: Cengage Learning. Ernst & Young, 2012. Top 10 risks in telecommunications 2012. [Pdf] Available at: http://www.ey.com/Publication/vwLUAssets/Top_10_risks_in_telecommunications_2012/$FILE/2012_TelecomsBusinessReport_13Feb2012_low%20res.pdf [Accessed on November 10, 2012]. Euro Investor, 2011. France Telecom: FY 2011 Financial Results [Online] Available at: http://www.euroinvestor.com/news/2012/02/22/france-telecom-fy-2011-financial-results/11911229 [Accessed on November 10, 2012]. London Stock Exchange, 2012. Vodafone Group PLC (VOD). [Online] Available at: http://www.londonstockexchange.com/exchange/prices-and-markets/stocks/summary/company-summary.html?fourWayKey=GB00B16GWD56GBGBXSET0 [Accessed on November 10, 2012]. Orange, 2011. Annual Report 2011. [Pdf] Available at: http://www.orange.com/en/finance/regulated-information/annual-reports [Accessed on November 10, 2012]. Reuters, 2012. Vodafone Group PLC. [Online] Available at: http://uk.reuters.com/business/quotes/financialHighlights?symbol=VOD.L [Accessed on November 10, 2012]. Telefonica, 2010. 2010 Annual Report. [Pdf] Available at: http://www.telefonica.com/en/annual_report/pdf/telefonica_ia10_eng.pdf [Accessed on November 10, 2012]. Vodafone, 2012. Vodafone Group Plc Annual Report [Pdf] Available at: http://www.vodafone.com/content/dam/vodafone/investors/annual_reports/Vodafone_Annual_Report_12.pdf [Accessed on November 10, 2012]. Yahoo Finance (a), 2012. France Telecom (FTE.PA). [Online] Available at: http://in.finance.yahoo.com/echarts?s=FTE.PA#symbol=fte.pa;range=1y;compare=;indicator=volume;charttype=area;crosshair=on;ohlcvalues=0;logscale=off;source=undefined [Accessed on November 10, 2012]. Yahoo Finance (b), 2012. Vodafone Group PLC (VOD. L). [Online] Available at: http://uk.finance.yahoo.com/echarts?s=VOD.L#symbol=vod.l;range=1y;compare=;indicator=volume;charttype=area;crosshair=on;ohlcvalues=0;logscale=off;source=undefined [Accessed on November 10, 2012]. The Guardian, 2011. Our share tips for 2012. [Online] Available at: http://www.guardian.co.uk/business/2011/dec/27/share-tips-for-2012 [Accessed on November 12, 2012]. Money Week, 2011. Should you buy shares in Vodafone? [Online] Available at: http://www.moneyweek.com/investment-advice/share-tips/are-vodafone-shares-still-worth-buying-54801 [Accessed on November 12, 2012]. Appendices 1. Income Statement Currency in As of: 31-Mar 31-Mar Millions of British Pounds 2011 2012   GBP GBP Revenues 45,884.00 46,417.00 TOTAL REVENUES 45,884.00 46,417.00 Cost Of Goods Sold 30,814.00 31,546.00 GROSS PROFIT 15,070.00 14,871.00 Selling General & Admin Expenses, Total 8,367.00 8,302.00 Other Operating Expenses 16 10 OTHER OPERATING EXPENSES, TOTAL 8,383.00 8,312.00 OPERATING INCOME 6,687.00 6,559.00 Interest Expense -1,225.00 -1,644.00 Interest And Investment Income 1,309.00 456 NET INTEREST EXPENSE 84 -1,188.00 Income (Loss) On Equity Investments 5,059.00 4,963.00 Currency Exchange Gains (Loss) -- -- Other Non-Operating Income (Expenses) 818 -369 EBT, EXCLUDING UNUSUAL ITEMS 12,648.00 9,965.00 Impairment Of Goodwill -6,150.00 -4,050.00 Gain (Loss) On Sale Of Investments 3,000.00 3,634.00 EBT, INCLUDING UNUSUAL ITEMS 9,498.00 9,549.00 Income Tax Expense 1,628.00 2,546.00 Minority Interest In Earnings 98 -46 Earnings From Continuing Operations 7,870.00 7,003.00 NET INCOME 7,968.00 6,957.00 NET INCOME TO COMMON INCLUDING EXTRA ITEMS 7,968.00 6,957.00 NET INCOME TO COMMON EXCLUDING EXTRA ITEMS 7,968.00 6,957.00 2. Balance Sheet Currency in As of: 31-Mar 31-Mar Millions of British Pounds 2011 2012   GBP GBP Assets     Cash And Equivalents 6,252.00 7,138.00 Short-Term Investments -- 3 Trading Asset Securities 790 1,145.00 TOTAL CASH AND SHORT TERM INVESTMENTS 7,042.00 8,286.00 Accounts Receivable 4,238.00 3,900.00 Other Receivables 1,887.00 3,318.00 TOTAL RECEIVABLES 6,125.00 7,218.00 Inventory 537 486 Prepaid Expenses 3,299.00 3,702.00 Restricted Cash -- 333 TOTAL CURRENT ASSETS 17,003.00 20,025.00 Gross Property Plant And Equipment 48,769.00 48,267.00 Accumulated Depreciation -28,588.00 -29,612.00 NET PROPERTY PLANT AND EQUIPMENT 20,181.00 18,655.00 Goodwill 45,236.00 38,350.00 Long-Term Investments 41,077.00 38,700.00 Accounts Receivable, Long Term 92 120 Deferred Tax Assets, Long Term 2,018.00 1,970.00 Other Intangibles 23,322.00 21,164.00 Other Long-Term Assets 2,291.00 592 TOTAL ASSETS 151,220.00 139,576.00       LIABILITIES & EQUITY     Accounts Payable 4,453.00 4,526.00 Accrued Expenses 9,549.00 10,036.00 Short-Term Borrowings 2,253.00 3,334.00 Current Portion Of Long-Term Debt/Capital Lease 7,653.00 2,924.00 Current Income Taxes Payable 1,912.00 1,898.00 Other Current Liabilities, Total 1,255.00 1,307.00 TOTAL CURRENT LIABILITIES 27,075.00 24,025.00 Long-Term Debt 28,375.00 28,362.00 Minority Interest 6 1,267.00 Pension & Other Post-Retirement Benefits 87 337 Deferred Tax Liability Non-Current 6,486.00 6,597.00 Other Non-Current Liabilities 1,636.00 2,053.00 TOTAL LIABILITIES 63,659.00 61,374.00 Common Stock 4,082.00 3,866.00 Additional Paid In Capital 153,760.00 154,123.00 Retained Earnings -77,661.00 -84,184.00 Treasury Stock -8,171.00 -7,841.00 Comprehensive Income And Other 15,545.00 10,971.00 TOTAL COMMON EQUITY 87,555.00 76,935.00 TOTAL EQUITY 87,561.00 78,202.00 TOTAL LIABILITIES AND EQUITY 151,220.00 139,576.00 3. Financial Ratios Financial Ratios Mar-11 Mar-12 Current Ratio 0.63 0.83 Quick Ratio 0.61 0.81 Gross Profit Margin 32.84% 32.04% Net Profit Margin 17.37% 14.99% Return on Equity 9.10% 9.04% Return on Asset 5.27% 4.98% Debt to Equity 0.32 0.37 Debt to Asset 0.19 0.20 Interest Coverage ratio 5.46 3.99 Debt to Capital 0.24 0.27 Read More
Cite this document
  • APA
  • MLA
  • CHICAGO
(“Analyst Management Summary Report of Vodafone UK Essay”, n.d.)
Analyst Management Summary Report of Vodafone UK Essay. Retrieved from https://studentshare.org/marketing/1460567-analyst-management-summary-report-of-vodafone-uk
(Analyst Management Summary Report of Vodafone UK Essay)
Analyst Management Summary Report of Vodafone UK Essay. https://studentshare.org/marketing/1460567-analyst-management-summary-report-of-vodafone-uk.
“Analyst Management Summary Report of Vodafone UK Essay”, n.d. https://studentshare.org/marketing/1460567-analyst-management-summary-report-of-vodafone-uk.
  • Cited: 0 times

CHECK THESE SAMPLES OF Growth and Strategy of Vodafone Company

Vodafone: An Analysis of the Marketing Mix

A novel idea may be able to generate significant revenue over the short term but the long term growth and sales are only possible when the customer perceptions are successfully shifted positively in a firm's favor by using the correct marketing mix of: product, price, place and promotion.... Analyzing the strategic and marketing policies followed by the company can help in identifying the reasons for their continued profitability 2.... Soon it added Astec Communications, a service provider with 21 stores, in the acquisition portfolio by purchasing 80% of the company (cellnet, 2012)....
11 Pages (2750 words) Essay

Vodafone International Strategic Development

The initial acquisition move of the company was a merger with AirTouch Communications Inc.... The company briefly renamed itself as Vodafone AirTouch is a gradual move towards aligning AirTouch to its global strategy (Johannes and Ashok, 2009, P.... The company's North American branch was integrated into a new entity branded Verizon Wireless together with Bell Atlantic's mobile business with the company retaining a 45% stake in the new venture....
18 Pages (4500 words) Essay

Strategy for Mobile Services Providers - Vodafone versus Orange

The company further suggests ways in which Orange can improve its market strategies in order to compete effectively with Vodafone, Hutchinson, and O2 and other competitors.... Vodafone is the largest telecommunications company, and its headquarters are located in Newbury, England.... The company was formed in 1982 but has since established itself as a worldwide brand.... The company is a joint venture between Racial Electronics and Milicom and the Hambros technology....
12 Pages (3000 words) Essay

The Theory of the Growth of the Vodafone

The volatility of the telecommunication market has seen the fluctuating fortunes of vodafone, a company that has for some time been recovering after a torrid couple of years but it is now the biggest wireless operator and one of the largest companies by market capitalisation.... This has brought up the need for every mobile service provider company to strategically place itself in the industry in order to have a competitive edge in the provision of the necessary services to its clients....
6 Pages (1500 words) Essay

Vodafone Plc: Its Future As a Network Operator

This report analysis has been developed to analyse related to the further growth of vodafone which is now targeting developing nations like India for future expansion.... The most unique thing about the company is the very local nature of it services.... With a market cap of 72 billion pounds (on May 26, 2006), the company is ranked 22nd among world's largest company on market cap analysis.... The company was awarded the license to operate as a mobile company in the year 1982 and in this twenty-five years have become one of the most valuable telecom company in the world with current employee strength around 61700....
12 Pages (3000 words) Research Paper

Introduction to Business: Vodafone Group Plc

So Vodafone is in an important stage of its evolution as a multinational company.... Though the company had tasted success on a consistent basis in In other words, the past successes may not indicate future positive results.... While the company still retains many of its unique selling propositions and brand image, recent results have shown some existing technical glitches within the organization.... n 2000, Vodafone led the industry's biggest takeover of another company with its acquisition Mannesmann (the German electronics company) for 112 billion pounds....
11 Pages (2750 words) Essay

Mix strategy for Mobile Services Provider Vodafone

The author explains that Vodafone is the largest telecommunications company, and its headquarters are located in Newbury, England.... The company was formed in 1982 but has since established itself as a worldwide brand.... The company is a joint venture between Racial Electronics and Millicom and the Hambros technology.... Vodafone is the largest telecommunications company, and its headquarters are located in Newbury, England....
13 Pages (3250 words) Essay

Performance of the Vodafone Company for the Last Two Years

This paper "Performance of the vodafone company for the Last Two Years" focuses on the fact that the rate net profits have reduced substantively over the last year and is just single digits this year.... n the case of vodafone, there has been a substantial decline in ROI by nearly 5 percentage points, which would affect the psyches of investors who would want to invest in shares of this company.... The consistency factor in revenues and profits, which are critical elements for investment decisions, seen to be missing in the context of vodafone....
12 Pages (3000 words) Assignment
sponsored ads
We use cookies to create the best experience for you. Keep on browsing if you are OK with that, or find out how to manage cookies.
Contact Us