StudentShare
Contact Us
Sign In / Sign Up for FREE
Search
Go to advanced search...
Free

Effects of Steve Jobs Death on Apple Stock Return - Essay Example

Cite this document
Summary
The paper "Effects of Steve Jobs Death on Apple Stock Return" states that the greatest focus of management ought to be on global marketing strategies and professional customer service. The company has to remain focused on the innovation plan, through research and development…
Download full paper File format: .doc, available for editing
GRAB THE BEST PAPER94.4% of users find it useful
Effects of Steve Jobs Death on Apple Stock Return
Read Text Preview

Extract of sample "Effects of Steve Jobs Death on Apple Stock Return"

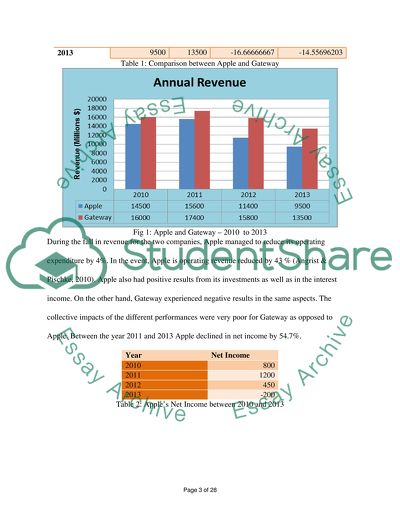
Econometrics Macroeconomics Effects of Steve Job’s Death on Apple Stock Return Gateway Computer Introduction The death of Steve Jobs, the Former Chief Executive of Apple Computer, apparently had a negative effect on the organization as reflected in the stock performance from the year 2011 onwards. The close competitors such as Gateway Computer still existing in the computer and information Systems market appear to have gained advantage from the year Steve Jobs died. In the years before and during 2011, Apple Computers produced and sold personal computer systems to its customers worldwide. This included individual clients, institutions of learning, health sector and business consumers. Apple still sells its computer directly to the customers using an online store through various outlets in the global domain (Geweke, Horowitz and Pesaran, 2008). At the same time, Apple stores sell its products via other retail outlets such as the mass-market distributors. By comparison, Apple and Gateway are almost equal in their size. They also respond to their business challenges using similar market strategies. The two firms are experiencing various significant difficulties in the present market. The death of Steve Jobs particularly affects Apple’s stock return and causes it to decline in its entire economy and financial performance. This is especially true with the sales of personal computers. The accounting practices of Apple Inc. are strongly harmonious with the international standard and give a declining performance in comparison with the Jobs time. The two companies Apple and Gateway show a revenues decline for the years between 2011 and 2013. Apple declined by 16.7% while Gateway declined by 14.6% from 2012 to 2013. Apple Gateway % Increase / Decline - APPLE % Increase / Decline - Gateway 2010 14500 16000 0 0 2011 15600 17400 7.586206897 8.75 2012 11400 15800 -26.92307692 -9.195402299 2013 9500 13500 -16.66666667 -14.55696203 Table 1: Comparison between Apple and Gateway Fig 1: Apple and Gateway – 2010 to 2013 During the fall in revenue for the two companies, Apple managed to reduce its operating expenditure by 4%. In the event, Apple is operating revenue reduced by 43 % (Angrist & Pischke, 2010). Apple also had positive results from its investments as well as in the interest income. On the other hand, Gateway experienced negative results in the same aspects. The collective impacts of the different performances were very poor for Gateway as opposed to Apple. Between the year 2011 and 2013 Apple declined in net income by 54.7%. Year Net Income 2010 800 2011 1200 2012 450 2013 -200 Table 2: Apple’s Net Income between 2010 and 2013 Fig 2: Apple’s Net Income between 2010 and 2013 Apple had a momentous operational return as far as liquidity is concerned. Its quick ratio had doubled. Profitability and Return on Equity increased almost 69 times while its inventory management increased more than ten times faster. These factors were the driving force for the fundamental financial features and differences. Year Inventory Turnover 2010 450 2011 700 2012 500 2013 240 Table 3: Apple Inventory Turnover – 2010 to 2013 Fig 3: Apple Inventory Turnover – 2010 to 2013 The fundamental factor for the negative developments in Apple after the death of Steve Jobs is the massive decline in stock prices. This fell significantly and the viability of the stock faced threats when Apple was able to maintain its level of liquidity. Year Stock Price 2010Q1 70 2010Q2 75 2010Q3 78 2010Q4 85 2011Q1 90 2011Q2 98 2011Q3 100 2011Q4 92 2012Q1 83 2012Q2 80 2012Q3 77 2012Q4 70 2013Q1 67 2013Q2 65 2013Q3 56 Table 4: Stock Price Variation Fig 4: Stock Price Variation 2. Literature Review 2.1. Back Ground Apple Computer Apple Computer Inc. was formed in the year1976 in California. It has risen from a startup company to a multibillion Dollars organization. It currently has more than 11000 employees. Steve Jobs and Steve Wozniak began the organization inside their parent’s garage (Kelejian and Wallace, 1989). Not long after that, Apple Computers Company developed the first computer model that successfully won a mass-market profile. It received inspiration from the following: The 1979 research works at Xerox PARC The 1984 launching of Macintosh The 1984 Commercial launch of the Macintosh by Superbowl The 1993 development of the initial PDA (Personal Digital Assistant) and the Apple’s introduction of Newton 2.2. Beginning of Sales In 1997, Apple began the sale of its product. The sales of personal computers were made directly to the consumers through the Internet. In a matter of one week of Apple operation, the firm increased its stores and because the third ecommerce website in size, using the internet In 2001, Apple Company Inc. opened the first retail outlet. At present, it has more than 31 retail outlets in 17 states. 2.3. Apple Products Apple Company Inc. designs, produces and sells various models of personal computers as well as other closely related computing systems and communication service solutions. The latest models of Apple are Apple Macintosh PC Processors, I phones, iPods and Apple tablets. Apple develops, designs, produces, and sells its products worldwide, apart from offering support services online to remote clients. Its products are mainly portable PC, servers, hand held devices and special operating systems for operating the portable machines. Apple also offers several services including communication, financial services, development of peripheral tools, software solutions, business services and system support and training program. 2.4. Markets and Channels Principally, Apple Computer Company serves its consumer through the strategy of creative and informative markets. It serves individual as well as small-scale organizations. Secondarily, The Company serves the corporate business market, including learning institutions, communication firms, health organization and financial institutions. It offers professional services to customers through selected retail traders as well as the mass-marketing segments via cataloguing and marketing (Kennedy, 2003). Apple also runs an active online retail store and more than 32 retail outlets. The retail outlets provide Apple with immediate distribution of products from Apple Company, with inventory management from within the stores. Primarily serves the consumer market. Secondarily serves the education and business markets. Apple Company Inc. serves customers through direct to consumer catalog sales (Pindyck and Daniel, 1998). It operates an online store and 227 retail stores. The retail stores offer only ordering of Gateway products, carrying no inventory. 3. Econometric Models / Methodology 3.1. Financial Year The fiscal year for Apple begins in October and closes at the end of September every year. 3.2. Inventory Just like Gateway, Apple Computer Companies uses the First in First out as the method of valuation of its inventories. It uses the lower FIFO cost of products in the market (Keisuke, 2008). 3.3. Fixed Assets The Apple Computer Company value of fixed asset includes the property, equipment, Machinery and equipment (Vassilis, 2008). The computer products at Apple Company use the reducing balance as well as the straight-line methodology on the estimated significant lifespan of the assets (Hayashi, 2000). The Apple Company used the length of depreciation applied by its fixed assets as follows: Asset Items Rating Equipment 3 to 7 Furniture 9 Internal Software 4 - 8 Vehicles 4 Leasehold development 15 Building 27 3.4. Revenue Consideration Apple Computer Company considers an item to be revenue when a persuasive indicator of a plan is in existence and the delivery has taken place at a fixed or determinable sales price. 3.5. Warranty Liability The revised product warranty strategies prompt Apple Company to provide for the approximate cost faced when the related revenue is considered. 3.6. The Cost of Advertisement In the Apple Computer Company, the cost of advertisement is expensed whenever it is faced. Most of the advertisement takes place on the online platform through the Apple Website and on international marketing website. 3.7. Apple Unique Focus 3.7.1. Acceptance and Implementation of SFAS No.133 Apple Computer Company adopted SFAS No. 133 in the year 2000, which established a standard for accounting as well as reporting for the derivatives, hedging practices and the definition of exposure (Santos and Tenreyro, 2006). With Steve Jobs in action, this led to a progressive growth of the impact of the Net income tax to approximately $5.5 million. The decision to adopt the SFAS 133 generated favorable cumulative impact and adjustment, enabling Apple Company to participate in other detailed income generating areas, producing more than US $12.2 million in 2001 and US $16 Million in 2011, before Steve Job’s death. 3.7.2. Translation of Foreign Currency Risk The executive committee had decided that Apple Company mitigates the risk of financial losses through translation of the assets liabilities from all its subsidiaries into US$ (Dollars). In the translation, the company used the foreign exchange rates prevailing at the end of every financial period (Eatwell et al, 1990). All the revenues and operational expenditure incurred during the period from the Apple subsidiaries were translated by use of exchange rates closest to the prevailing rates in the same period. In the absence of Steve Jobs, the Company adopted various methods of managing the Foreign Exchange exposure by use of other international currencies such as Euro and GB Pounds, as a strategy to capture the international Market against its closest competitors like Gateway. 3.8. The Costs of shipment Apple Computer Company Inc includes the cost of shipping and handling of the confinements, in the cost of all sales for the financial period under the prevailing financial periods. With the rising costs of shipping of Apple’s products, the management of Apple opted to adjust the prices of the products upwards internationally. The effect reduced the level of demand for Apple Products (Paul and William, 2004). The shipment becomes more expensive as the rise in the value of US Dollars against other international currencies also affects the availability of the currencies. Year Shipment Cost (Million $) 2010Q1 56 2010Q2 60 2010Q3 40 2010Q4 45 2011Q1 56 2011Q2 45 2011Q3 40 2011Q4 30 2012Q1 30 2012Q2 35 2012Q3 64 2012Q4 74 2013Q1 80 2013Q2 77 2013Q3 79 2013Q4 83 Table 5: Apples Shipment Cost Fig 5: Shipment Cost – 2010 to 2013 3.9. Research and Development Apple Computer Company emphasizes on the area of Research and development, whose costs are allocated to the period in which they occur. Development is a result of the studies carried out in the production of computer hardware and the software for sales. The products are sometimes sold subject to the discussion of the market capitalization, which begins after the establishment of the technological viability. It ends after the establishment of the availability of the product for general issuance to the consumers. 3.10. Apple Stock-Oriented Compensation Apple Company assesses the compensation of its workers based on the stock performance and the individual performance rating of the employee. Steve Jobs, being the Chief Executive of the company, had an allocation of more than 50% shares of the stock. The massive ownership must have had to work better for the interest of the company. After his death and beneficiary compensation plan, the company effort was greatly affected by the liability attached to the stocks (Markoff, 2005). Apple uses the intrinsic value approach to provide pro forma admission of the impacts of the compensation on the on net earnings of the company for every share held. This was in assumption that value - oriented approach was in effect to measure the expense and the burden of compensation. 3.11. Apple’s Royalties Apple Computer Company Inc bears permission to hold a royalty licensing, which allows it as a Company to conduct the sales of both software and hardware. This license is protected through a patent, a license or copyright terms (Robert, 1999). The cost of royalty is included in the cost of sales of goods and services, after shipping the products to the destinations or after the amortization over a period. The licensing term may not particularly be close to the units of products shipped. 4. Data Summary 4.1. Income Summary The study question involved in this study is on whether the death of Steve Jobs had an effect whether positive or negative, on the performance and return of the apple stock. To study this pattern, the study uses regression analysis, linear correlation Analysis and Time series analysis through quantitative data analysis approach (Pedace, 2013). It uses two variables of data, D / L representing death /Life, and the stock price over the period of four years being studied. In the L and D variable, L represents Life and D represents Death of Steve Jobs. 4.1.1. Time Series analysis This gives a time series analysis and comparison as follows. 4.1.1.1. Output Fig 6: Stock Price Time Series Analysis 4.1.1.2. Discussion The time series shows two fundamental segments, the first being during the lifetime of Steve Jobs, from 2010 to the third quarter of 2011. Apple experienced its peek return on investment during that period. After his death, suddenly the stock began to decline continuously (Rust, 1987). 4.1.2. Linear Regression Linear regression was conducted as a statistical Analysis using SPSS. It used the same variables L/D against the dependent variable, Stock Price. The Output is as shown below: 4.1.2.1. Output Descriptive Statistics Mean Std. Deviation N StockPrice 94.56 21.395 16 LD .4375 .51235 16 Correlations StockPrice LD Pearson Correlation StockPrice 1.000 .043 LD .043 1.000 Sig. (1-tailed) StockPrice . .437 LD .437 . N StockPrice 16 16 LD 16 16 ANOVAb Model Sum of Squares df Mean Square F Sig. 1 Regression 12.668 1 12.668 .026 .874a Residual 6853.270 14 489.519 Total 6865.938 15 a. Predictors: (Constant), LD b. Dependent Variable: StockPrice Coefficientsa Model Unstandardized Coefficients Standardized Coefficients t Sig. 95% Confidence Interval for B B Std. Error Beta Lower Bound Upper Bound 1 (Constant) 93.778 7.375 12.716 .000 77.960 109.596 LD 1.794 11.150 .043 .161 .874 -22.121 25.708 a. Dependent Variable: StockPrice Figure 7: Results for Linear Regression Analysis 4.1.2.2. Discussion The linear Regression Exercise gave coefficients of 0.437. This shows that the life of Steve Jobs had a positive contribution towards the growth of Apple Stock. Similarly, the death of Steve Jobs had a negative contribution towards the growth and performance of the Stock in the market (Swann, 2008). The reliability of the regression results is high because the confidence level is 95% and the statistical significance is 0.874. The null hypothesis cannot be adopted in this case. 4.1.3. Linear Correlation Analysis The linear Correlation Analysis was conducted in SPSS, using the two variables, Apple Stock price and L / D Variable. The hypothesis was that the death of Steve Jobs negatively affected the performance of Apple Company Inc. 4.1.3.1. Output The results are shown below: Descriptive Statistics Mean Std. Deviation N StockPrice 77.50 13.628 16 LD .4375 .51235 16 Correlations StockPrice LD StockPrice Pearson Correlation 1 .511* Sig. (2-tailed) .043 Sum of Squares and Cross-products 2786.000 53.500 Covariance 185.733 3.567 N 16 16 LD Pearson Correlation .511* 1 Sig. (2-tailed) .043 Sum of Squares and Cross-products 53.500 3.938 Covariance 3.567 .262 N 16 16 *. Correlation is significant at the 0.05 level (2-tailed). Fig 8: Linear Correlation Analysis 4.1.3.2. Discussion The correlation analysis revealed that there was a positive coefficient of 0.511. The statistical significance of this test was 0.43. This is greater than 0.05. The null hypothesis cannot be adopted hence the hypothesis has been proved to be true, that the death of Steve Jobs had a negative influence on the performance of Apple’s stock in the stock market. 4.2. Analysis of Revenue Growth The Apple companies produced revenue of an equal magnitude in 2010. It produced $12.4m while Gateway produced $9.3m. During the period between 2010 and 2011, the sales for apple declined remarkably. The sales volume of Apple’s products dropped by 33% while that of Gateway declined by 37%. This fall was because of the holistic reduction in the market of the non-portable personal computer. The market was adversely affected by the decline of sales opportunities in the U.S market as the federal economy deteriorated (Pearl, 2000)). It is worth noting that both Gateway Company and Apple Company. The emphasis by Steve Jobs on the reach ability of the global market was evidently missing in the advisory services of the company, which explains the sudden decline of the operational income. Year Apple Operational Income 2010 800 2011 1200 2012 450 2013 -200 Table 5: Apples Operational Income Figure 9: Apples Operational Income The cost of sales for Apple Company fell 29% in the years between 2010 and 2011. After the fall, it began to increase for Apple, 36.5 % almost the same extent to which its revenue declined. Operational expenses for Apple dropped slightly by 4.0% between 2010 and 2011 but increased in the year 2012 in the first quarter. This variation between the changes in operational expenditure and caused a massive differential between the Apple’s operational revenue (Wooldridge, J. (2003). The operational revenue of Apple dropped by 165.9% from the year 2012 to 2013. During the year 2013, Apple had a net deficit of $37m, a drop of about 102.7 % the previous year 2012. Year Apple Operational Expenses 2010 450 2011 800 2012 950 2013 1200 Table 7: Apples Operational Expenses Figure 10: Apples Operational Expenses 4.3. Investments Return and Interest Revenue Stock return features under the influence of yet another factor financial performance, the income interest expense and the volume of investments (Granger, 1991). For 2011, this earned extra profits to Apple Company. Essentially, it added $392m to the basic position of the company. This almost mitigated the 2010 shortage in operating income. Year Apple Income Interest 2010 700 2011 550 2012 800 2013 1100 Table 8: Income Interest Fig 11: Income Interest 4.4. Income Taxes Apple Computer Company faced a heavy negative shift in the effects of its income tax on the net income. The drop of Apple taxation had increased negative effect on its net income ($15.2m). Year Apple Income Taxes 2010 560 2011 340 2012 20 2013 -30 Table 9: Income Taxation Fig: 12: Apple Income Taxes 4.5. Analysis of economic Ratios 4.5.1. Liquidity As far as liquidity is concerned, Apple Company had a current ratio of 4.9 in 2011 before Steve Jobs passed on. This was more than twice the performance of the previous year 2010, and above the average for the information Technology Industry, which made a 2.1 ratio. In a similar manner, the quick ratio for Apple was 3.8, which was almost three times that of the entire information technology Industry, with a mean of 2.30 (Davidson & James, 1993). Year Current Ratio Quick Ratio 2010 2.7 2.5 2011 4.9 3.8 2012 2.6 2.1 2013 2.2 1.7 Table 10: Liquidity Ratios Fig 13: Current Ratio and Quick Ratio 4.5.2. Asset Optimization The strategies of managing the receivable turnover by Apple Company are about the mean of the turnover ratio of receivables of 11.4 while that of the entire industry is an average of 12.10. One of the main areas of variation between Apple asset performances began with the decline of the inventory Turnover in the third quarter of 2011 onwards to the last quarter of 2013. This aspect has always placed apple Company in the forefront worldwide (Mackinlay, 1997). This is made exceptional by the ratio of inventory of 488.65. It turned over the inventory by 25 % within less a day on average (Studenmund, 2011). These turn over ratios are more than seven times stronger than that of the industry mean of 67.77 inventory turnover. 4.5.3. Asset Turnover Apple Computer Company made an Asset Turnover Ratio of 0.91, which was half of the Information Technology industry whose mean was 1.80. This shows that from 2011, since Steve Jobs died, Apple Computer Company has not been efficient in the usage of its assets as it is in the industry. In return, it has not been able to generate enough sales. Year Asset Turnover Ratio 2010 2.1 2011 2.8 2012 2.6 2013 2.2 Table 11: Asset Turnover Ratio Fig 14: Asset Turnover Ratio 4.5.4. Control of Debts Apple Company only utilizes a minor part of its debt financing. The company is slightly below the entire information industry’s mean ratio of debt to equity. It ran on an average of 0.08 while the industry was at a mean of 0.09. However, the death of Steve Jobs owes nothing to do with the maintenance of the ratio to the same level for all the four years affected (Pagan and Aman, 1999). 4.5.5. Profitability The gross Profit margin for the Apple Company gross was 24.06 % in 2010. This exceeds that of the industry with an average of 19.20 %. The margin in 2013 fell to 18.07 %, below the standard position of the industry, being at 21.34%. Year Apple IT Industry 2010 24.06 19.2 2011 25.1 21 2012 22.45 23.43 2013 18.07 21.34 Table 12: Gross Profit Margin Fig 15: Gross Profit Margin 4.5.6. Return on Equity (ROE) In 20101, Apple had equity multiplier as the major source of ROE. Through the equity multipliers, Apple obtained return on Equity of 1.53. To a minor extent, Return on Equity was produced by the asset turnover. The gross profit margin contributed negligible value in the generation of the return on Equity. According to Butcher (1987), another negligible contributor of the return on Equity for Apple company was the profit margin, contributing –0.17. The analysis of 2010 and 2011 found out a better method to the realization of the ROE for Apple. Owing to the economic depression during the entire market performance and in the portfolio of the personal computer stocks, 2010 and 2011 were better normal years in terms of distribution. In 2012, Apple realized Return on Equity of with the equity multiplier being at 1.70 the gross profit margin was at 0.11 whereas the asset turnover ratio was at 1.27. Ultimately, the units of sales for Apple Computers were less than that of Gateway and the IT industry as the year 2012 approached and continued that way even after 2012. It had a high profit margin compared to the industry in 2010. In the absence of Steve Jobs, the Apple product variation strategy of application of low cost created a vacuum in the profitability in spite of making higher sales volume. 5. Results and analysis The analysis of the Apples financial position was done in consideration of the statistical and financial factors affecting the stock market and valuation of stock through intrinsic method. These factors and variables include beta, price of each stock, the ratio of Price to Earning, the ratio of price to book value and the ratio of price to the sales value (Russell and James, 2004). 5.1. Beta Apple Company realized a beta 1.65 in 2010, 1.83 in 2011, 1.78 in 2012 and 1.73 in 2013. The company serves the wider market. It has therefore faced direct effects of the variations in the stock market as well as the economy (Giovanini, 2008). Consequently, Apple is expected to perform company and flow in the same direction as the rest of the stock market by improving the stock price. Apple was moving in that direction as the market before the death of Steve Jobs, and indeed, the company became under sensitive to the need to overcome the economic forces and the stock market variables (Stephen and Deirdre, 2004). Using the weighted average capital computation, the portfolio beta of the Apple before and after 2012 appears as shown below. Beta analysis Percentage of Portfolio Beta Weighted Average 2010 60 1.7 1.04 2013 40 2.1 0.88 Total portfolio 100 1.91 Table 13: Beta Analysis As seen in the analysis, the portfolio of the stock was strong enough in the year 2010 and was able to shield the stock dangers of unsystematic risk. 5.2. Stock Price During the period from 2011 to 2013, the stock of Apple Computers Company maintained a falling trend. From 2011 onwards, it remained lost 5.8% compared to its previous average stock price. In 2012, the stock value of Apple reduced further from $92 to $70.0, and eventually to $56.00 in 2013. 5.3. Price to Earnings Ratio From the year 2010 to 2011, the ratio of Price to Earning for Apple Company increased from 27.10 to 33.00. This however did not match the mean of the industry, which is at 51.40. In the year 2012, the ratio moved from 33 to 28 and eventually to 24 in 2013. 5.4. Price to Sales Ratio From the year, 2010 to 2011 the ratio of stock price to sales for Apple increased from 1.04 to 1.07. From the year 2011 to 2012, it fell from 1.07 to 1.04 and further to 1.02 in 2013 (Asteriou & Hall, 2011). This however remained almost above the industry’s ratio of price to sale, which remained at an average of 1.05. 5.5. Price to Book Ratio The price to Book ratio for Apple Company dropped from 2.15 to 1.36 in 2011. This was below the mean value for the industry at 3.30. This further fell to 1.32 in 2012 and eventually, to 1.29 in 2013. 6. Conclusion and Recommendation The improvement of the Apple Stock return is possible if the company remains focused on the ideas of Steve Jobs as one of the Pioneers of the company. The greatest focus of the management ought to be in the global marketing strategies and professional customer service. Secondly, the company has to remain focused on the innovation plan, through research and development to meet the dynamic needs of the consumers. References Angrist, J. & Pischke, J. (2010). "The Credibility Revolution in Empirical Economics: How Better Research Design Is Taking the Con out of Econometrics], 24(2), pp. 21–30. Asteriou, D. & Hall, S. G. (2011). "The Classical Linear Regression Model". Applied Econometrics (Second ed.). Palgrave MacMillan. pp. 30 – 90. Butcher, L. (1987). Accidental Millionaire: The rise and fall of Steve Jobs at Apple. Paragon House. Davidson, R. & James G. M. (1993). Estimation and Inference in Econometrics. Oxford University Press. Eatwell, J, et al., eds. (1990). Econometrics: The New Palgrave.. Geweke, J., Horowitz, J. and Pesaran, H. (2008). "Econometrics". In Durlauf, Steven N.; Blume, Lawrence E. The New Palgrave Dictionary of Economics (Palgrave Macmillan). Giovanini, E. (2008). Understanding Economic Statistics, OECD Publishing, 2008. Granger, C.(1991). Modelling Economic Series: Readings in Econometric Methodology. Oxford University Press. Hayashi, F. (2000). Econometrics, Princeton University Press. Keisuke, H. (2008). "Decision theory in econometrics," The New Palgrave Dictionary of Economics, 2nd Edition. Kelejian, H. H. and Wallace E. O. (1989) Introduction to Econometrics Kennedy, P. (2003). A guide to econometrics. Cambridge, Mass: MIT Press. Mackinlay, C.A. (1997). Event Studies in Economics and Finance. Journal of Economic Literature. 35 (1) 13-39. Markoff, J. (2005). What the Dormouse Said: How the 60s Counterculture Shaped the Personal Computer Industry. New York: Viking. Pagan, A. and Aman, U. (1999). Nonparametric Econometrics. Cambridge University Press. Paul A. S. and William D. N. (2004). Economics. 18th ed., McGraw-Hill, p. 5. Pearl, J. (2000). Causality: Model, Reasoning and Inference. Cambridge University Press. Pedace, R. (2013). "Building the Classical Linear Regression Model". Econometrics for Dummies. Hoboken, NJ: Wiley. pp. 58–104. Pindyck, R. S., and Daniel L. R. (1998). Econometric Methods and Economic Forecasts, McGraw-Hill. Robert F. G. (1999). What Do Economists Know? New Economics of Knowledge. Routledge. Russell, D and James G. M (2004). Econometric Theory and Methods. New York: Oxford University Press. Rust, J. (1987). "Optimal Replacement of GMC Bus Engines: An Empirical Model of Harold Zurcher". Econometrica 55 (5): 99– 33. Santos S, J.M.C. and Tenreyro, S.(2006), “The Log of Gravity,” The Review of Economics and Statistics, 88(4), pp. 41–58. Stephen T. Z. and Deirdre N. M. (2004). "Size Matters: The Standard Error of Regressions in the American Economic Review," Journal of Socio-economics, 33(5), pp. 52. Studenmund, A.H. (2011). Using Econometrics: A Practical Guide. Contents (chapter-preview). Swann, G. M. P. (2008). Putting Econometrics in Its Place: A New Direction in Applied Economics. Edward Elgar Publishing. Vassilis A. H. (2008). "Computational methods in econometrics," The New Palgrave Dictionary of Economics, 2nd Edition. Wooldridge, J. (2003). Introductory Econometrics: A Modern Approach. Mason: Thomson Southwestern. Read More
Cite this document
  • APA
  • MLA
  • CHICAGO
(“Econometrics Essay Example | Topics and Well Written Essays - 3750 words”, n.d.)
Econometrics Essay Example | Topics and Well Written Essays - 3750 words. Retrieved from https://studentshare.org/macro-microeconomics/1637972-econometrics
(Econometrics Essay Example | Topics and Well Written Essays - 3750 Words)
Econometrics Essay Example | Topics and Well Written Essays - 3750 Words. https://studentshare.org/macro-microeconomics/1637972-econometrics.
“Econometrics Essay Example | Topics and Well Written Essays - 3750 Words”, n.d. https://studentshare.org/macro-microeconomics/1637972-econometrics.
  • Cited: 0 times

CHECK THESE SAMPLES OF Effects of Steve Jobs Death on Apple Stock Return

How Apple will not survive after the death of Steve Jobs

This management style of steve jobs however is no longer emphasized in the present leadership of Apple.... It will not be an overstatement to say that steve jobs is Apple.... Without steve jobs, Apple will not survive the competition in the market of which Apple in the first place intensified.... Track record will speak why Apple will not survive without steve jobs.... First, there will be no Apple without steve jobs because he cofounded the company with Steve Wozniak in his parents' garage back in 1976....
5 Pages (1250 words) Research Paper

Steve Jobs

steve jobs, the co-founder and CEO of Apple is a prominent American business magnate who always surprises the world with his unusual leadership tactics and innovative ideas on product design.... teven Paul (steve jobs) was born in February 24, 1955 in San Francisco.... agazine (1989) (all about steve jobs).... steve jobs initiated computer revolution and introduced special effects in entertainment industries.... He altered the business field of computers by introducing a series of apple products....
5 Pages (1250 words) Term Paper

Strategic Uncertainties for Apple

The personal leadership style of steve jobs had much to be desired.... The largest strategic uncertainty for the company is the long-term effect of the untimely death of steve jobs.... steve jobs was exacting and uncompromising, a quality that made him difficult to work with, according to his subordinates and officers (Elliot and Simon, 2011, p.... steve jobs introduced a corporate philosophy of recognizable products and simplicity in design and use....
5 Pages (1250 words) PowerPoint Presentation

Investment and Portfolio Analysis of Apple Inc

The most common objective however is to maximize their return on investment.... The most common objective however is to maximize their return on investment.... The overall objective of this investment analysis is to long the asset at cheap (by identifying when the stock is undervalued) and then short it when it reaches the target price to make a profit.... The understandings of market sentiments are very important for technical analysts and day traders who try to maximize profits from stock price movement....
9 Pages (2250 words) Essay

Steve Jobs as an Entrepreneur and Technology Innovatory

Apple's president role was filed by John Sculley, a Pepsi-Cola marketing expert, after Steve Jobs convincing him of a chance to change the world, but would be the person behind the exit of steve jobs from Apple.... The head of Apple is the CEO currently held by Tim Cook after the departure and subsequent death of steve jobs in 2011.... The innovation secrets of steve jobs: insanely different: principles for breakthrough success.... Introducing iMac and installation of G3 PowerPC on apple computers on guidance of Jobs allowed Apple to be profitable six months later....
9 Pages (2250 words) Essay

Innovation - Steve Jobs & Apple Computer

This paper focuses on the examination of the role of steve jobs, a technology entrepreneur in the establishment and the development of Apple Computer; the significant role of steve jobs in the development of Apple can be identified by two facts.... .... ... ... The survival and development of firms in the modern market is a challenging task....
10 Pages (2500 words) Research Paper

Steve Jobs Entrepreneurial Skills

The paper "steve jobs' Entrepreneurial Skills" tells Jobs represented an entrepreneur in a number of ways as evidenced by the entrepreneurial skills and critical moments that marked his life.... steve jobs is an American entrepreneur who was born in California on February 24, 1955, to students Joanne Simpson and Jandali Abdulfattah resulting in him being given up for adoption by Paul and Clara Jobs.... steve jobs grew up in California attending Reed College but dropped out after six months since the fee was too much for his parents....
8 Pages (2000 words) Case Study

The Role of Globalization in Increasing Prosperity

The global developments of Apple started with the return of steve jobs in 1997.... However, under the leadership of steve jobs, the company has gone from $3 billion at the start of 1997 to $350 billion in the present time, making Apple the second most valuable company in the world.... In the second return of steve jobs in 1997, the ad agency prepared a campaign 'Think Different'.... If one wants to measure the gap between the theory and the globalization which are confronted by the companies, there should be examined the effects of the increasing interconnection of production processes....
6 Pages (1500 words) Case Study
sponsored ads
We use cookies to create the best experience for you. Keep on browsing if you are OK with that, or find out how to manage cookies.
Contact Us