StudentShare
Contact Us
Sign In / Sign Up for FREE
Search
Go to advanced search...
Free

Analysis of Employment Data - Report Example

Cite this document
Summary
The paper "Analysis of Employment Data" presents and analyses the employment data through different periods. The first part shows the evolution of the variables displayed on Fig. 1 Employment by Sector in the UK, 1946-86’ for the period of 1987 to 2008…
Download full paper File format: .doc, available for editing
GRAB THE BEST PAPER94.3% of users find it useful
Analysis of Employment Data
Read Text Preview

Extract of sample "Analysis of Employment Data"

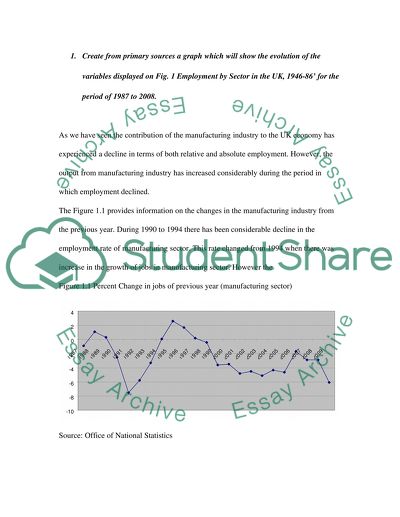
Presentation and Analysis of Employment Data Faculty Create from primary sources a graph which will show the evolution of the variables displayed on Fig. 1 Employment by Sector in the UK, 1946-86’ for the period of 1987 to 2008. 2. Create from primary sources a table showing the annual time series of the variables shown on Table 3: Part-time work in the UK 1983- 1998 for the period 1998 to 2008. Comment briefly on the possible reasons for any discrepancies between figures you have obtained and the figures shown on Table 3. 3. Create from primary sources a table showing the annual time series o the variables shown on Table 2: ‘Women in the UK Labour force as a Percentage of Women of Working age (15-64), 1955-1995’ to cover period 1995 to 2008. 1. Create from primary sources a graph which will show the evolution of the variables displayed on Fig. 1 Employment by Sector in the UK, 1946-86’ for the period of 1987 to 2008. As we have seen the contribution of the manufacturing industry to the UK economy has experienced a decline in terms of both relative and absolute employment. However, the output from manufacturing industry has increased considerably during the period in which employment declined. The Figure 1.1 provides information on the changes in the manufacturing industry from the previous year. During 1990 to 1994 there has been considerable decline in the employment rate of manufacturing sector. This rate changed from 1994 when there was increase in the growth of jobs in manufacturing sector. However the Figure 1.1 Percent Change in jobs of previous year (manufacturing sector) Source: Office of National Statistics This is clear from the Figure 1.2 that manufacturing job has declined from 4870 thousands in 1987 to 2867 thousands in the year by 2008. There has been a cyclic movement of the incline and decline of the jobs in manufacturing sector. In 1994 the employment in manufacturing sector was 4074 thousand that increased steadily till 1998 when it reached to 4295 thousands job and than it has started declining. Figure 1.2 Workforce jobs in Manufacturing Industry (000) Figure 1.3 (public sector employment) shows the change in output of UK manufacturing industry since 1999. It is indexed relative to the output in 2005. This means that the output in 2005 was given the value 5900. The output in 2005 was given the value 5250. It means this graph shows year –on – year growths 1999 to 2005. After year 2005, there was slowdown for three consecutive years (2006 to 2008) and finally a rapid spurt. The output sharp rise during the years 2008 to 2009. In total there are now more than 6 million people employed in the public sector compared to about 5.2 million. It means 16 per cent output increase in ten years previously. Figure 1.3: UK Public sector employment headcount (1999-2009) Figure 1.4 shows the details of the actual annual changes in employment that have taken place in the public sector over the past 10 years. It shows that growth was fairly consistent on annual basis in 2000 to 2005. It means approximately 100,000 employment increased in public sector per year. Before a period of slight decline mainly due to a contraction in employment in central government before a sharp rise in employment in 2008 to 2009 . It means approximately 293,000 employees worked in public sector as a result of the large-scale reclassification .The most common reason for the increase in productivity is the removing of the banks from estimated public sector employment. Figure 1.4 Figure 1.5 shows clearly an upward trend in employment. 12 per cent employment increased during the years 1999 to 2009. When the major financial institutions classified to the public sector are removed for analyses purposes. Public sector employment peaked in 2005 in contrast to 2009 when they are included. If the bank had not been reclassified then public sector employment in the UK would not have passed 6 million. Finely In the last year public sector employment has continued to grow (293,000; 5.1 percent) whereas private sector employment has declined (-934,000; -3.9 percent). This has largely been driven a decrease in total employment for the United Kingdom. Figure 1.5 This is evident from the graph below that the employment in the manufacturing sector has decreased considerably after 1979. There was some change during the period of 1987 to 1989 when the growth was registered. However the overall jobs in the employment sector has decreased from 1987 to 2007. However the output of the manufacturing sector has been increasing considerably. This can be due to advent of new technologies and processes the output in terms of employment has increased. The years before the recent recession, 2004-2007 has been highly productive for the manufacturing sector in terms of output, however the jobs in the manufacturing sector has declined considerably from more than 4,000,000 jobs to nearly 3,500,000 jobs. Figure 1.6: Manufacturing employment and productivity (Source: PriceWaterhouse Cooper, 2010) From 1997 onwards the number of jobs in the manufacturing sector has steadily declined whereas the overall output has increased. 2. Create from primary sources a table showing the annual time series of the variables shown on Table 3: Part-time work in the UK 1983- 1998 for the period 1998 to 2008. Comment briefly on the possible reasons for any discrepancies between figures you have obtained and the figures shown on Table 3. The two figures 2.1 and 2.1 are showing two trends. Figure 2.1 is shows part-time as a percentage of all employment and second table show women as a percentage all of part time worker. Figure 2.2 is the decreasing participation of women in the labour force. Figure 2.1 is the increase (during years 2003 to 2004) in the relative importance of part time employment that has risen from 26% in 2003 and 2004. The proportion of women in the part time labour force does not declined in this period. Women have not constituted the overwhelming majority of part time workers throughout this period. Their proportion has declined from just 81% in 1998 and 76% in 2008. This means that the rate of growth of part time employment amongst men was greater than that amongst women. Figure 2.1: Part Time Employment (All) The percentage of women part-timers has gone down significantly from 81% of 1998 to 76% in 2008. There are various reasons for the same. The overall share of the aging women population is increasing. There are possibilities that woman are finding and looking for more permanent jobs than the part time. Economic fluctuations can also be one of the reasons. As the market has been developed there are lesser number of jobs created in the market place than earlier. This resulted in lessening demand of the workforce and creating competition in the job market. Figure 2.2: Part time Employment (Women only) The comparison of the two data indicate that the change in the share of part time job in overall employment sector has not changed significantly but the percentage of women as part-time workers has declined considerably. Table 2.1: Part –time work in UK (1998-2008) As per the official data, women also represent the at the higher side of economically inactive workforce. The reason for this is domestic responsibilities are still primary responsibility of women which includes child nurturing and care. There have been changes in the population trend from the past. The growing workforce is posing threat for meeting workforce requirements of the future to the government. 3. Create from primary sources a table showing the annual time series o the variables shown on Table 2: ‘Women in the UK Labour force as a Percentage of Women of Working age (15-64), 1955-1995’ to cover period 1995 to 2008. In the figure 3.2 the employment, unemployment and economically inactive population (couples) has been shown (January-December 2008, not seasonally adjusted). This data indicates that the women are more economically inactive than men and the men are more employed. Figure 3.1: Employment and Unemployment Gender based (2008) This is clear from the Figure 3.2 that there have been changes of the female employment rate from 1995 to 2007. The overall employment rate was more than sixty five percent and grew steadily from 1995 to 2001 to 70% of the total employment rate. However from 2001 to 2007 the growth was stagnant with 70% of employment rate and started declining after the 2007. The number of older female workers has also grew in this period of 1995 to 2003 significantly. There was almost more than ten percent of growth in the percent employment rate of the female older workers. This figure is still growing steadily. There are various reasons of the growing rate of female older workers. Figure 3.2 Employment rate This is important to remember that the baby boomers’ population was strong segment of the workforce and this group is aging. This is also the reason of growing number of female older workers. There is growth in the overall percent of the women workers, however the growth is not as high as it was during the period of 1955 to 1995. The percentage of woman of working age (15-64) has grown from 45.9% to 66.6% in the span of 1955 to 1995. The same has been 70% in 2007 from 60% in 1995. This can be inferred that growth rate of the percentage employment of women in workforce has decreased. There have been various other factors like transition of economy from agriculture to manufacturing and manufacturing to service based in these two periods. Reference: The future of UK manufacturing: Reports of its death are greatly exaggerated Observations, analysis and recommendations – April 2009 available at Workforce jobs by Industry : United Kingdom: Thousands: Seasonally adjusted available at http://www.pwc.co.uk/pdf/UKmanufacturing_300309.pdf [accessed on 12 August 2010] http://www.statistics.gov.uk/StatBase/tsdataset.asp?vlnk=495&More=Y[accessed on 12 August 2010] http://www.statistics.gov.uk/statbase/Product.asp?vlnk=1537 [accessed on 12 August 2010] http://www.statistics.gov.uk/elmr/07_10/downloads/ELMR_Jul10_Matthews.pdf [accessed on 12 August 2010] http://www.statistics.gov.uk[accessed on 12 August 2010] http://www.esds.ac.uk[accessed on 12 August 2010] Read More
Cite this document
  • APA
  • MLA
  • CHICAGO
(Analysis of Employment Data Report Example | Topics and Well Written Essays - 1500 words, n.d.)
Analysis of Employment Data Report Example | Topics and Well Written Essays - 1500 words. https://studentshare.org/macro-microeconomics/1569240-presenting-and-analyzing-employment-data
(Analysis of Employment Data Report Example | Topics and Well Written Essays - 1500 Words)
Analysis of Employment Data Report Example | Topics and Well Written Essays - 1500 Words. https://studentshare.org/macro-microeconomics/1569240-presenting-and-analyzing-employment-data.
“Analysis of Employment Data Report Example | Topics and Well Written Essays - 1500 Words”. https://studentshare.org/macro-microeconomics/1569240-presenting-and-analyzing-employment-data.
  • Cited: 0 times

CHECK THESE SAMPLES OF Analysis of Employment Data

Chicano Employment: Journal Review

In addition, the research analyzed the data of those people in one or more weeks of employment (Waldiinger et al, 2007).... Chicano Employment: Journal Review Name Institution Chicano Employment: Journal Review Methods of data Collection in the Research data This survey in Journal of Ethnic and Migration Studies used data from secondary data from the March demographic files of Current Population Survey (CPS)....
5 Pages (1250 words) Book Report/Review

Job Search Data Analysis

data Analysis data Collection The data used for this study is drawn from two sets of data: Jobseekers Allowance claimants and Unemployed persons.... Although the file downloaded contains datasets for the whole of England and Wales, this research will only extract data for the 32 cities of London.... hellip; data for unemployed persons was obtained from the Annual Population Survey (APS).... The number of jobseekers is derived from the Work and Pensions Longitudinal Study (WPLS), which also contains data on jobseekers allowance claimants....
6 Pages (1500 words) Coursework

EMPLOYMENT COMMUNICATION

Volunteering in your related field of study provides important connections that may be important in reaching the goal of employment.... My recent collaboration on the massive marketing assignment at Training Resources and Research Group, National Bureau of Statistics (NBS) and MEMATECH Solutions Limited required my expertise and proficiency in exceptional aptitude for marketing, ability to analyze and design data, leadership and strategic planning.... He has also expertise in Statistical and Analysis programs including SPSS and use of Access and Excel in data cleaning....
3 Pages (750 words) Coursework

Factors Influencing the Increase in Temporary Employment

In recent times, the traditional model of long term permanent full-time employment in a single organization is continuously and increasingly being replaced with new forms of employment arrangements, not just of a less permanent nature, but with fewer restrictions and conditions.... hellip; These forms of work arrangement are generally categorized as 'temporary employment (Hardy and Walker, 2003 p.... 73). Temporary employees typically work for firms for a brief and often short period of time, ranging from a few days to a couple of months, in sharp contrast with permanent, full-time employment arrangements....
17 Pages (4250 words) Essay

Economic Indicators Paper

A typical business cycle contains fluctuations and incorporates booms (rapid expansions) and recessions (period of stagnation or a… Business cycle fluctuations are often explained against the model of Keynesian economy where the economy or an industry reaches short term equilibrium in a state of less than or above full employment status.... (Sullivan and Sheffrin, 2003) When an economy or a industry forms at a level below full employment then monetary and fiscal policy renders a positive impact by increasing employment rather than simply causing inflation or directing the resources towards inefficient use in order to create jobs....
5 Pages (1250 words) Essay

The Economic and Social Costs of Unemployment

According to data from the Bureau of Economic Analysis (BEA), personal income fell 0.... The data bodes ill for the largest US state, which collects nearly half of its state revenues from income taxes, one of the highest proportions in the nation.... ome analysts tried to find a silver lining in the latest spate of dismal economic data, latching on to a Labor Department report that found that the total number of unemployed workers collecting benefits fell last week for the first time since January, by 148,000....
12 Pages (3000 words) Essay

Survey of the IT Employment Market

… @2010SURVEY OF THE IT EMPLOYMENT MARKET AND analysis of THE EMPLOYMENT MARKETPART BAnalysis of IT job advertisements.... om, Operations – SydneyPosition @2010SURVEY OF THE IT EMPLOYMENT MARKET AND analysis of THE EMPLOYMENT MARKETPART BAnalysis of IT job advertisements.... om enables the connection of server farms that are available in data centers to the Internet and also connect the servers to each other....
7 Pages (1750 words) Assignment

IT Employment Market

The main responsibility upon employment however will be to assist the company in relocation to Kent where systems will be set up and installation done.... … COMPANY: InformatiqSource: Retrieved from Totaljobs online agency accessed from http://www.... otaljobs.... om/JobSeeking/3rd-Line-IT-Support-Engineer---MCSE--Cisco_job51342352 DetailsThird Line Infrastructure Support Engineer will be expected to perform COMPANY: InformatiqSource: Retrieved from Totaljobs online agency accessed from http://www....
8 Pages (2000 words) Assignment
sponsored ads
We use cookies to create the best experience for you. Keep on browsing if you are OK with that, or find out how to manage cookies.
Contact Us