StudentShare
Contact Us
Sign In / Sign Up for FREE
Search
Go to advanced search...
Free

The comparison of the Macroeconomic State of Bahrain and Saudi Arabia for the years 2005 and 2011 - Essay Example

Cite this document
Summary
This paper offers the thorough comparison of the macroeconomic state of Bahrain and Saudi Arabia for years 2005 and 2011. The report is based on the analysis of GDP composition for both countries, their service sector performance, volumes of export and import operations, Per Capita GDP indicator…
Download full paper File format: .doc, available for editing
GRAB THE BEST PAPER97.5% of users find it useful
The comparison of the Macroeconomic State of Bahrain and Saudi Arabia for the years 2005 and 2011
Read Text Preview

Extract of sample "The comparison of the Macroeconomic State of Bahrain and Saudi Arabia for the years 2005 and 2011"

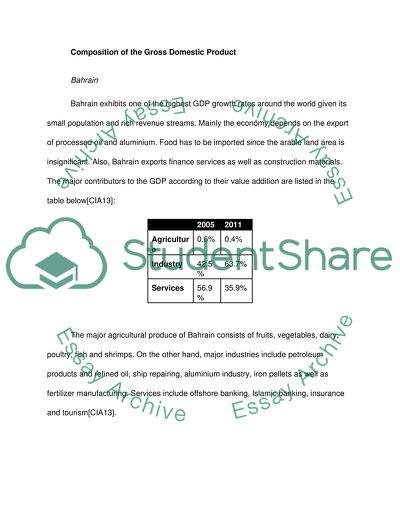
number Publish Comparison of the Macroeconomic of Bahrain and Saudi Arabia (2005 and 2011) Introduction Bahrain is located just above the Qatar peninsula in the western reaches of the Persian Gulf. The nation consists of 33 different islands of which Bahrain Island is the largest. To the west lies Saudi Arabia while to the north east lies Iran. The total area of Bahrain is some 765.3 square kilometres making it the 187th largest country in the world. The Gross Domestic Product (GDP) of Bahrain was 13.46 billion USD in 2005 that nearly doubled in size to 26.11 billion USD by 2011 (IMF, GDP). On the other hand, Saudi Arabia’s GDP was 315.76 billion USD in 2005 which increased to 577.6 billion USD in 2011 showing an increase of more than 80% for this period (IMF, GDP). In a similar manner, the population of Bahrain was 0.734 million people in 2005 that grew to 1.13 million people in 2011. In contrast, the population of Saudi Arabia was 23.12 million people in 2005 which grew to 28.17 million people in 2011 (IMF, GDP). By comparison, Bahrain is much smaller than Saudi Arabia in terms of area, population and GDP size. Consequently, Bahrain’s economy and Saudi Arabia’s economies differ in their overall structure and composition too. This report seeks to compare both economies on a macroeconomic scale and to identify recent trends by performing comparisons for the years 2005 and 2011. Composition of the Gross Domestic Product Bahrain Bahrain exhibits one of the highest GDP growth rates around the world given its small population and rich revenue streams. Mainly the economy depends on the export of processed oil and aluminium. Food has to be imported since the arable land area is insignificant. Also, Bahrain exports finance services as well as construction materials. The major contributors to the GDP according to their value addition are listed in the table below (CIA, Bahrain): 2005 2011 Agriculture 0.6% 0.4% Industry 42.5% 63.7% Services 56.9% 35.9% The major agricultural produce of Bahrain consists of fruits, vegetables, dairy, poultry, fish and shrimps. On the other hand, major industries include petroleum products and refined oil, ship repairing, aluminium industry, iron pellets as well as fertilizer manufacturing. Services include offshore banking, Islamic banking, insurance and tourism (CIA, Bahrain). Saudi Arabia Saudi Arabia hosts one of the world’s largest oil and gas reserves with estimates ranging up to one fifth of all proven reserves on earth (EIA). The economy of Saudi Arabia depends in large part on oil processing and exports as well as goods derived from crude oil. Diversification is in the air but has yet to yield economically significant results. The major contributors to the GDP according to their value addition are listed in the table below (CIA, Saudi Arabia): 2005 2011 Agriculture 3.3% 2.1% Industry 74.7% 67.6% Services 21.9% 30.4% The major agricultural products of Saudi Arabia are wheat, dates, citrus fruits, barley, melons, dairy and poultry. The major industries in Saudi Arabia are crude oil production, oil refining, petrochemical industries such as fertilizers, ammonia production, caustic soda production, plastics, metal processing, aircraft and ship repair, construction etc. Comparison Bahrain’s GDP is markedly smaller than that of Saudi Arabia given the geographical size of both nations and the amount of oil and gas reserves. Saudi Arabia’s GDP displays more of agricultural input compared to Bahrain while it has a larger industrial sector. In comparison, Bahrain has a larger service sector when compared to Saudi Arabia. Services Bahrain’s service sector is composed primarily of financial organisations such as off shore banks, Islamic banks, insurance companies and the like. Oil production has supported the growth of such financial service sectors that link Bahrain to the rest of the region financially. In addition, Bahrain’s service sector displays public utility companies, telecommunications firms, internet services and the like. The overall contribution of the service sector to Bahrain’s economy is estimated to be between 30% and 35% including financial and government services (Global Investment House). There has been an overwhelming drive for privatisation of state owned agencies such as utility companies and telecommunication infrastructure which has been endorsed by the royal family. In contrast, Saudi Arabia’s service sector is bifurcated between financial services, transport and communication services, government services and utility companies. Saudi Arabia has greater freedom in the service sector compared to Bahrain so governmental support in the services sector is more limited compared to Bahrain. Even so, governmental services constitute some 5.1% of the GDP while utility provision accounts for only 0.8%. Financial services hover collectively at some 4.5% while wholesale trade is around 4% of the GDP (MOF Saudi Arabia). Exports Bahrain Processed and refined oil are the biggest export products of Bahrain followed by aluminium. The major export commodities and their shares are listed below (MOF Bahrain): Exports 2005 2011 Animal Produce 0.25% - Vegetable Products 0.05% - Animal and Vegetable Fats 0.00% - Prepared Foodstuffs 0.38% - Mineral Products 93.52% - Chemical and Allied Products 3.09% - Plastics 0.64% - Leather Goods 0.02% - Wood Goods 0.01% - Wood Pulp and Paper 0.46% - Textiles 1.59% - Data for Bahrain’s exports as per commodities is not available beyond 2007 as per the Ministry of Finance, Bahrain (MOF Bahrain). Saudi Arabia Saudi Arabia’s exports are centred largely on oil exports and allied exports from petrochemical industries. The major export commodities and their shares are listed below (MOF Saudi Arabia): Exports 2005 2011 Animals & Animal Products 0.30% 0.40% Vegetables & Vegetable Products 0.09% 0.11% Fats & Oils 0.03% 0.09% Prepared Foods, Tobacco Products 0.28% 0.38% Mineral Products 89.55% 87.17% Chemical Products 3.61% 4.53% Plastics & Rubber 2.66% 3.99% Leather Products 0.05% 0.04% Wood Products 0.02% 0.01% Paper Products 0.26% 0.32% Textiles & Textile Products 0.23% 0.18% Clothing Accessories 0.01% 0.00% Stone & Glass Products 0.16% 0.13% Precious Metals, Jewelry 0.15% 0.28% Base Metals 0.85% 0.71% Machinery & Electrical Equipment 0.72% 0.78% Transportation Equipment 0.91% 0.74% Miscellaneous Instruments 0.04% 0.05% Arms & Ammunition 0.00% 0.01% Miscellaneous Manufactured Items 0.07% 0.06% Art Items and Others 0.00% 0.01% Comparison For both Bahrain and Saudi Arabia, the major export item is essentially mineral products (crude oil, refined and processed oil etc.) contributing to around 90% of all exports for both nations. In addition, it is noticeable that the next largest export for both nations is chemical products (that are derived from crude oil and its derivates) that account for roughly 3% of Bahrain’s exports and around 4% of Saudi Arabia’s exports. In addition, Saudi Arabia exports plastics and rubbers derived from crude oil that make up some 2.5% to 3% of its total exports. All other export items from both nations are insignificant when compared to the export items mentioned above lending credence to the belief that the export perspectives of both economies is highly oil dependant. Imports Bahrain Bahrain depends on large food imports to support its population as food stuffs are not indigenously grown on large scales. The largest expenditure of imports is for mineral products used for oil extraction, processing and other allied processes. This is followed by machinery, transport equipment and chemical and allied products as shown below (MOF Bahrain): Imports 2005 2011 Animal Produce 2.15% - Vegetable Products 1.61% - Animal and Vegetable Fats 0.21% - Prepared Foodstuffs 3.00% - Mineral Products 49.35% - Chemical and Allied Products 7.54% - Plastics 1.74% - Leather Goods 0.13% - Wood Goods 0.60% - Wood Pulp and Paper 0.98% - Textiles 2.50% - Footwear and Headgear 0.17% - Stone Articles 1.33% - Pearls 0.42% - Base Metals 6.22% - Machinery 11.40% - Transport Equipment 8.40% - Optical Equipment 1.00% - Miscellaneous Goods 1.23% - Art 0.00% - Saudi Arabia Saudi Arabia depends on food imports as little countryside is available for agriculture. Nearly all of the major food items are imported for consumption. Moreover, Saudi Arabia’s largest import head is machinery followed by transportation equipment which is tailed by base metals and chemical products (MOF Saudi Arabia). Imports 2005 2011 Animals & Animal Products 4.76% 4.09% Vegetables & Vegetable Products 5.06% 5.68% Fats & Oils 0.63% 0.85% Prepared Foods, Tobacco Products 4.33% 4.58% Mineral Products 1.55% 1.87% Chemical Products 8.17% 8.50% Plastics & Rubber 3.78% 3.77% Leather Products 0.26% 0.30% Wood Products 0.87% 1.03% Paper Products 1.84% 1.50% Textiles & Textile Products 4.33% 3.43% Clothing Accessories 0.57% 0.47% Stone & Glass Products 1.60% 1.37% Precious Metals, Jewelry 1.60% 1.87% Base Metals 10.66% 13.42% Machinery & Electrical Equipment 24.29% 26.75% Transportation Equipment 20.94% 15.63% Miscellaneous Instruments 2.56% 2.33% Arms & Ammunition 0.55% 0.70% Miscellaneous Manufactured Items 1.64% 1.83% Art Items and Others 0.01% 0.02% Comparison In terms of the import structure, Bahrain and Saudi Arabia are well differentiated since Bahrain imports crude oil in order to refine and process it unlike Saudi Arabia. This tends to make Bahrain’s imports skewed towards mineral products unlike Saudi Arabia whose major import items are machinery and transportation equipment. Moreover, both nations import food items that they need to consume due to a lack of arable agricultural land for raising crops and livestock. Per Capita GDP The GDP per capita of Bahrain and Saudi Arabia are amongst the highest in the world. Comparisons of the GDP per capita reveal that Bahrain has only been able to increase by between 20% and 25% between 2005 and 2011. On the other hand, Saudi Arabia’s GDP per capita has grown by roughly 50% between 2005 and 2011 although it still falls short of Bahrain’s numerical GDP per capita (IMF, GDP per capita incomes). Unrest in Bahrain following the Arab Spring has led to distracted investors and an insecure investment climate that has slowed Bahrain’s growth compared to Saudi Arabia. However, the higher numerical GDP per capita reveals that Bahrain has more resources to spend on its people when compared to Saudi Arabia. In addition, the recent increase in GDP per capita in Bahrain and Saudi Arabia is in stark contrast to the world where GDP per capita has shrunk due to the global economic crisis. Bahrain and Saudi Arabia’s growth in large part can be attributed to rising oil prices. Country 2005* 2011* Bahrain 18,322.67 23,410.01 Saudi Arabia 13,657.95 19,890.18 * All figures in current prices (USD). Conclusion In terms of the larger picture, Bahrain shows greater GDP per capita compared to Saudi Arabia though its macroeconomic structure is more heavily government owned, regulated and controlled. In contrast, Saudi Arabia may display a smaller GDP per capita compared to Bahrain but it also displays greater fiscal autonomy provided especially to the services sector. The output of oil and gas is decreasing in both Bahrain and Saudi Arabia which means that both nations need to prepare for a service based economy in the future. Based on the evidence presented above, it could be surmised that Bahrain needs more preparation in order to come to terms with Saudi Arabia’s level of macroeconomic development. The slowdown of GDP growth in Bahrain in recent years is ample proof that Bahrain would require large macroeconomic reforms such as privatisation in order to maintain its lead on the GDP per capita. Works Cited CIA. Bahrain. 13 March 2013. 13 March 2013 . —. Saudi Arabia. 21 February 2013. 13 March 2013 . EIA. Saudi Arabia. 26 February 2013. 13 March 2013 . Global Investment House. “Bahrain Economic and Strategic Outlook.” Investment Advice. 2009. IMF. GDP. 13 March 2013. 13 March 2013 . —. GDP per capita incomes. 13 March 2013. 13 March 2013 . MOF Bahrain. Total exports classified by sectioned commodities. 2009. 13 March 2013 . —. Total imports classified by section of commodities. 2009. 13 March 2013 . MOF Saudi Arabia. Statistical Tables. 2013. 13 March 2013 . Read More
Tags
Cite this document
  • APA
  • MLA
  • CHICAGO
(“The comparison of the Macroeconomic State of Bahrain and Saudi Arabia Essay”, n.d.)
Retrieved from https://studentshare.org/macro-microeconomics/1470683-the-comparison-of-the-macroeconomic-state-of-bahrain-and-saudi-arabia-for-the-years-2005-and-2011
(The Comparison of the Macroeconomic State of Bahrain and Saudi Arabia Essay)
https://studentshare.org/macro-microeconomics/1470683-the-comparison-of-the-macroeconomic-state-of-bahrain-and-saudi-arabia-for-the-years-2005-and-2011.
“The Comparison of the Macroeconomic State of Bahrain and Saudi Arabia Essay”, n.d. https://studentshare.org/macro-microeconomics/1470683-the-comparison-of-the-macroeconomic-state-of-bahrain-and-saudi-arabia-for-the-years-2005-and-2011.
  • Cited: 0 times

CHECK THESE SAMPLES OF The comparison of the Macroeconomic State of Bahrain and Saudi Arabia for the years 2005 and 2011

Risks in the Oil Industry

The following research examines the risks affiliated with firms in the oil industry.... nbsp;Risks are assessed with correspondence to the shift that occurs in oil prices and it's magnitude on the oil industry.... nbsp;Within this context of investigation, background information is supplied.... nbsp;… The information considers the elements of the petroleum industry....
40 Pages (10000 words) Dissertation

Financial Market Integration and Macroeconomic Volatility

b) States/countries that have small indigenous populations and huge mineral resources and they need to import manpower, such as This group of countries comprises the Gulf Cooperation Council (GCC) members (Bahrain, Kuwait, Oman, Qatar, saudi arabia, and the United Arab Emirates) and Libya.... The UAE, bahrain and Kuwait, all signed since 1998.... MENA states have increased their participation in the WTO, and during the last ten years, the area has witnessed an increase in bilateral between the Arab States in the region....
10 Pages (2500 words) Case Study

The Short and Long Term Impact of Irans Revolution

The state developmental policies led to the uncontrollable inflation7.... This paper ''The Short and Long-Term Impact of Iran's Revolution'' tells us that  Few of the events of the late twentieth century were so unexpected and had a greater influence on the political situation in the region and the world at large than the Iranian Revolution of 1979....
9 Pages (2250 words) Essay

Global Financial Crises & the Gulf Cooperation Council

Project Objectives: To present a brief reasoning behind the Global Financial Crises 2007-2009 To assess the difference between the impact of the Global Financial Crises on the western markets and in the GCC Countries To determine reasons why the financial markets in Qatar and other GCC countries responded to the crises differently To assess whether Islamic financing investments have a contribution to the lesser risk exposure of the gulf markets To draw conclusions on whether there are possibilities for western markets to open up avenues of introducing alternative financial instruments following the impact of the GFC Literature Review: We intend on looking up related literature in order to analyze the impact of the GFC on the middle-eastern financial markets, to devise a conclusive analysis on what factors were responsible for the relevant markets to react differently than most of the West, and to formulate deductive reasoning on whether an alternative form of financial instruments might prove to be a securer investment on the macroeconomic level....
14 Pages (3500 words) Research Paper

Central Bank for GCC

According to Sturm and Siegfried (2005, p.... International financial crisis in the recent years calls for monetary integration and regional cooperation of the countries for efficiently dealing with the crises and protecting the interests of the member countries.... Structure of the suggested Central Bank for GCC Monetary union in GCC can stimulate uniformity in macroeconomic policies within the union and inter alia improve investment options and allocation of resources within the region....
5 Pages (1250 words) Research Paper

Financial Sector in GCC Countries

The budgetary surplus has risen to 40 per cent of GDP in 2005 and is projected to be in the rate of 43 per cent of GDP in 2006.... "The six member states include the Kingdom of Bahrain, State of Kuwait, Sultanate of Oman, State of Qatar, Kingdom of saudi arabia and the United Arab Emirates.... The government is assessing the structure that polices commercial banking sector of bahrain in line with the above objectives.... With the aim of achieving goals for greater economic integration, member states agreed in 1999 to set external tariffs to a common range by 2005....
15 Pages (3750 words) Essay

Marketing research report

Effects or outcome as a result of terrorism, especially on the hotel and tourism industry, are brought up and scanned from books, periodicals, the internet and other reading materials.... The primary causes of terrorism, religious and ideological are discussed a bit, but it is not for this paper to judge the real objectives of terrorists as we may go into deeper examination, and we may bring to light some religious issues which can not be covered here....
20 Pages (5000 words) Essay

Impact of Macroeconomics on Consumption, Savings, Investments and Business Cycles

The nation borders saudi arabia and Oman and share its sea borders with Iraq, Iran, Kuwait, Qatar, and Bahrain.... The GDP of UAE ranks second after saudi arabia in the CCASG (Arnold, 2010).... Nominal GDP rose by thirty five percent in the year 2006 to about 175 as compared to $130 billion in the year 2005.... The production of oil in UAE is anticipated to last for about 93 years with an average daily production of 2.... macroeconomic concepts in the UAE are not very different from other countries which are rich in oil reserves....
6 Pages (1500 words) Essay
sponsored ads
We use cookies to create the best experience for you. Keep on browsing if you are OK with that, or find out how to manage cookies.
Contact Us