StudentShare
Contact Us
Sign In / Sign Up for FREE
Search
Go to advanced search...
Free

Basic Economics and the Key Economic Concept of Scarcity - Essay Example

Cite this document
Summary
This essay "Basic Economics and the Key Economic Concept of Scarcity" is about that limited and finite resources, with alternative uses, have to be allocated to satisfy unlimited human wants. Scarcity requires us to choose and when a choice is made, some alternative is given up…
Download free paper File format: .doc, available for editing
GRAB THE BEST PAPER97.3% of users find it useful
Basic Economics and the Key Economic Concept of Scarcity
Read Text Preview

Extract of sample "Basic Economics and the Key Economic Concept of Scarcity"

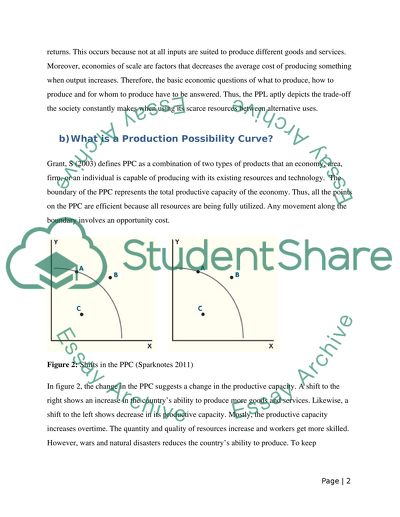
?Assignment a) The concept of opportunity cost The key economic concept of scar means that limited and finite resources, with alternative uses,have to be allocated to satisfy unlimited human wants. Scarcity requires us to choose and when a choice is made, some alternative is given up. This is the opportunity cost of the decision, thus opportunity cost can be defined as the next best alternative given up. Therefore, opportunity cost is the value of something that is foregone to achieve something else. The concept of opportunity cost can be graphically shown by the production possibility curve. Figure 1: Production Possibility Curve (Investopedia 2011) The PPC simply shows the different combinations of goods that an economy can produce using all available resources and a given level of technology. Any movement along the boundary involves an opportunity cost for e.g. if the economy was producing at C and decided its production to move to A, its production of wine would increase but the opportunity cost would be the production of cotton given up. A PPC is drawn as concave to the origin in diagrams. The reason behind this is because the extra output resulting from apportioning more resources to one particular good may fall, Riley, G (2006). As more resources are consumed in producing good X, the extra output decreases and more of good Y has to be given up. This is known as diminishing returns. This occurs because not at all inputs are suited to produce different goods and services. Moreover, economies of scale are factors that decreases the average cost of producing something when output increases. Therefore, the basic economic questions of what to produce, how to produce and for whom to produce have to be answered. Thus, the PPL aptly depicts the trade-off the society constantly makes when using its scarce resources between alternative uses. b) What is a Production Possibility Curve? Grant, S (2003) defines PPC as a combination of two types of products that an economy, area, firm, or an individual is capable of producing with its existing resources and technology. The boundary of the PPC represents the total productive capacity of the economy. Thus, all the points on the PPC are efficient because all resources are being fully utilized. Any movement along the boundary involves an opportunity cost. Figure 2: Shifts in the PPC (Sparknotes 2011) In figure 2, the change in the PPC suggests a change in the productive capacity. A shift to the right shows an increase in the country’s ability to produce more goods and services. Likewise, a shift to the left shows decrease in its productive capacity. Mostly, the productive capacity increases overtime. The quantity and quality of resources increase and workers get more skilled. However, wars and natural disasters reduces the country’s ability to produce. To keep developing, it is important for an economy’s PPC to continue to shift to the right, Grant, S (2003).  (i) When a country is operating at a point on the curve With reference to figure 1, points A, B and C are productively efficient. They represent the total productive capacity of the economy and are efficient because all resources are fully utilized and there is full employment. Points on the both the axes are unrealistic because due to scarcity of resources and opportunity costs, an economy needs to decide on a point on the curve to distribute resources between both the goods. (i) When a country is operating outside or to the right of the curve Any point outside the boundary such as point Y in figure 1, suggests that it is in unattainable at present but may become possible in future with improvement in technology, labour skills etc. This can also be made possible through trade surpluses from international trade. For example, if another county produces a good efficiently than your country and you produce another good efficiently than the country, international trade will help exchange goods and benefit both the countries by earning profit. (ii) When a country is operating inside or to the left of the curve Any point inside the boundary of the curve such as point X in figure 1 suggests an under utilization of resources and is inefficient. An economy is wasting existing resources and will not operate at this point. Such a situation occurs when there is unemployment, lack of technology and when people are not trained or skilled. c) Factors that will influence price decisions as a seller The ability to manipulate price depends on several factors. The decision to increase or decrease prices will firstly depend on the type of product, competition and buyers for it. The demand for goods for instance ladies clothing will be determined and prices will be changed accordingly. If there is already a great number of existing demand, prices can be increased. However, this could decrease long term demand as consumers would go to other competitors as competition in clothing is quite intense. However, increasing the price of branded clothes might increase its brand image and long term customer equity as well. There is a lot of uncertainty in price fluctuations but depends on the already established consumer perception and strength of market share. The law of demand states an inverse relationship between the price of good and the quantity demanded by the good. When the price increases, less of the quantity is demanded by the consumer, CliffsNotes (2000-2011) The proportion of income spent on a good will also determine its demand. If an item like a pencil or an erasers price increases, its demand wont decrease to a great extent because it already. Complements are goods consumed in somewhat the same proportion. If good x is a shoe lace, good y might be a pair of shoes. When two goods are complements, then as the price of the complementary good y increases, the demand for good x decreases. On the other hand, goods that take the place of another are substitute goods. Common examples include margarine and butter, tea and coffee etc. Increasing the price of necessity goods like a watch, laptop etc might decrease the demand for it. However, some buyers will always be there and the already established brand image plays a big role for instance in the case of Apple, its expensive products are highly in demand due to the image and quality. On the other hand, increases in the price of bread and butter (necessities) wouldn’t make much of a difference in demand because everyone will still purchase it. In economics, price elasticity of demand measures the responsiveness of demand for a product to a change in its price. Demand for products is elastic when a given percentage change in price causes a greater percentage change in demand. In this case, the PED is greater than 1 and less than infinity. When a given change in price causes a smaller percentage in demand, the product has an inelastic demand. In this case, the PED is greater than 0 and less than 1. Therefore, when demand is price elastic, sellers would decrease the price and when demand is inelastic, sellers would increase price. However, demand may fall in the long term but higher profits will be enjoyed. References CliffsNotes (2000-2011) Wiley Publishing, Inc., Available: http://www.cliffsnotes.com/study_guide/Demand.topicArticleId-9789,articleId-9728.html. Last accessed: 10th July, 2011 Grant, S (2003). AS Economics. England: Pearson Education Limited. Investopedia (2011), Production Possibility Curve [digital image], Available: http://www.investopedia.com/university/economics/economics2.asp. Last accessed: 10th July, 2011 Riley, G (2006) tutor2u Available: http://tutor2u.net/economics/revision-notes/as-markets-production-possibility-frontier.html Last accessed 10th July, 2011 Sparknotes (2011), Shifts in the PPC [digital image], Available: http://www.sparkcharts.sparknotes.com. Last accessed: 10th July, 2011 Assignment 2 2a) What is demand and supply? Figure 1: Demand and Supply model (GoDaddy 1999-2011) Demand may be defined as the willingness and ability to buy a product at various prices over a given period of time; all other factors influencing demand is being held constant (ceteris paribus). Supply may be defined as the willingness and ability to sell a product at various prices over a given time; all other factors influencing supply are being held constant (ceteris paribus). Total revenue (TR) calculated by PxQ depicts the TR of sellers and total expenditures of consumers. The supply side With reference to figure 1, the upward slope of the supply curve depicts the law of supply i.e. higher the price of a good, more is the quantity supplied. Likewise, lower the price of a good less is the quantity supplied. Change in quantity supplied Movements along the supply curve mean a change in quantity supplied as a result of change in price. Shifts in the supply curve Figure 2: Shifts in the supply curve (Hillman, H 1998) Figure 2 above shows the change in supply when the supply curve shifts to the right and to the left. This shift is linked to non price factors such as increase or decrease in wages and salaries, changes in prices of raw material, change in price of capital, changes in technology, weather, government policies (subsidies and taxes) and so on. The demand side With reference to figure 1, the downward slope of the demand curve represents the law of demand. When the price (P) is high, quantity demand is lower and when the price is low, quantity demanded is higher. Therefore, the quantity demanded varies inversely with price. In the absence of a time period, there is no demand. If there are substitutes of goods, the demand falls significantly. Change in quantity demanded Figure 3: Movement along the demand curve (Investopedia 2011) Movements along the demand curve depicts changes in quantity demanded as a result of change in price. With reference to figure 3, when price is at P1 quantity demanded is Q1. If the price falls to P4, quantity demanded increases to Q4. An entrepreneur can reduce prices of goods when their expiry date is near or when there is excess stock because quantity demand will increase then. This strategy is commonly used to wipe out competition as well by lowering prices and attracting the market. Change in demand Figure 4: Shifts in the demand curve (Hillman, H 1998) A change in demand results the shifting of the demand curve and occurs due to factors other than change in price of the good. A change in demand might occur to due changes in tastes, increase or decrease in income, changes in the price of complements and substitutes, changes in weather and so on. It is important for businessmen to realize the importance of demand curves as they’re hidden in everyday lives. For instance, businessmen would know what factors to change to change demand as a result. Increase in advertising can increase demand and long term brand image. Changes in the economy and change in income will depict what prices to keep in order to increase or decrease demand. What is price elasticity of demand Price elasticity of demand measures the responsiveness in quantity demanded due to change in the price of the good, ceteris paribus. It is measured by PED= % change in Qd % change in price When demand is responsive PED is greater than 1. When demand is inelastic, PED is less than 1 and when demand is unitary to price, PED=1, Moffat, M (2011). It is important that businesses understand consumer sensitivity in demand to price changes. A good with very high price elasticity suggests that when price goes up, consumers will buy less of the good and when price decreases, consumers will buy more. A good with very low price elasticity entails the opposite and so change in price will have no or little effect on quantity demanded. The following table summarizes elasticity and effects on total revenue If, Ep>1 P TR If, Ep>1 P TR If, Ep=1 P No change in TR If, Ep Read More
Cite this document
  • APA
  • MLA
  • CHICAGO
(“Basic Economics Essay Example | Topics and Well Written Essays - 2500 words”, n.d.)
Retrieved from https://studentshare.org/literature/1427703-basic-economics
(Basic Economics Essay Example | Topics and Well Written Essays - 2500 Words)
https://studentshare.org/literature/1427703-basic-economics.
“Basic Economics Essay Example | Topics and Well Written Essays - 2500 Words”, n.d. https://studentshare.org/literature/1427703-basic-economics.
  • Cited: 0 times

CHECK THESE SAMPLES OF Basic Economics and the Key Economic Concept of Scarcity

Construction Economics

However, this industry is severely dependent on the robustness of the economic cycle then.... These economic cycles form an important feature of a market driven economy.... economic activities of the Government and the construction industry It is not always the policies followed by the government that affects economic activity.... Recession is a key index that needs to keep a tab regarding the performance of an economy and how the economic activities of the government are affecting the industry as a whole....
8 Pages (2000 words) Assignment

What is Economics Issues Affecting The Economy As A Whole

(McConnell, 2011) Macroeconomics and Microeconomics Before we go into further analysis it is very important to discuss about the two major branches of economics and that is differentiating between Microeconomics and Macroeconomics.... This issue is referred as scarcity because these resources like oil, mineral, gases take millions of years to form and human beings consume it with a century.... or the individuals, it means giving one's abilities and spending one's income in such a way that gives us the most benefit and utility, and for the community as a whole it means using peoples skill, energy and abilities, the land, the building and other economic resources so as to obtain highest possible standards of living ....
5 Pages (1250 words) Essay

The Influence of Marginalist Revolution in the Economy History

"In its stead, it portrays a haphazard and fragmented agglomeration of economic theorists, whose only common denominators were the twin notions of diminishing marginal utility and utility-determined prices"(Bowley 1973, p.... Moreover Bowley stated that none of the notions was especially new in the 1870s, we and may conclude that there was no interruption in the economic concepts of that time and the economic theory has realized one uninterrupted discipline from those time until nowadays (Bowley 1973, p....
14 Pages (3500 words) Essay

Major Differences between Adam Smiths and David Ricardos Theories of International Trade

the key classical and neoclassical economist theorists who have introduced the notion of international trade were Adam Smith and David Ricardo.... The demand for these alternatives eventually leads to the rise in their use costs due to scarcity, and they will rise, with the resultant decline of the previous costs.... As industry expanded, the land would appreciate in value according to its scarcity and location, with respect to industrial demand....
9 Pages (2250 words) Term Paper

Marginal Analysis and how it is used in the world of economics

In this context, the marginal analysis is very important—it is used to help people optimally allocate their scarce and valuable resources in order to maximize the Perhaps, it is the most important concept in the analysis of economic activities.... The elementary theory of economics says that we can not get everything that we want to.... The theory of economics helps us to make optimum decision....
5 Pages (1250 words) Essay

Economic System of the US

The concept of the economics deals with the interaction of different segments, which reveals how and why individuals, governments and firms make their necessary allocation and choices With the advancement in the technological and environmental aspect, the nations are involving in better means of production and distribution to earn competitive advantage in the global scenario.... The concept of the economic system is elaborated as the system of production and trade of goods and/or services in a community....
20 Pages (5000 words) Essay

The Economics and Marketing Sectors

By establishing the difference, as well as the concept of each Economics by definition involves a study in which the structures, manners, standards, and trends through which resources are allocated.... The concept of the economic problem involves “how to satisfy desires, and/wants with scares means.... An economic good is defined as anything that is both scares and desirable, which further complicates the concept of economics, since even straightforward...
16 Pages (4000 words) Coursework

Establishing Construction Economics

This case study "Establishing Construction Economics" presents the fundamental theme of economics as being the study and science of scarcity and effective or intelligent decision-making.... Influencing the economic activities is the central problem with which economics concerns itself—the universal and often known as 'the basic economic problem' which is the problem of scarcity of resources.... As stated by Samuelson and Nordhaus in their book Economics, 'the essence of economics is to acknowledge the reality of scarcity and then figure out how to organize society in a way which produces the most efficient use of resources....
48 Pages (12000 words) Assignment
sponsored ads
We use cookies to create the best experience for you. Keep on browsing if you are OK with that, or find out how to manage cookies.
Contact Us