StudentShare
Contact Us
Sign In / Sign Up for FREE
Search
Go to advanced search...
Free

Changes in Normal Pulse Rate - Case Study Example

Cite this document
Summary
The paper presents that the pulse rate is defined as the number of pulsations of an artery per minute. The rate of the pulse as observed in an artery is expressed as beats per minute. One can measure pulse rate anywhere an artery comes close to the skin…
Download full paper File format: .doc, available for editing
GRAB THE BEST PAPER97.5% of users find it useful
Changes in Normal Pulse Rate
Read Text Preview

Extract of sample "Changes in Normal Pulse Rate"

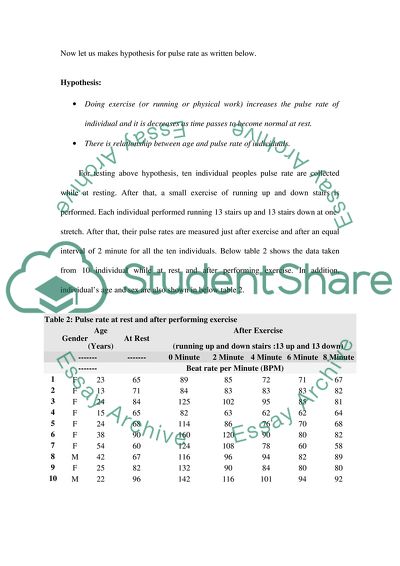
Pulse Rate Pulse rate is defined as the number of pulsations of an artery per minute. The rate of the pulse as observed in an artery is expressed as beats per minute. One can measure pulse rate anywhere an artery comes close to the skin, such as wrist, neck, temple area, groin, behind the knee, or top of foot. Below chart1 (table 1) shows the normal range of pulse rate at rest. There are different things such as age, activity performed and the time of day, that can cause changes in normal pulse rate. Table 1: Pulse Rate at Rest Age or Fitness Level Beats per Minute (BPM) Babies to age 1 100–160 Children ages 1 to 10 60–140 Children older 11 to 17 60–100 Adults 60–100 Well-conditioned athletes 40–60 From above chart, it is clear that the pulse rate for a healthy adult, while resting can range from 60 to 100 beats per minute (BPM). However, for well-conditioned athletes it can be between 40 and 60 BPM. Furthermore, at the time of sleep, pulse rate can drop to as low as 40 BPM and during exercise it can move up as high as 200 to 220 BPM. The maximum pulse rate is 220 minus age, and the target for a healthy pulse rate during, or just after, exercise, is 60-80 per cent of maximum pulse rate. There are different reason that cause the fast pulse rate and they are activity or exercise, fever, heart disease, smoking and stress. In addition, slow pulse rate are due to heart disease, high level of fitness. Now let us makes hypothesis for pulse rate as written below. Hypothesis: Doing exercise (or running or physical work) increases the pulse rate of individual and it is decreases as time passes to become normal at rest. There is relationship between age and pulse rate of individuals. For testing above hypothesis, ten individual peoples pulse rate are collected while at resting. After that, a small exercise of running up and down stairs is performed. Each individual performed running 13 stairs up and 13 stairs down at one-stretch. After that, their pulse rates are measured just after exercise and after an equal interval of 2 minute for all the ten individuals. Below table 2 shows the data taken from 10 individual while at rest and after performing exercise. In addition, individual’s age and sex are also shown in below table 2. Table 2: Pulse rate at rest and after performing exercise Gender Age (Years) At Rest After Exercise (running up and down stairs :13 up and 13 down) ------- ------- 0 Minute 2 Minute 4 Minute 6 Minute 8 Minute ------- Beat rate per Minute (BPM) 1 F 23 65 89 85 72 71 67 2 F 13 71 84 83 83 83 82 3 F 24 84 125 102 95 85 81 4 F 15 65 82 63 62 62 64 5 F 24 68 114 86 76 70 68 6 F 38 90 160 120 90 80 82 7 F 54 60 124 108 78 60 58 8 M 42 67 116 96 94 82 89 9 F 25 82 132 90 84 80 80 10 M 22 96 142 116 101 94 92 From the above table 2 it can be seen that for individuals the pulse rate at rest is between 60 and 100 (65 lowest and 96 highest) BPM. In addition, the average (mean), median, mode and rage for the pulse rate at rest for these individuals are 74.8, 69.5, 65 and 31 BPM respectively (table 3). Table 3: Average, Mean, Median and Mode (Pulse rate at rest) Average 74.8 BPM Median 69.5 BPM Mode 65 BPM Range 31 BPM The pulse rate at rest for ten individuals is shown below in scatter graph and histogram. Figure 1: Pulse rest at rest (Scatter diagram) Figure 2: Pulse rate at rest (Histogram) From Figure 1 and 2, it is clear that al the individuals have different pulse rate. In addition, the pulse rate for all the individuals at rest is between 60 and 100 (65 lowest and 96 highest) BPM Table 4: Pulse rate at rest and just after performing exercise Age Pulse Rate Before Exercise (at rest) Pulse Rate After Exercise Percentage Increase (%) Maximum Pulse Rate (220 – Age) (X) Target (Healthy) Pulse Rate After Exercise (60 To 80 % Of X) Years BPM 23 65 89 37 197 118 to 158 13 71 84 18 207 124 to 166 24 84 125 49 196 118 to 157 15 65 82 26 205 123 to 164 24 68 114 68 196 118 to 157 38 90 160 78 182 109 to 146 54 60 124 107 166 99 to 133 42 67 116 73 178 107 to 142 25 82 132 61 195 117 to 156 22 96 142 48 198 119 to 158 From below table 4, it can be seen that the percentage increase in pulse rate for individuals after exercise is not same and it varies from as low 18% to as high 107% of the pulse rate at rest. Moreover, pulse rate of all the individuals are not in between target (healthy) pulse rate after exercise for individuals. Out of 10 individuals, only 5 have pulse rate after exercise in between target (healthy) pulse rate after exercise (shown as red). In addition, 4 individuals have pulse rate after exercise below target (healthy) pulse rate after exercise (shown as green) and this may be reason that they are well-conditioned athletes. Furthermore, there is one individual, whose pulse rate is above target (healthy) pulse rate after exercise (shown as pink) and this may be because of health reason. Therefore, pulse rate after exercise varies differently for individuals because of individuals age, health and as previously mentioned how well conditioned they are (athletic). Figure 3: Pulse rate after exercise (Scatter diagram) Figure 3 and 4 shows the scatter diagram and histogram for the pulse rate at rest, just after exercise and decrease after exercise at every 2-minute interval. For analysis purpose, it is clearer to observe histogram. In histogram, all the 10 individuals pulse rate at rest, just after exercise and decrease after exercise at every 2-minute interval are shown as six bars for each individuals. Now, in every histogram it can be seen that pulse rate increases just after exercise increases and than it is decreases and after eight minutes it is again approaches approximately to the pulse rate at rest. This is also shown in below table 5. Figure 4: Pulse rate after exercise (Histogram) Table 5: Pulse rate at rest and after eight minutes of performing exercise Pulse rate before exercise (BPM) Pulse rate after 8 minutes of exercise (BPM) 65 67 71 82 84 81 65 64 68 68 90 82 60 58 67 89 82 80 96 92 Table 6 shows the age and pulse rate of individuals and figure 5 shows the scatter diagram and trend line plotted based on age and pulse rate from table 6. Table 6: Pulse Rate at rest and Age Age (Years) Pulse rate at rest (BPM) 23 65 13 71 24 84 15 65 24 68 38 90 54 60 42 67 25 82 22 96 Figure 5: Pulse Rate vs. Age (Scatter diagram) and Trend line The equation for trend line taking age of individuals as independent variable and pulse rate of individuals as dependent variable based on sample data is given below: Pulse Rate = - 0.1819 (Age) + 79.893 Let us check all the individuals pulse rate based on above equation. Below table 7 shows, the age, pulse rate at rest and pulse rate based on equation for all the individuals. Now, from table 7 it can be seen that using trend line equation ‘Pulse Rate = - 0.1819 (Age) + 79.893’, the pulse rate obtained is not matches the pulse rate of the individuals at rest. For all the 10 individuals, the pulse rate obtained using trend line varies significantly from actual pulse rate. Therefore, it seems that there is as such no relationship between age and pulse rate of individual people. Table 7: Age, Pulse Rate at rest and Pulse Rate Based on Equation Age (Years) Pulse rate at rest (BPM) Pulse rate based on equation (BPM) 23 65 76 13 71 78 24 84 76 15 65 77 24 68 76 38 90 73 54 60 70 42 67 72 25 82 76 22 96 76 In conclusion, it can be said that doing exercise (or running or physical work) increases the pulse rate of individual and it is decreases as time passes to become normal at rest. Therefore, hypothesis doing exercise (or running or physical work) increases the pulse rate of individual and it is decreases as time passes to become normal at rest is true. In addition, there is as such no relationship between age and pulse rate of individuals. Therefore, hypothesis that there is relationship between age and pulse rate of individuals is false. References: http://www.gcseguide.co.uk/statistics_and_probability.htm Read More
Cite this document
  • APA
  • MLA
  • CHICAGO
(Changes in Normal Pulse Rate Case Study Example | Topics and Well Written Essays - 1500 words, n.d.)
Changes in Normal Pulse Rate Case Study Example | Topics and Well Written Essays - 1500 words. https://studentshare.org/health-sciences-medicine/1711340-mathematics-handling-data-pulse-rate
(Changes in Normal Pulse Rate Case Study Example | Topics and Well Written Essays - 1500 Words)
Changes in Normal Pulse Rate Case Study Example | Topics and Well Written Essays - 1500 Words. https://studentshare.org/health-sciences-medicine/1711340-mathematics-handling-data-pulse-rate.
“Changes in Normal Pulse Rate Case Study Example | Topics and Well Written Essays - 1500 Words”. https://studentshare.org/health-sciences-medicine/1711340-mathematics-handling-data-pulse-rate.
  • Cited: 0 times

CHECK THESE SAMPLES OF Changes in Normal Pulse Rate

Antenatal and Intrapartum Competencies

Initial assessment (observation, history taken, physical examination, social, cultural and emotional assessment) using a systematic and logical approach, using appropriate terminology: Entails reviewing the patient's health record, then, testing the blood pressure, temperature, pulse rate and undertaking urinalysis tests (NHS, 2013 n.... Finally, observe the fetal heart rate, while avoiding using cardiotocography, where the pregnancy is in the low-risk category (NHS, 2013 n....
12 Pages (3000 words) Essay

The Implantable Gastric Stimulator

Treatment through a surgical implantation of an electric gastric stimulator holds promise for hundreds of thousands of individuals suffering from uncontrollable obesity.... The factors of efficacy, safety and simplicity associated with this procedure are making it a desirable option in combating difficult cases of obesity, in spite of the relatively high cost of the treatment....
18 Pages (4500 words) Essay

Can Bedside Assessment Detect Aspiration

VFSE is also not a natural procedure since it examines swallowing in ideal circumstances, in an upright posture and using boluses that are not similar to normal food and liquid intake.... This report talks that many studies have examined the effectiveness of bedside examination for detecting aspiration....
8 Pages (2000 words) Essay

Present Illness of Diplopia

ital signsNo fever, pulse rate 69 per minute, respiratory rate 28 per minute, blood pressure- 136/78 per minute.... In the essay “Present Illness of Diplopia,” the author describes the case of Mrs.... Y who has had increasing problems with headaches.... These headaches are relieved by cutting off the lights and resting for approximately 4-6 hours....
2 Pages (500 words) Case Study

Pulse Rate, Temperature, Respiration and Control of Peripheral

When sick, body temperature rises to about 20 Physiology behind pulse rate, Temperature, Respiration and Control Mechanisms of Peripheral Resistance.... Submission:Physiology behind pulse rate, Temperature, Respiration and Control Mechanisms of PeripheralHeat has to be related to the skin's surface in order to maintain a constant body temperature.... Head injuries may result in slow pulse rates though this is exceptional in highly trained athletes who were slow pulse rate is considered normal....
2 Pages (500 words) Essay

Effect of Exercise on Blood Pressure and Pulse Rate

This paper reports on the analysis, interpretation of the results obtained after conducting an experiment on the short-term and immediate effects of exercise on pulse rate and blood pressure.... hellip; Scientifically, there exists a close relationship between physical exercises and pulse rate and blood pressure.... Whenever one is engaged in a physical exercise, several changes occur in the pulse rate and blood pressure.... The influences of exercise on pulse rate and blood pressure can be scientifically ascertained....
4 Pages (1000 words) Essay

How Physical activity affect the heart rate

The body's physical activities affect the rate at which the heart beats per unit time.... The change in rate of the heart is resulting from the case where the body is trying to replenish the oxygen that is consumed during the metabolism when the food is converted to the energy and the carbon dioxide (Jackson, 2009).... The heart rate can be monitored using the electrocardiogram that records the rate at which the heart is beating per unit time....
4 Pages (1000 words) Assignment

Affects of Physical Activity on the Heart Rate And Blood Pressure

nbsp;           Prolonged and excessive exercise pressure results in an increased risk of abnormal heart oxygen contractions and scarring of the heart muscle, and laboratory oxygen studies with animals have shown an association between prolonged exercise and unwanted changes in heart structure and function.... This is the "Effects of Physical Activity on the Heart rate And Blood Pressure" essay.... hellip; But not everyone knows why you should monitor your normal heart rate during running exercise to reach the control over the blood pressure....
5 Pages (1250 words) Essay
sponsored ads
We use cookies to create the best experience for you. Keep on browsing if you are OK with that, or find out how to manage cookies.
Contact Us