StudentShare
Contact Us
Sign In / Sign Up for FREE
Search
Go to advanced search...
Free

Shift-Share Analysis of a Local Government Area - Case Study Example

Cite this document
Summary
"Shift-Share Analysis of a Local Government Area" paper entails a shift-share analysis of an Australian non-metropolitan Local Government Area. The areas of emphasis are Gold Coast and Queensland. The paper analyzes data for the period marked by the years from 2001 to 2006 and from 2006 to 2011. …
Download full paper File format: .doc, available for editing
GRAB THE BEST PAPER93.6% of users find it useful
Shift-Share Analysis of a Local Government Area
Read Text Preview

Extract of sample "Shift-Share Analysis of a Local Government Area"

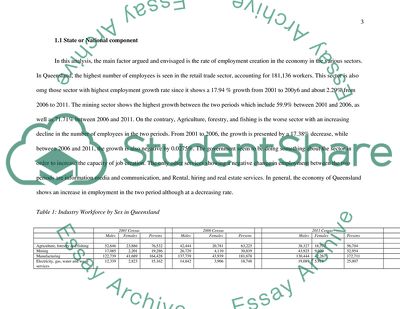
Shift-Share Analysis (of a Local Government Area 0 Introduction This paper entails a shift-share analysis of an Australian non-metropolitan Local Government Area (LGA). The areas of emphasis in this case are Gold Coast and Queensland. The paper looks and analyzes data for the period marked by the years from 2001 to 2006 and from 2006 to 2011. Shift share analysis is a measure used by various regional and state officials in the determination of the economic performance and progress of different countries and regions. In this paper, the shift-share analysis focuses on comparison of economic performance of the stipulated states in terms of creation of job opportunities for the citizens of the two states. To achieve this, various sectors of the country’s economy within the two distinct states are considered for the analysis. The general trend within the two states seems similar, which implies the economy of the entire country is also the same in terms of job creation and employment rate. Typically, shift analysis is based on employment creation and the generation of income from a wide range of economic productive sectors. These are mainly the sectors, which act as the strongholds in a given country, for which the citizens rely on for their earnings. The paper is therefore presented based on the data interpreted using the information given from Gold Coast and Queensland (Giuseppe, and Badi, 2008, page 348). 1.1 State or National component In this analysis, the main factor argued and envisaged is the rate of employment creation in the economy in the various sectors. In Queensland, the highest number of employees is seen in the retail trade sector, accounting for 181,136 workers. This sector is also omg those sector with highest employment growth rate since it shows a 17.94 % growth from 2001 to 200y6 and about 2.29% from 2006 to 2011. The mining sector shows the highest growth between the two periods which include 59.9% between 2001 and 2006, as well as 71.71% between 2006 and 2011. On the contrary, Agriculture, forestry, and fishing is the worse sector with an increasing decline in the number of employees in the two periods. From 2001 to 2006, the growth is presented by a 17.38% decrease, while between 2006 and 2011, the growth is also negative by 0.0275%. The government seem to be doing something about the sector in order to increase the capacity of job creation. The only other services showing a negative change in employment between the two periods are information media and communication, and Rental, hiring and real estate services. In general, the economy of Queensland shows an increase in employment in the two period although at a decreasing rate. Table 1: Industry Workforce by Sex in Queensland 2001 Census 2006 Census 2011 Census Males Females Persons Males Females Persons Males Females Persons                         Agriculture, forestry and fishing 52,646 23,886 76,532 42,444 20,781 63,225 38,327 18,377 56,704 Mining 17,085 2,201 19,286 26,729 4,110 30,839 43,925 9,029 52,954 Manufacturing 122,739 41,689 164,428 137,739 43,939 181,678 130,444 42,267 172,711 Electricity, gas, water and waste services 12,339 2,823 15,162 14,842 3,906 18,748 19,089 5,918 25,007 Construction 92,863 15,508 108,371 142,567 23,909 166,476 157,746 26,571 184,317 Wholesale trade 52,734 23,391 76,125 48,457 24,190 72,647 50,091 24,627 74,718 Retail trade 78,460 102,676 181,136 89,525 124,112 213,637 89,074 129,448 218,522 Accommodation and food services 49,091 66,593 115,684 52,307 75,897 128,204 58,642 83,590 142,232 Transport, postal and warehousing 61,923 19,305 81,228 70,791 22,281 93,072 81,474 26,097 107,571 Information media and telecommunications 16,835 12,481 29,316 15,065 11,538 26,603 14,303 11,291 25,594 Financial and insurance services 17,784 26,778 44,562 21,929 30,994 52,923 22,892 31,756 54,648 Rental, hiring and real estate services 15,814 14,897 30,711 18,334 19,884 38,218 17,781 19,490 37,271 Professional, scientific and technical services 45,549 39,294 84,843 54,342 49,438 103,780 72,672 61,660 134,332 Administrative and support services 24,201 25,920 50,121 26,795 29,349 56,144 31,162 34,342 65,504 Public administration and safety 59,272 37,793 97,065 70,437 52,557 122,994 75,637 62,006 137,643 Education and training 38,868 86,194 125,062 40,611 99,282 139,893 45,984 115,571 161,555 Health care and social assistance 31,938 116,531 148,469 39,982 148,580 188,562 51,414 193,085 244,499 Arts and recreation services 12,346 10,500 22,846 12,636 12,245 24,881 14,739 14,000 28,739 Other services 36,707 25,831 62,538 38,029 30,859 68,888 43,568 35,620 79,188 Inadequately described/Not stated 18,720 16,659 35,379 29,468 20,004 49,472 29,100 19,423 48,523 Total 857,914 710,950 1,568,864 993,029 847,855 1,840,884 1,088,064 964,168 2,052,232 ExEmployment Changes in the sectors 2001 2006 2011 Persons Persons Change (2001-2006) % CHANGE Persons Change (2006-2011) % CHANGE       Agriculture, forestry and fishing 76,532 63,225 -13,307 -17.387498 56,704 -17 -0.0275 Mining 19,286 30,839 11,553 59.903557 52,954 22,115 71.71114 Manufacturing 164,428 181,678 17,250 10.490914 172,711 -8,967 -4.93566 Electricity, gas, water and waste services 15,162 18,748 3,586 23.6512333 25,007 6,259 33.38489 Construction 108,371 166,476 58,105 53.6167425 184,317 17,841 10.71686 Wholesale trade 76,125 72,647 -3,478 -4.5688013 74,718 2,071 2.850772 Retail trade 181,136 213,637 32,501 17.9428717 218,522 4,885 2.286589 Accommodation and food services 115,684 128,204 12,520 10.8225857 142,232 14,028 10.94194 Transport, postal and warehousing 81,228 93,072 11,844 14.5811789 107,571 14,499 15.57826 Information media and telecommunications 29,316 26,603 -2,713 -9.2543321 25,594 -1,009 -3.79281 Financial and insurance services 44,562 52,923 8,361 18.7626229 54,648 1,725 3.259452 Rental, hiring and real estate services 30,711 38,218 7,507 24.4440103 37,271 -947 -2.47789 Professional, scientific and technical services 84,843 103,780 18,937 22.32005 134,332 30,552 29.4392 Administrative and support services 50,121 56,144 6,023 12.0169191 65,504 9,360 16.67142 Public administration and safety 97,065 122,994 25,929 26.7130274 137,643 14,649 11.91034 Education and training 125,062 139,893 14,831 11.858918 161,555 21,662 15.48469 Health care and social assistance 148,469 188,562 40,093 27.0042905 244,499 55,937 29.66504 Arts and recreation services 22,846 24,881 2,035 8.90746739 28,739 3,858 15.50581 Other services 62,538 68,888 6,350 10.1538265 79,188 10,300 14.95181 Inadequately described/Not stated 35,379 49,472 14,093 39.834365 48,523 -949 -1.91826 Total 1,568,864 1,840,884 272,020 17.3386603 2,052,232 211,348 11.48079 Table 1: Industry Workforce by Sex in Gold Coast 2001 Census 2006 Census 2011 Census Males Females Persons Males Females Persons Change (2001-2006) % Change Males Females Persons Change 2006-2011() Change (%)                           Agriculture, forestry and fishing 1,031 513 1,544 979 438 1,417 -127 -8 680 352 1,032 -385 -27.1701 Mining 307 57 364 531 108 639 275 76 1,094 254 1,348 709 110.9546 Manufacturing 11,565 4,461 16,026 14,195 4,674 18,869 2,843 18 13,125 4,671 17,796 -1,073 -5.68658 Electricity, gas, water and waste services 683 153 836 858 180 1,038 202 24 1,362 378 1,740 702 67.63006 Construction 12,521 2,049 14,570 20,913 3,637 24,550 9,980 68 22,100 3,655 25,755 1,205 4.90835 Wholesale trade 4,556 2,294 6,850 5,157 3,114 8,271 1,421 21 5,601 3,173 8,774 503 6.08149 Retail trade 9,940 12,843 22,783 11,576 16,220 27,796 5,013 22 11,950 17,107 29,057 1,261 4.536624 Accommodation and food services 8,871 10,004 18,875 9,029 11,434 20,463 1,588 8 9,763 12,578 22,341 1,878 9.17754 Transport, postal and warehousing 4,603 1,526 6,129 5,602 1,846 7,448 1,319 22 6,760 2,311 9,071 1,623 21.79108 Information media and telecommunications 2,034 1,895 3,929 2,139 1,859 3,998 69 2 2,093 1,852 3,945 -53 -1.32566 Financial and insurance services 2,104 2,897 5,001 2,772 3,609 6,381 1,380 28 2,903 3,772 6,675 294 4.607428 Rental, hiring and real estate services 2,876 2,724 5,600 3,206 3,411 6,617 1,017 18 3,065 3,347 6,412 -205 -3.09808 Professional, scientific and technical services 4,629 4,220 8,849 5,685 5,597 11,282 2,433 27 7,742 7,230 14,972 3,690 32.70697 Administrative and support services 3,285 3,397 6,682 3,581 3,981 7,562 880 13 4,385 4,929 9,314 1,752 23.16847 Public administration and safety 3,573 2,311 5,884 4,720 3,412 8,132 2,248 38 5,738 4,498 10,236 2,104 25.87309 Education and training 3,386 7,240 10,626 3,778 8,972 12,750 2,124 20 5,019 11,590 16,609 3,859 30.26667 Health care and social assistance 2,987 11,064 14,051 4,002 14,926 18,928 4,877 35 5,542 20,695 26,237 7,309 38.61475 Arts and recreation services 2,845 2,394 5,239 2,956 2,920 5,876 637 12 3,541 3,339 6,880 1,004 17.08645 Other services 4,090 3,069 7,159 4,262 3,879 8,141 982 14 4,944 4,539 9,483 1,342 16.48446 Inadequately described/Not stated 2,299 2,083 4,382 3,700 2,844 6,544 2,162 49 3,539 2,724 6,263 -281 -4.29401 Total 88,185 77,194 165,379 109,641 97,061 206,702 41,323 25 120,946 112,994 233,940 27,238 13.17742 In Gold Coast, the mining sector also takes the lead in terms of job creation. Increase in the number of employment opportunity for the two periods by 76% and 110.95% make the sector the most promising sector not only in the state but also between the two states. Link in Queensland, manufacturing sector seem to have laid off a number of workers between 2006 and 2011. The same case happened in Queensland implying that the sector is worsening throughout the country. The sector marked by agriculture, fisheries, and forestry has been among the worst sectors but the trend shows that the sector is recovering with a possibility of depicting a positive change by the next census period. Growth of employment is declining in the state’s economy in general as depicted by a decrease in the average percentage growth for all the economic sectors from 25% to 13.18%. The future of employment situation seem to be darkening as some sectors decrease the number of employees that are already employed with most of the rest decreasing the number of employees recruited each year. 2.0 Structural components With regard to structural components, nearly all the economic sectors in Queensland and Gold Coast States recorded positive change in regards to the national industrial growth apart from the three sectors mentioned above. The three sectors show seemingly the same trend, which implies that the two states could be reflecting the situation of employment in the whole country. In this case, it can ascertained that the state’s general economy has an adequate capacity to generate employment. However, most of the sectors show a decreasing rate of employment because the change is more positive or less negative between 2001 and 2006 than it is in the period marked by between the year 2006 and 2011. Of all sectors, mining stands out to be the most promising sector in terms of employment creating because it shows the highest change in the two periods. The worst sector is Agriculture, forestry, and fisheries because it has recorded the lowest overall change from 2001 to 2011. 2.1 Differential component It is important to acknowledge that in economic growth, there is anticipation and the turnout or the true market situation that is encountered by both the public sectors and the private capitalists. In this case therefore, the differential component is arrived at by the subtraction of the expected job opportunities and the people who are absorbed in the various sectors offering the jobs and the rate of growth of the various industries so as to ascertain the rate at which employment increases in the country or the region of choice (Daniel and Boris, 2006, page 427). From the given data, this is attained by the expected change that the entrepreneurs and other business stakeholders anticipated in the market and the actual change that has been realized in the market. Typically, based on the results and calculations, Agriculture, Fishing, and Forestry sector has one of the highest potentials the state has in promoting employment. Already, there seem to be efforts in place develop the sector as seen by the declining negative change, which is likely to turn positive by the next census period (Daniel and Boris, 2006, page 436). Various factors could have possibly facilitated and triggered this massive economic and industrial growth as well as employment and unemployment rates variations. Owing to the fact that the reasons are to be given in regards to an area that is a high generator of tourists, the reasons will therefore involve various players in the tourism industry either directly or indirectly. The reasons are therefore well envisaged as shown below (Robert, Roger, and Brian, 2006, page 132). 3.0 Reasons for the economic situation 3.1 Technological advancements With the development of technology and adoption of the use of technology in many operations, there is the high rate of capital-intensive applications in operations compared to the labor intensive. A good cases is for example the computerized tourism attraction sites, that have computerized operations in reservation and in some situations service and delivery of meals, there is no need for the use of human or manual reservations as the tourists and customers find this quite faster and less expensive or rather economical as they do not have to spend on the cost of travel to the place that they intend to spend at before the material day for the travel (Robert, Roger, and Brian, 2006, page 251). The results show that that due to the technological advancements, the industries that were affected may use less of human labor, but still maintain a high productivity. Information Media and Telecommunications were as well other industries that affected the employees as seen by the negative change of employment growth between the year 2006 and 2011. It seems that technology is increasingly replacing human labor in the technologically intensified industries. This problem could also happen due to a decreased productivity in a given sector, but mainly, technology advancements have resulted to laying off of employees in most of the sectors (Robert, Roger, and Brian, 2006, page 429). 3.2 Increased infrastructural development With the influx of many tourists or customers, it is important to highlight that there was high need for the various persons providing the services and products to have more resources and various forms of infrastructure. These include accommodation facilities, transport networks to make the areas accessible, as well as buildings, and other facilities that are peripherals to make visitors and residents’ lives better and more comfortable lives. The same case could be a reason for the increased employment creation in the electricity, Construction, as well as the Mining Industries. This aspect also created more employment opportunities for the people employed in the building and construction of infrastructural facilities (Daniel and Boris. 2006, page 361). 3.3 High market demand in certain sectors of the economy For the rates of employment to be high in certain sectors of the economy, it is important to highlight that there has to be high level of demand for the latter products and services. About this therefore, there has to be enough and sufficient number of staff who meet the market demand as it interacts with the service and product providers. Examples of such sectors are the Accommodation and Food service sector, the Financial and Insurance services sector and finally the Professional, scientific & technical services. These are key service providing sectors that have high level of human interaction owing to the intangible nature of the services provided. In such sectors, simultaneity is as well required in the full realization of the service (Siddhartha, 2012, page 162). 4.0 Strategies your Local Government Area (LGA) could or should employ in the light of these results to enhance local economic development. 4.1 Proper marketing and promotion For the proper development of the local area economically, it is important for the local government area to involve themselves in proper and effective continuous, marketing of the local facilities. This will stir up demand for the commodities thereby leading to a significant flow of investments into the area. Promotions can as well be enhanced through organizing of events and activities in the area. This is an indirect way of tourism promotion conducted. This will increase the demand for various products and the economies of the local area will definitely grow, as the people will purchase the local products and services that are offered for exchange in return for money (Roberta, and Peter, 2010, page 671). 4.2 Well developed infrastructure An area that has well-developed infrastructure ranging from transport networks, communication networks is easily accessible and therefore facilitates faster interaction between the people who are involved in trading activities. Goon educational as well training institutions leads to the production of efficient, qualified and up-skilled staff who are very much ideal to the market force and have the required knowledge and skills in the production and delivery of the required services (Robert, Roger, and Brian, 2006,page 529). 4.3 Enacting regulatory measures For an area to keep check of the key operators in the tourism market or any business market, it is important for the local government area to enact various rules and regulations that can be used in guiding how the stakeholders who supply the products in the market operate. This will help in the ensuring that there is healthy competition among the various firms in the market, supply of high quality products and fair pricing. Quality is a highly personal matter, areas with high quality products, services, fair prices that are affordable are highly visited by the tourists, and this is of economic significance to such destinations (Siddhartha, 2012). 4.4 Employing the use of technology in operation Use of technology in operations improves the quality of output, efficiency, and presentable, and it is time saving. All these can be collectively perceived as the attributes making up a product quality or service quality. Use technology can therefore make the customers to assume that the quality of the service provided is high and of quality. This therefore can stimulate high demand thereby leading to increased purchase from the given area (Xinhao, and Rainer, 2008, page 326). 5.0 Conclusion Cases of unemployment result from various economic factors. Unemployment can be minimized with the application of the right strategies. One of these strategies includes the use of technologies that encourage innovation and job creation. Besides, empowering the marginalized communities in the society would be a great idea. The gap between males and females in employment is only made larger due to lack of the necessary mechanisms of empowering women in the society. Technology and empowerment should be among the most utilized strategies of narrowing the gap between males and females in terms of employment within all sectors. Generally, the economy of both Gold Coast and Queensland is good but there is a declining rate of growth in employment overall. The local governments of the two states need to target the best sectors, which have a promising future in creating employment such as in agriculture, mining, and technology among others. The strategy of introducing new technologies should be initiated with a view of generating employment rather than reducing the amount workers required within a given sector. If more concentration were placed on widening the sectors, then the problem of unemployment is likely to end. Bibliography Daniel F., and Boris A., 2006. Regional Disparities in Small Countries, Springer Publishers. Giuseppe A., and Badi B., 2008. Spatial Econometrics: Methods and Applications, Studies in Empirical Economics, Springer publishers. Robert J., Roger R. and Brian H., 2006. Regional Economic Development: Analysis and Planning Strategy, Springer Publishers. Roberta C., and Peter N., 2010. Handbook of Regional Growth and Development Theories, Edward Elgar Publishing. Siddhartha S., 2012. International Journal of Economic and Political Integration: Vol. 2, No. 2, Universal-Publishers. Xinhao W. and Rainer H., 2008. Research Methods in Urban and Regional Planning, Springer Publishers, page 54. Read More
Cite this document
  • APA
  • MLA
  • CHICAGO
(Shift-Share Analysis of a Local Government Area Case Study, n.d.)
Shift-Share Analysis of a Local Government Area Case Study. https://studentshare.org/geography/1825510-shift-share-analysis-of-a-local-government-area
(Shift-Share Analysis of a Local Government Area Case Study)
Shift-Share Analysis of a Local Government Area Case Study. https://studentshare.org/geography/1825510-shift-share-analysis-of-a-local-government-area.
“Shift-Share Analysis of a Local Government Area Case Study”. https://studentshare.org/geography/1825510-shift-share-analysis-of-a-local-government-area.
  • Cited: 0 times

CHECK THESE SAMPLES OF Shift-Share Analysis of a Local Government Area

Health Policy Analysis

In a health policy research, the obtained information is very important in provision of basis for the allocation of government resources in an area (Lee and Mills 2004:12).... Introduction Healthy policy is the plan and actions that government or other established bodies undertake in order to achieve certain health care goals in a given society.... It can also be a form of redefinition of the role of provincial government in the local health resource care and the desire to hold health care providers more accountable to the dire community they serve....
13 Pages (3250 words) Essay

Tourism as Relatively a New Field in Japan

Okinawa is uniquely situated within a 1,500 kilometer radius from most major cities in Southeast Asia; however, the percentage of international tourist arrivals from this area is low.... As the country continued with efforts to make the shift from being a “Trade Nation” to “Tourism Nation,” the central government enacted its first tourism policy, making tourism a priority.... The second part of the section studies the structure and role of the government in tourism development....
9 Pages (2250 words) Essay

Public Policy and Administration: The Concepts of Management and Leadership

Section II Policy analysis Describe and identify at least one example of the ideological conflict many Americans have with their negative attitude toward the idea of a large and active government, but positive desire to provide individual, public programs such as education and health programs like Medicare....
6 Pages (1500 words) Essay

Article Critiques on Finance

However, Dauman's lack of experience of building media firms is a cause of concern, his area of expertise being the fine-print in mergers and acquisitions.... The Rockefeller Foundation and the gates Foundation have jointly decided to devote $150 million over five years to bring about an agricultural revolution in Africa....
2 Pages (500 words) Essay

GOVERNMENT REQUIREMENTS FOR AFFORDABLE HOUSING IS LEADING TO RESIDENTIAL DEVELOPMENT TO BECOME UNVIABLE

It concludes that up to the present time the shift in emphasis is more one of rhetoric than of reality and, more fundamentally, that the forms in which current policies are implemented bear very little relationship to those suggested by analysis of basic principles.... Though there is a great opposition against the government regulations from the developers and public on the issue of affordabilty housing, there is very little in particular study available so far to gather the reasons contributing to this opposition. ...
40 Pages (10000 words) Essay

Tesco Organizational Analysis

Tesco is a retail multinational company that has its headquarters in Tesco Plc involved in food, mobile phones, fuel, electronics, wine, and other products.... Tesco uses a number of platforms to achieve its global agenda including Giraffe Restaurants, Your Beauty Salon, Telecoms,… Tesco has over 30% market share in the United Kingdom and over 2500 stores in 12 countries spread over three continents....
6 Pages (1500 words) Case Study

The Regional Pattern of Construction in the Globe

nbsp;  At the same time, the paper is going to talk about the analysis of the total volume of international construction, and comment on the trend in the Less Developed Countries, Advanced Industrialized Countries, and Newly Industrialized Countries.... "The Regional Pattern of Construction in the Globe" paper talks about the strategy most companies use to diversify their business in different sectors....
7 Pages (1750 words) Coursework

The Employment Growth of the Different Regions in Australia

hellip; A policy was developed such that the government would help relocate well-doing business back to the rural areas.... (Walmsley and Weinand, 1997) The Australian government has different responsibilities, the provision of key public amenities and infrastructure belong to the states.... Funding and financing of the states belong to the federal government.... This kind of government structure has largely contributed to the inequalities....
12 Pages (3000 words) Case Study
sponsored ads
We use cookies to create the best experience for you. Keep on browsing if you are OK with that, or find out how to manage cookies.
Contact Us