StudentShare
Contact Us
Sign In / Sign Up for FREE
Search
Go to advanced search...
Free

Wabash Watershed - Essay Example

Cite this document
Summary
This paper 'Wabash Watershed' tells us that there is a relevant increase of average annual minimum temperature in the Wabash valley watershed if we based it on the 5-year and 10-year data observed between 1961 and 1990. There is a relative increase of average annual minimum temperature for more than one unit…
Download full paper File format: .doc, available for editing
GRAB THE BEST PAPER96% of users find it useful
Wabash Watershed
Read Text Preview

Extract of sample "Wabash Watershed"

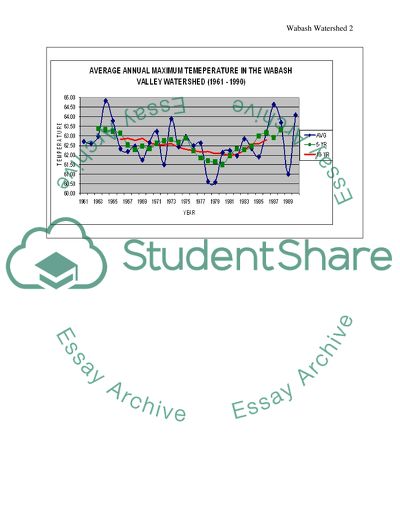
?Part A: Part A includes graphs that will help you understand and interpret changes in precipitation, temperature and other factors and their potential relationship to global warming.. PART B The evidence of overall warming of the environment There is a relevant increase of average annual minimum temperature in the Wabash valley watershed if we based it on the 5-year and 10-year data observed between 1961 and 1990. There is a relative increase of average annual minimum temperature for more than one unit based on a 10-year period data, but below two units. This somehow shows an increasing trend of the average annual minimum temperature in the area by average based on the data obtained from 5 and 10 years span of time, respectively. There is also a relevant trend for the cycle of increase of temperature if we based it on the average annual maximum temperature in the Wabash valley watershed based on the 5-year and 10-year data from 1961 to 1990. It started higher somewhere in 1961 then went to a downward spiral somewhere in 1981 and 1982, but again it surged higher back to the temperature equivalent to almost one unit experienced in 1961 based on a 10-year covered data. The above trends are consistent with the overall trend of the average annual temperature in the Wabash valley watershed. There is a remarkable cycle of temperature increase, starting with the lower one in 1961, then a relative increase along the way, and decrease in 1981 and again a remarkable increase of the graph slope until 1990. This trend significantly shows a cycle of temperature increase, but reveals us the point that in totality there is an observed temperature increase within the range of time between the years 1961 to 1990. To look at it a specific level, we can also observe the average daily temperature range in the Wabash valley watershed. The graphical representation shows a downward trend from 1961 to 1990 based on the average 5 and 10-year data. This is in fulfilment to the envisioned scenario of some theorists that there is a more pronounced warming of minimum temperatures than maximum temperatures, which we can relatively observe as realistic if we based in on the graphical trend representations. Furthermore, this could be observed from a reduced range of temperatures, which we significantly see from the decreasing trend of the average daily temperature from 1961 to 1990, as the 5-year and 10-year average data show. The evidence of drought and water surplus To investigate the evidence of drought and water surplus conditions for inland or continental locations, we can look at the trends in precipitation amounts and the frequency of certain amounts of precipitation taking place at Wabash valley watershed. Global warming theorists believe that global warming phenomenon foresees drought and less surplus water conditions for inland or continental locations. The average annual precipitation in the Wabash valley watershed generally has an increasing trend starting from 1961 to 1990 and if we also based it on the 5-year and 10-year data. On the average annual days of light precipitation in the Wabash valley watershed, the trend remarkably goes high and even higher starting from 1982 to 1990, 5-year and 10-year data. This trend is also remarkably observed if we based it on the average annual days of precipitation in the Wabash valley watershed, as there is a depiction of increasing trend from 1961 to 1990. On the other hand, the average annual surplus in the Wabash valley watershed relatively increases to fewer inches, higher in fewer inches from 1961 compared to the level in 1990. Between these corresponding years, there is also evidence to suggest that the surplus level tends to maintain a higher trend compared from 1961. Expectation from a warming climate As there is evidence to support the overall warming of the environment based on the data generated from Wabash valley watershed, the average annual actual evapotranspiration has an increasing trend starting from 1961 to 1990. From 1961, the evapotranspiration in inches did not move below the baseline of the said year. This means that the trend for the average annual actual evapotranspiration is increasing, which is in proportion to the warming environment or increasing environmental temperature stated previously. The moisture surplus as stated earlier has increased, which substantially supports the decreasing trend of average actual annual moisture deficit, but this one tends to show a cycle, as from 1961 to 1972 there was a decreasing deficit, but this moved higher again until 1990, if we based it on the 5-year and 10-year data. In addition, the increasing surplus also tends to support the increasing level of average annual runoff. Based on the above trends, we can simply expect that in a warming climate, there is considerable increase of water vapor and evaporation, leading to frequent precipitation activities. We should expect then of a higher or increasing surplus and overflow, as the actual water cycle should send back the water to its original form and source. However, there is a remarkable trend of deficit that we can see in here, which is something that we can see as a potential problem in the event of a warming environment. Here where we can see the actual picture of abundance of water supply and the deficit on the other side. If we try to study the water cycle, the warming environment is capable of producing more water vapor and sends them back to its original form and source. At some point, the surplus and water flow are increasing, but there is also a cycle of deficit, which is a form of inconsistency linked to the water cycle flow. Clear-cut answers in the trends The above scenarios of the data trends present us the ultimate answer why in some parts of the world, there is abundance of water by flooding and there are remarkable droughts in other parts of the world. The trends allow us to understand more of the quantitative data linked to the actual water cycle activity. With a high temperature of the environment, water in its liquid form is more susceptible to be turned into vapor. This accumulates in the atmosphere in large quantity, which could also pour out in a large volume in a form of heavy rain. The trends show us the actual level of water surplus and runoff and there is evidence to suggest that there was indeed an increasing volume for them from 1961 to 1990. Although there seems to be a form of trends in the cycle, but this only provides us the opportunity to understand the actual water cycle controlled by the prevailing temperature of the environment. In other words, the above trends only show that the warming environment has a significant impact on the water cycle trend, at the bottom line. This is supported by the evidence of an increasing trend of the average annual actual evapotranspiration, resulting to increasing runoff and surplus of water level in Wabash valley watershed. Due to increasing environmental temperature, based on the trends of data from various angles linked to water cycle activity, deficit takes place due to the point that there may be unequal geographic distribution of rain from one place to another. This would mean that at some point heavy rain pours in a certain place, but light precipitation takes place in other geographic locations. This is supported by the graphical presentations of the trend concerning the average annual precipitation in Wabash valley watershed. Furthermore, evidence suggests in the actual world that climate change which is said to be due to a warming environment is responsible for heavy flooding in some parts of the world and intense drought on the other parts (Collier, 2002; Kabat, 2003; Pittock, 2009). Researching global warming The above data show us the trends linked to the warming environment and they simply imply the idea that there is a need to learn more about global warming. Researching global warming, an integral component of researching global issues includes understanding of the basic principles in science. Scientific inquiry is a big deal in this case, knowing the fact that there are two opposing sides concerning the issue associated with the existence of global warming. At the other side, the global warming alarmists believe that the warming of the environment is the reason behind various environmental changes at present (Mearns & Norton, 2010, p.93; Guchteneire, 2011, p.226). On the other hand, those who are sceptical of the said environmental phenomenon are employing arguments founded by scientific principles just to be able to justify their actual main point on the issue against what the alarmists believed to be right (Nanda, 2011, p.149; Giddens, 2009, p.24; Deloso, 2008, p.4). These conflicting views therefore call for more in-depth research study and analysis employing more relevant scientific methods and inquiry to validate the actual information. Other data or information for analysis To make a worthwhile analysis, we have just learned the evidence of a warming environment, average precipitation, evapotranspiration, runoff and other relevant information that could help us understand the water cycle and the probable impact that global warming may affect the Wabash valley watershed based on the data from 1961 to 1990. Aside from these data and information, there are other important information that could somehow help us prove the existence of global warming and its substantial impact on Wabash valley watershed. As we know, there is corresponding trend of average annual deficit at Wabash watershed and there is a connection of this when we try to study where on the earth the water could go aside from inland and continental locations. Around 90% of precipitation falls right back into the ocean (Cech, 2009, p.27; Hanslmeier, 2010, p.22). This means that a greater percentage of condensed water vapor goes to the ocean. With the presence of deficit, we now have the theoretical idea that a corresponding amount of water may be added back to the ocean. We can therefore monitor the salinity level of the ocean, finding if it decreases, so as to be an indicator that more fresh water is accumulating in there that are supposed to be part of the inland and continental location resulting to deficit. Implications of the study The study provides us the opportunity to understand or prove the probable impact of a warming environment. At some point, this may also provide the chance to prove the existence of global warming. As already stated, there are arguments between the global warming alarmists and sceptics regarding the truth of the warming environment and the climate change. The research study is an opportunity for us to understand some important information in detail on how exactly the water cycle is affected by the warming environment. The presented data may stand as remarkable evidence in order to support some scientific justifications and theories concerning the water cycle and global warming theory, as far as scientific inquiry is concerned. Climate trends to human agency Water for consumption is important to people’s lives and in their daily activities in order to ensure survival. Watershed is a remarkable source of water supply for consumption. This means that in order to ensure constant supply from this source, precipitation must continue to take place in a normal or constant level that is just enough to supply the human need for everyday use. However, the moisture deficit may be a major problem, as stated based on the trends because this may imply that precipitation takes place more often somewhere in the ocean and not in the inland or continental sites where a watershed is located. Implications of trends for people in Wabash watershed So far if we try to evaluate the trends, and if they continue in their current direction, there would be substantial changes that will take place in the Wabash watershed. As we know based on the trends, it is not impossible that the water source and sustainability of it will move in a downward spiral in the future knowing the point that there is evidence to support that idea of a warming environment. This therefore will lead the people living in the Wabash watershed to encounter specific problem with their water supply source, which may alter some socio-economic activities. This is fundamental because it is here in which their daily activities rely on with great proportion of time. After all, a sustainable water supply source is what helps and sustains the life on earth. References Cech, T. V. (2009). Principles of Water Resources: History, Development, Management, and Policy. Hoboken, NJ: John Wiley & Sons. Collier, M. (2002). Floods, Droughts, and Climate Change. Arizona: University of Arizona Press. Deloso, R. (2008). ENGO Influence in International Climate Change Negotiations – Case Study of the Issue of Post – 2012 during COP 11 and COP/MOP 1. Bristol: GRIN Verlag. Giddens, A. (2009). Politics of Climate Change. Malden, MA: Polity. Guchteneire, P. F. A. (2011). Migration and Climate Change. New York, NY: Cambridge University Press. Hanslmeier, A. (2010). Water in the Universe. London: Springer. Kabat, P. (2003). Climate Changes the Water Rules: How Water Managers Can Cope with Today’s Climate Variability and Tomorrow’s Climate Change. Wageningen: Water and Climate. Mearns, R., & Norton, A. (2010). Social Dimensions of Climate Change: Equity and Vulnerability in a Warming World. Washington, DC: World Bank Publications. Nanda, V. P. (2011). Climate Change and Environmental Ethics. New Brunswick, NJ: Transaction Publishers. Pittock, A. (2009). Climate Change: The Science, Impacts and Solutions (2nd ed.). Sterling, VA: CSIRO Publishing. Read More
Tags
Cite this document
  • APA
  • MLA
  • CHICAGO
(“Wabash Watershed Essay Example | Topics and Well Written Essays - 2000 words”, n.d.)
Retrieved from https://studentshare.org/geography/1483720-wabash-watershed
(Wabash Watershed Essay Example | Topics and Well Written Essays - 2000 Words)
https://studentshare.org/geography/1483720-wabash-watershed.
“Wabash Watershed Essay Example | Topics and Well Written Essays - 2000 Words”, n.d. https://studentshare.org/geography/1483720-wabash-watershed.
  • Cited: 0 times

CHECK THESE SAMPLES OF Wabash Watershed

Prospects of a Future Revolution in Iran

Topic: Prospects of a Future Revolution in Iran Introduction: Recent discourse regarding Iran is often dominated by the question, “Will the Islamic Republic have another revolution in its future or not?... ?? In fact, Iran's quest for democracy is more than a century old.... hellip; It began with the Constitutional Movement (1905-1907), resulting in the establishment of a parliament and reemerged with the Iranian Revolution (1979), culminating in the overthrow of the Pahlavi monarchy and its replacement with an Islamic republic under Ayatollah Ruhollah Khomeini....
14 Pages (3500 words) Essay

Earth's Lithosphere

The paper will also pay specific focus to Wabash Watershed and longitudinal effects of greenhouse and global warming on this surrounding.... Greenhouse Effects and Global Warming Institution Date Abstract There have been ceaseless cries of environmental depletion all the world.... Water shortage has become a familiar tragedy to the inhabitants of earth....
5 Pages (1250 words) Essay

Climatology and Pollution of Watersheds

Mississippi watershed is found along Mississippi river which flows in the United States of America and the river emerges from western part of Minnesota and it flows towards the south at 4,070 km towards the delta of the Mississippi river.... … Name: Instructors name: Course: Date: Watersheds Mississippi watershed is found along Mississippi river which flows in the United States of America and the river emerges from western part of Minnesota and it flows towards the south at 4,070 km towards the delta of the Mississippi river....
7 Pages (1750 words) Essay

A Critical Analysis of Terrorism Discourse and Orientalist Thinking

A Critical Analysis of Terrorism Discourse and Orientalist Thinking Introduction Edward Said's theory of Orientalism revealed to the world the ‘imaginative geography' where in the West and East are divided; a division, though, that is “less a fact of nature than it is a fact of human production” (Battersby, 2007, p....
12 Pages (3000 words) Research Paper

The Global Warming

This paper ''The Global Warming'' tells that The name may suggest that Global Warming is just a relative increase in global temperatures in the lower part of the atmosphere.... In many cases, this might even be true; however, global warming's true definition extends the phenomena of just an increase in the degree of warmth....
10 Pages (2500 words) Case Study

Hydrological Processes in Watershed Regions

The writer of the paper “Hydrological Processes in watershed Regions” discusses different factors that affect the climate or weather of a watershed, among them are Gradient in atmospheric pressure, direction of winds and storms, Altitude of the region, elevation and Atmospheric system.... he kind of watershed also affects not only the amount of rain but the area of rainfall which is going to have rain.... For instance, some watershed regions have leeward and windward sides which mean that only one side of the watershed will receive any amount of rainfall....
5 Pages (1250 words) Report

Americas Watershed Initiative

The main discussion of this paper “America's watershed Initiative” is about various steps taken by the USA government in order to protect and ensure the effective use of the Mississippi River basin.... hellip; The paper also critically analyzes what possible roles the unmanned can play as a means to protect and secure this massive watershed along with some well thought out suggestion and recommendations for the same.... America's watershed Initiative is a conglomerate work process planned to improve various kinds of possible resolutions....
15 Pages (3750 words) Research Paper

Wabash River Watershed

… The paper "Wabash River watershed" is a wonderful example of a term paper on environmental studies.... The paper "Wabash River watershed" is a wonderful example of a term paper on environmental studies.... This paper intends to look at data of Wabash rover watershed from 1961-1990 on changes in climatic factors and whether they reflect on climate change is actually happening....
8 Pages (2000 words) Term Paper
sponsored ads
We use cookies to create the best experience for you. Keep on browsing if you are OK with that, or find out how to manage cookies.
Contact Us