StudentShare

Our website is a unique platform where students can share their papers in a matter of giving an example of the work to be done. If you find papers
matching your topic, you may use them only as an example of work. This is 100% legal. You may not submit downloaded papers as your own, that is cheating. Also you
should remember, that this work was alredy submitted once by a student who originally wrote it.
✕
Free
Descriptive Statistical Analyses and an Important Aspect of Social Science - Essay Example
Summary
The paper "Descriptive Statistical Analyses and an Important Aspect of Social Science" analyzes a forecasting analysis. It is therefore important to note that forecasting can be achieved through trend-lines. It is indisputable that data analysis is an important aspect of social science…
- Subject: Finance & Accounting
- Type: Essay
- Level: Undergraduate
- Pages: 4 (1000 words)
- Downloads: 0
- Author: hal02
Extract of sample "Descriptive Statistical Analyses and an Important Aspect of Social Science"
Financial Data Analysis Introduction Various methods are engaged in analyzing specific forms of data in abid to making sense out of the same. Statisticians and other stakeholders involve in data analysis in a bid to provide adequate understanding of the specific phenomena with respect to social behavior. Different statistical analysis tools are used in order to make sense of specific sets and forms of data (Rice, 2007). Examples of such tools include descriptive and inferential statistics. Whereas descriptive statistics include the measures of central tendencies and measures of dispersion whilst inferential statistics include the use of regression and correlation analysis. The following is an analysis of a data set involving the prices of wheat during 2008.
Part One of the Data Analyses
Summary of Actions
The data analysis involves conducting a correlation and descriptive statistical analyses. Firstly, the data analysis process involved regrouping of the prices of the two categories of wheat. Then the relevant data was extracted from the whole data set for the 2008 and the two kinds of wheat. With the data regrouped, the next procedure was to draw a time series. The time series had the years as the X-variables and the prices of wheat as the Y-variables (Rice, 2007). After the drawing of the time series, the data analysis process engaged in describing the data through various components of the descriptive analysis. The descriptive analysis provides a general overview of the data set to be analyzed.
After the descriptive data analysis, the next process was to conduct a correlation and a covariance analysis on the data set. The correlation and covariance analyses were aimed at finding out the correlation coefficient in order to ascertain the relationship between the two prices of the two kinds of wheat. Besides, the correlation and covariance coefficients were also used in assessing the direction and strength of the relationship between the prices of the two kinds of wheat within the data set.
Findings
The following are the findings obtained from the first part of the analysis in respect to time series, descriptive analysis, correlation, and covariance.
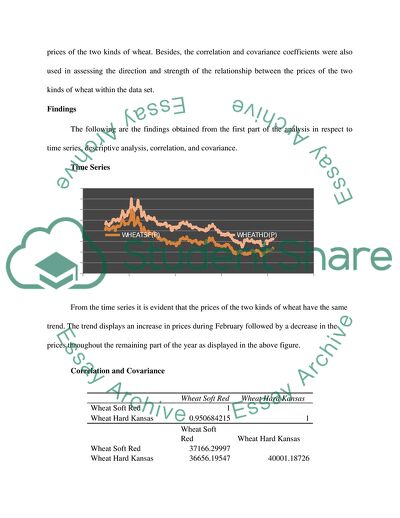
Time Series
From the time series it is evident that the prices of the two kinds of wheat have the same trend. The trend displays an increase in prices during February followed by a decrease in the prices throughout the remaining part of the year as displayed in the above figure.
Correlation and Covariance
Wheat Soft Red
Wheat Hard Kansas
Wheat Soft Red
1
Wheat Hard Kansas
0.950684215
1
Wheat Soft Red
Wheat Hard Kansas
Wheat Soft Red
37166.29997
Wheat Hard Kansas
36656.19547
40001.18726
From the above correlation coefficient, it is evident that there is a strong positive correlation given the fact that the coefficient is positive and it is close to 1. Correlation coefficients usually range from -1 to +1 with the former indicating a strong negative correlation and latter showing a strong positive correlation (Rice, 2007). The covariance obtained from the data analysis also confirms the strong positive correlation.
Descriptive Statistics
WHEATSF(P)
Value
WHEATHD(P)
Value
Mean
631.1469466
Mean
860.2509542
Standard Error
11.93313105
Standard Error
12.37987293
Median
595.5
Median
875.5
Mode
438.5
Mode
620
Standard Deviation
193.1546002
Standard Deviation
200.3857493
Sample Variance
37308.69959
Sample Variance
40154.44851
Kurtosis
-0.513131032
Kurtosis
-0.464999548
Skewness
0.539762591
Skewness
0.2041105
Range
863
Range
920.5
Minimum
331.5
Minimum
486.5
Maximum
1194.5
Maximum
1407
Sum
165360.5
Sum
225385.75
Count
262
Count
262
Largest(1)
1194.5
Largest(1)
1407
Smallest(1)
331.5
Smallest(1)
486.5
Confidence Level (95.0%)
23.49746471
Confidence Level (95.0%)
24.37714176
The above graph provides an adequate analysis of the descriptive data regarding the two sets of data. The mean, standard deviation, sample variance, and skewness of the data set provide a description of the prices of two kinds of wheat provided (Rice, 2007).
Part Two of Data Analyses
Summary
The second part of the data analyses involved forecasting. Forecasting is an important aspect with respect to making sense of the available data. The forecasting involved two forms; use of trend-lines and the application of regression analysis. The first aspect involved creation of different time series tables (Rice, 2007). After which, the time series were developed through a trend-line. The trend-line was effective in making sure that the statistical data analysis was able to forecast into the future for the purposes of obtaining further data and analysis.
On the other perspective, the regression analysis was also used in forecasting the data. The forecasting of the data based on regression analysis used various components or tools. Therefore, the regression analysis was very useful in forecasting the data.
Findings: From the forecasting analysis, the following are some of the findings obtained.
Wheat Soft Red
The regression equation for the wheat soft red is Y = - 1.647 + 65933, with R2 being 0.8191 indicating that with time, the prices of this type of wheat will definitely reduce significantly.
Wheat Hard Kansas
The regression equation for the wheat soft red is Y = - 1.6612 + 66696, with R2 being 0.7736 indicating that with time, the prices of this type of wheat will definitely reduce significantly.
In addition to the forecasts, the following is a summary of the regression analysis that is used in forecasting the data.
SUMMARY OUTPUT
Regression Statistics
Multiple R
0.905050101
R Square
0.819115686
Adjusted R Square
0.818419977
Standard Error
82.30743902
Observations
262
The multiple R, the R square, and the adjusted R square are good coefficients for forecasting the data within the financial analysis aspects. In addition, the following is a summary of the data that can be used in making sure that there is a possibility of forecasting the same.
df
SS
MS
F
Significance F
Regression
1
7976196.818
7976196.818
1177.383
1.58E-98
Residual
260
1761373.774
6774.514517
Total
261
9737570.593
In addition, the following data can be used in forecasting the data.
Coefficients
Standard Error
t Stat
P-value
Lower 95%
Upper 95%
Lower 95.0%
Upper 95.0%
Intercept
65932.50872
1903.114623
34.64452847
2E-99
62185.03
69679.99
62185.03
69679.99
X Variable 1
-1.647763435
0.048021533
-34.313012
1.58E-98
-1.74232
-1.5532
-1.74232
-1.5532
All the information contained above is adequate to enable in making a forecasting analysis. It is therefore important to note that forecasting can be achieved through trend-lines as well as the regression analysis. In conclusion, it is indisputable that data analysis is an important aspect of social science. Social scientists that include statisticians, economics, and other stakeholders employ data analysis in order to make sense of the available raw data.
Bibliography
Rice, J. A. (2007). Mathematical statistics and data analysis. Duxbury press.
Read
More
sponsored ads
Save Your Time for More Important Things
Let us write or edit the essay on your topic
"Descriptive Statistical Analyses and an Important Aspect of Social Science"
with a personal 20% discount.
GRAB THE BEST PAPER
