StudentShare
Contact Us
Sign In / Sign Up for FREE
Search
Go to advanced search...
Free

A Comparative Analysis of FedEx Corp and United Parcel Service Inc - Term Paper Example

Cite this document
Summary
The author compares FedEx Corp and United Parcel Service Inc. (UPS) which are both involved in the Courier Service industry. They are both currently rated as one of the top 100 companies in the USA according to Fortune Magazine. Currently, UPS is ahead at number 49 with FedEx at number 57…
Download full paper File format: .doc, available for editing
GRAB THE BEST PAPER91.2% of users find it useful
A Comparative Analysis of FedEx Corp and United Parcel Service Inc
Read Text Preview

Extract of sample "A Comparative Analysis of FedEx Corp and United Parcel Service Inc"

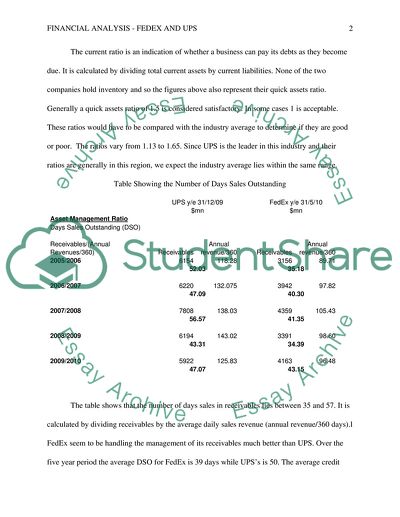
 A Comparative Analysis FedEx Corp and United Parcel Service Inc. (UPS) are both involved in the Courier Service industry. They are both currently rated as one of the top 100 companies in the USA according to Fortune Magazine. Currently UPS is ahead at number 49 with FedEx at number 57. UPS is the leader in its industry, delivering packages in over 220 countries. FedEx is second in the industry behind UPS in the United States. The balance sheet and income statement will be analyzed for the pass five years. While both companies have different year ends, this analysis seeks to also account for that factor. The financial year for FedEx is May 31, while that of UPS is December 31, a difference of five (5) months or approximately 2 quarters. Comparative Analysis of both Balance Sheets Table of Current ratio UPS y/e 31/12/09 FedEx y/e 31/5/10 $mn $mn Liquidity ratio Current ratio Current asset/ current Liabilities Current assets Current liabilities Current assets Current liabilities 2005/2006 10728 6518 6464 5473 1.65 1.18 2006/2007 9377 6719 6629 5428 1.40 1.22 2007/2008 11760 9840 7244 5368 1.20 1.35 2008/2009 8845 7817 7116 4524 1.13 1.57 2009/2010 9275 6239 7284 4645 1.49 1.57 The current ratio is an indication of whether a business can pay its debts as they become due. It is calculated by dividing total current assets by current liabilities. None of the two companies hold inventory and so the figures above also represent their quick assets ratio. Generally a quick assets ratio of 1.5 is considered satisfactory. In some cases 1 is acceptable. These ratios would have to be compared with the industry average to determine if they are good or poor. The ratios vary from 1.13 to 1.65. Since UPS is the leader in this industry and their ratios are generally in this region, we expect the industry average lies within the same range. Table Showing the Number of Days Sales Outstanding UPS y/e 31/12/09 FedEx y/e 31/5/10 $mn $mn Asset Management Ratio Days Sales Outstanding (DSO) Receivables/(Annual Revenues/360) Receivables Annual revenue/360 Receivables Annual revenue/360 2005/2006 6154 118.28 3156 89.71 52.03 35.18 2006/2007 6220 132.075 3942 97.82 47.09 40.30 2007/2008 7808 138.03 4359 105.43 56.57 41.35 2008/2009 6194 143.02 3391 98.60 43.31 34.39 2009/2010 5922 125.83 4163 96.48 47.07 43.15 The table shows that the number of days sales in receivables lies between 35 and 57. It is calculated by dividing receivables by the average daily sales revenue (annual revenue/360 days).l FedEx seem to be handling the management of its receivables much better than UPS. Over the five year period the average DSO for FedEx is 39 days while UPS’s is 50. The average credit period is 30 days. UPS needs to improve the management of their receivables by looking at the credit policy as it relates to the terms, credit limit and the credit period allowed. However, the management of UPS has to exercise caution as they may lose business to competitors such as FedEx. Table - Fixed Asset Turnover Ratio UPS y/e 31/12/09 FedEx y/e 31/5/10 $mn $mn Asset Management ratio Fixed Assets Turnover Sales/Net Fixed Assets Sales Net Fixed Assets Sales Net Fixed Assets 2005/2006 42581 15289 32294 10770 6.53 3.00 2006/2007 47547 16779 35214 12638 2.83 2.79 2007/2008 49692 17663 37953 13478 2.81 2.82 2008/2009 51486 18263 35497 13417 2.82 2.65 2009/2010 45297 24902 34734 14385 1.82 2.41 Fixed asset turnover indicates how well businesses are utilizing their assets. It is found by dividing sales by the net fixed assets and is shown in days. The figures for UPS has shown continuous decline over the period. There was a drastic decline of the turnover which fell from 7 days to 3 days between 2005 and 2006. Since then it has remained fairly steady between 2006 and 2008 hovering at 3 days. There was a noticeable a decline from 3 days in 2008 to 2 days in 2009. The trend for FedEx is fairly constant as it is consistently at 3 days throughout the period. Based on the numbers, FedEx appears to be utilizing its fixed asset far better than UPS. Table - Debt Ratio UPS y/e 31/12/09 FedEx y/e 31/5/10 $mn $mn Debt Management Ratio Total Debt to Total Assets Total Debt/Total Assets Total Debts Total Assets Total Debts Total Assets 2005/2006 18063 34947 11179 22690 0.52 0.49 2006/2007 17728 33210 11344 24000 0.53 0.47 2007/2008 26859 39042 11107 25633 0.69 0.43 2008/2009 25099 31879 10618 24244 0.79 0.44 2009/2010 24253 31883 11091 24902 0.76 0.45 A debt ratio of 50% is generally the benchmark. It is calculated as total debts (both current and long term) divided by total assets. Anything over 50% is considered high. While FedEx’s debt ratio remains low at between 43 and d49%below 50%, UPS’s has varied from a low of 52% to a high of 79%. According to Brigham et al, (1999 p79), shareholders see leverage as magnifying expected earning while creditors prefer a low debt ratio. The lower ratio is seen as protection against losses in the event of bankruptcy. UPS’s debt ratio can make it more difficult for the company to borrow more funds. In comparison, it would be much easier for FedEx to borrow and since the risk is lower, the interest rate that the company would be able to attract is likely to be lower than UPS. It can be said that FedEx has more borrowing capacity than UPS. Comparative Analysis of both Income Statements Table - Profit Margin on Sales UPS y/e 31/12/09 FedEx y/e 31/5/10 $mn $mn Profitability Ratio Profit Margin on sales Net Income available to stockholders/Sales Net Income Sales Net Income Sales 2005/2006 3870 42581 1806 22690 0.09 0.08 2006/2007 4202 47547 2016 24000 0.09 0.08 2007/2008 382 49692 1125 25633 0.01 0.04 2008/2009 3003 51486 98 24244 0.06 0.00 2009/2010 2152 45297 1184 24902 0.05 0.05 This profit margin on ratio indicates how much a business generates for every dollar of sales and is calculated as net income after interest and tax divided by sales. Percentages are found from the figures in the table by multiplying by 100. It has varied throughout the period from between 1% and 9% for UPS and between o% and 8% for FedEx. UPS worst year was 2007 when it had unusual expenses of $6.1bn. This amount relates to payments for voluntary separation and impaired assets (aircrafts). In 2009 FedEx also had some unusual expenses which resulted in a negligible amount, which approximates to 0%, being earned on every dollar of sales. However, on average, UPS generates a higher percentage on every dollar of sales than FedEx. 2008/2009 was the period of severe economic depression which affected both companies in some way. Table – Return on Total Assets (ROA) UPS y/e 31/12/09 FedEx y/e 31/5/10 $mn $mn Profitability Ratio Return on Total Assets (ROA) Net Income available to common stockholders/Total Assets Net Income Total Assets Net Income Total Assets 2005/2006 3870 31883 1806 22690 0.12 0.08 2006/2007 4202 31879 2016 24000 0.13 0.08 2007/2008 382 39042 1125 25633 0.01 0.04 2008/2009 3003 33210 98 24244 0.09 0.00 2009/2010 2152 34947 1184 24902 0.06 0.05 Return on total assets, gives the return on all capital employed in the business and is calculated as the net income available to common stock holders divided by total assets. It is a measure that is used to compare the returns on the business operations with that on alternative investments. The returns are low ranging from 1% to 12% for UPS and 0 to 8% for FedEx. The reasons for the low figures in 2007 and 2008/2009 for FedEx was due to extraordinarily high unusual expenses as outlined in the earlier analysis of profit margin on sales. Table – Return on Common Equity (ROCE) UPS y/e 31/12/09 FedEx y/e 31/5/10 $mn $mn Profitability Ratio Return on Common Equity (ROCE) Net Income available to common stockholders/Common Equity Net Income Common Equity Net Income Common Equity 2005/2006 3870 11 1806 31 351.82 58.26 2006/2007 4202 11 2016 31 382.00 65.03 2007/2008 382 10 1125 31 38.20 36.29 2008/2009 3003 10 98 31 300.30 3.16 2009/2010 2152 10 1184 31 215.20 38.19 Return on common equity shows the return on the shareholders investment in the business and is calculated as the net income available to common stock holders divided by common equity. The return on common equity ranges from a low of 3820% to a high of 38300% for UPS and a low of 316% to a high of 6503% for FedEx. FedEx is lowest because the value of the company’s common equity is three (3) times that of UPS. The company’s net income is also much lower in most of the years except 2007 when UPS had extraordinarily high unusual expense. Both companies have a lot of debt, especially UPS and that is the reason for the high percentage. This high percentage is paying off as far as the shareholders of UPS are concerned. They have consistently received dividends of either the same or more for the past four (4) decades. There has never been a decrease. Since 2003 dividends received has doubled. (UPS.com, 2010). Table – Earnings per Share UPS FedEx Market Value Ratios Earnings per share 2005/6 3.47 5.94 2006/7 3.86 6.57 2007/8 0.36 3.63 2008/9 2.94 0.31 2009/10 2.14 3.79 The earnings per share (EPS) shows the earnings for each unit of stock held by shareholders. It is used along with the market price to determine the value that investors place on the shares. Except for 2008/2009 – the heat of the economic depression, FedEx’s EPS has looked much better than UPS. As with other ratios 2007 was affected by the extraordinarily high, unusual expenses. All things remaining equal the chart shows the projected net income for the next five years. Income is expected to be in the range of $2.5bn and $3bn for UPS and $1.25bn and $1.5bn for FedEx. The economy of the United States and the other countries in which they do business are recovering from the recession and so income is expected to be increasing or constant as shown in the charts above. Both companies have seen the rise and fall in their net income, a result of which was the severing of ties with former employees. They have also had to renew fleets of vehicles so as to increase efficiency in their operations. However, if UPS intends to stay in business, management has to pay attention to the ratios presented above. The stock may be doing well right now, but in order to continue to do so it must make some critical decisions. One of these decisions relate to the management of receivables. If this is not dealt with sooner than later, then these debtors will continue to use the credit granted by UPS to finance their business. The company needs to do something to get its customers to pay early. If the company is not offering discounts for early payment then that recommendation is up for consideration. UPS’s debt ratio is also too high. Even though common stockholders foresee benefits from a company with a high debt ratio it can work negatively against the company when funds are badly needed. If the company manages its receivables well then additional loans may not be necessary. Further analysis and possibly an internal analysis may have to be done to determine the real reasons behind the relatively poor management of its assets. References Brigham, E. F, Gapenski, L. C, Ehrhardt, M. C. (1999) Financial Management: Theory and Practice. USA: Dryden Press Thomson Reuters (2010). United Parcel Service Inc. Financial Statements. retrieved from http://moneycentral.msn.com/investor/invsub/results/statemnt.aspx?symbol=ups Thomson Reuters (2010). FedEx Corp. Financial Statements http://moneycentral.msn.com/investor/invsub/results/statemnt.aspx?symbol=fedex Read More
Cite this document
  • APA
  • MLA
  • CHICAGO
(A Comparative Analysis of FedEx Corp and United Parcel Service Inc Term Paper, n.d.)
A Comparative Analysis of FedEx Corp and United Parcel Service Inc Term Paper. Retrieved from https://studentshare.org/finance-accounting/1745782-analyze-financial-statements
(A Comparative Analysis of FedEx Corp and United Parcel Service Inc Term Paper)
A Comparative Analysis of FedEx Corp and United Parcel Service Inc Term Paper. https://studentshare.org/finance-accounting/1745782-analyze-financial-statements.
“A Comparative Analysis of FedEx Corp and United Parcel Service Inc Term Paper”, n.d. https://studentshare.org/finance-accounting/1745782-analyze-financial-statements.
  • Cited: 0 times

CHECK THESE SAMPLES OF A Comparative Analysis of FedEx Corp and United Parcel Service Inc

Crone v. United Parcel Service, Inc. (UPS)

ReferencesCrone v united parcel service inc (UPS).... We find that, in view Equal Employment Opportunity The effects of Crone V united parcel Services Inc.... oint and Several Liability Following the decision of the US Court of Appeal, 8th Circuit, to uphold the District Courts ruling that united parcel Services Inc were not guilty of discrimination in not promoting Ms Crone to the position of Supervisor, two questions arise.... united States Court of Appeals, 8th Circuit....
2 Pages (500 words) Essay

Fedex's Management and Existing Technology

The reason for the same is that there are advancements being made in the relevant fields of service delivery and courier industry in general.... Then the growing use of technology and its attachments means that… more and more emphasis is being laid on the fact that service and value for the end consumers is pertinent, since these are the people for whom FedEx is in business and its operations are heavily dependent upon customer satisfaction, retention and loyalty towards the FedEx Describe challenges presented to management due to managing existing technology?...
2 Pages (500 words) Essay

Financial Ration Analysis of FedEx Express

UPS was founded in 1907 and has its origin in Atlanta, Georgia (united parcel Services, Inc.... Given the history of fedex and UPS it could be seen that United Parcels Services, Inc.... . United Parcels Services, inc.... nited Parcels Services, inc.... edexexpressUnited Parcel Services, inc.... FedEx Express is “a global air-and-ground” transportation company that offers a wide variety of shipping services within the united States and other 220 countries world-wide....
2 Pages (500 words) Essay

The US Postal Service

Postal service, headed by a Postmaster General and a Board of Governors, is a branch of the federal government.... USPS has to serve these customers/territories even if a cost-benefit analysis suggests that they do not make commercial sense (Harreld, Heather 2000)....
4 Pages (1000 words) Essay

FedEx Market Evaluation

These include TNT, DHL and united parcel Services as the main competitors.... One of the largest markets of fedex is found in the supply chain.... History of fedex Operating Companies.... They provide shipping services both within the united States and globally. Being a local and international… ourier company, FedEx target market include individual transporters, small businesses, governments, multinational companies and any other groups or individuals that would like to send something across the world....
1 Pages (250 words) Essay

The Creativity of the FedEx Ad

The Ad is intended as a funny connotations y fedex to depict its carrying capacity and speed.... It is a strategic ad in a competitive field by… It was meant to appeal to consumers to choose the quality services offered y fedex at the same time it acted to diminish the carrying capacity and speed of its main competitors that is UPS and DHL. The ad uses humor fedex Ad fedex Ad The ad shows a fedex truck with graphics showing it carrying two UPS trucks and the rear types of the tuck show alorry of a DHL truck....
2 Pages (500 words) Essay

United Parcel Service Inc

The essay "united parcel service inc" analyzes the company which comes out as a provider of global supply chain solutions and management.... united parcel service inc.... offers control and visibility on inventories and supply chains while utilizing its technology platform....
3 Pages (750 words) Essay

The FedEx Leadership

Subsequently, this concept saw FedEx express adopting a people service profit philosophy. The FedEx leadership has incorporated a strategy where the FedEx companies' corporate platform majorly focuses on what they have in common collectively.... This service increases customer loyalty hence minimizing the chances of them trying a new or different company.... … Leadership fedex express moves over 7m packages each day by making over 600 flights daily....
2 Pages (500 words) Essay
sponsored ads
We use cookies to create the best experience for you. Keep on browsing if you are OK with that, or find out how to manage cookies.
Contact Us