StudentShare
Contact Us
Sign In / Sign Up for FREE
Search
Go to advanced search...
Free

Investment Analysis of Easy Jet Airline Company - Case Study Example

Cite this document
Summary
This work called "Investment Analysis of Easy Jet Airline Company" describes the prospect of investment on the Easy Jet Airline Company through its financial and management reports. The author focuses on financial highlights, growth rates, working capital, dividends…
Download full paper File format: .doc, available for editing
GRAB THE BEST PAPER95.8% of users find it useful
Investment Analysis of Easy Jet Airline Company
Read Text Preview

Extract of sample "Investment Analysis of Easy Jet Airline Company"

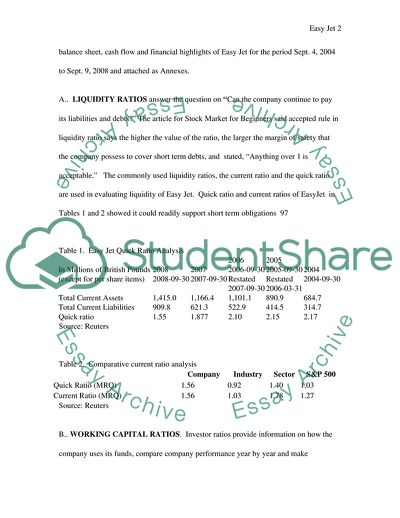
Total word count – 1547does not include tables and headings) Investment Analysis of Easy Jet Airline Company, Ltd. Understanding the profile of a company in terms of its management and financial operations is the best tool for an investment decision. This study will analyze the prospect of investment on the Easy Jet Airline Company through its financial and management reports. 42 I. Company profile. The Easy Jet Airline Company, Ltd. is one of Europe’s largest low fare airlines, plying 387 routes between 104 European and North African airports. It holds an operating license permit from the United Kingdom Civil Aviation Authority to carry passengers, cargo and mail on aircraft with 20 or more seas. Easy Jet is listed on the London Stock Exchange, and has headquarters at London Luton Airport. The company has 4,859 employees, and as of September 2008 has flown about 43,700,000 passengers in its 107 fleet size plus 105 new orders in 104 destinations. (Wikipedia) A Stock Broker’s report said that Easy Jet outlook for 2008 expects operations to be profitable and that the company is confident to report a net profit of GBP120 million before tax for fiscal 2008 Market capitalization of Easy Jet is reported to be GBP1,180,767,484. (Reuters) 139 II. FINANCIAL HIGHLIGHTS Liquidity, Working capital, Performance, and Solvency ratios are used to analyze EasyJet. Figures come from the financial statement, balance sheet, cash flow and financial highlights of Easy Jet for the period Sept. 4, 2004 to Sept. 9, 2008 and attached as Annexes. A.. LIQUIDITY RATIOS answer the question on “Can the company continue to pay its liabilities and debts?” The article for Stock Market for Beginners said accepted rule in liquidity ratio says the higher the value of the ratio, the larger the margin of safety that the company possess to cover short term debts, and stated, “Anything over 1 is acceptable.” The commonly used liquidity ratios, the current ratio and the quick ratio are used in evaluating liquidity of Easy Jet. Quick ratio and current ratios of EasyJet in Tables 1 and 2 showed it could readily support short term obligations 97 Table 1. Easy Jet Quick Ratio Analysis In Millions of British Pounds (except for per share items) 2008 2008-09-30 2007 2007-09-30 2006 2006-09-30 Restated 2007-09-30 2005 2005-09-30 Restated 2006-03-31 2004 2004-09-30 Total Current Assets 1,415.0 1,166.4 1,101.1 890.9 684.7 Total Current Liabilities 909.8 621.3 522.9 414.5 314.7 Quick ratio 1.55 1.877 2.10 2.15 2.17 Source: Reuters Table 2. Comparative current ratio analysis   Company Industry Sector S&P 500 Quick Ratio (MRQ) 1.56 0.92 1.40 1.03 Current Ratio (MRQ) 1.56 1.03 1.78 1.27 Source: Reuters B.. WORKING CAPITAL RATIOS. Investor ratios provide information on how the company uses its funds, compare company performance year by year and make comparative study on the company standing with that of its competitors and the industry. Price earning ratios, dividend yield and growth, debt to equity ratios of Easy Jet will be compared with the industry and competitors, and comparison of yearly performance of the company. Debt to equity. A debt to equity ratio measures the level of borrowings the company has used in proportion to stockholders’ equity to finance its assets. 90 Table 3. Debt to Equity Analysis of Easy Jet In Millions of British Pounds (except for per share items) 2008 2008-09-30 2007 2007-09-30 2006 2006-09-30 Restated 2007-09-30 2005 2005-09-30 Restated 2006-03-31 2004 2004-09-30 Total Liabilities 1,817.6 1,364.0 1,206.5 766.4 535.5 Common Stock, Total 105.7 104.8 102.6 100.1 99.8 Debt to equity 17.19 13.01 11.76 7.66 44.63 121.39 73.63 107.05 Source: Reuters The table shows that from year 2004 to 2008, Easy Jet used more debt instruments and other resources rather than from equity of investors 24 Table 4. Comparison of Debt/equity with competitors   Company Industry Sector S&P 500 LT Debt to Equity (MRQ) 44.63 121.39 73.63 107.05 Total Debt to Equity (MRQ) 55.01 149.18 108.60 152.47 Interest Coverage (TTM) -- 0.04 0.73 17.19 Source: Reuters Table shows ratio of D/E of Easy Jet is lower than its competitors. Investing in debt heavy companies have risks as a company with more borrowings is more risky than those companies who have less. A study said that when a company has more loans, its ability to pay these loans and interests is the key to its survival. According to this study, as a rule of thumb, investors should stay away from businesses “whose debt/equity ratio is greater than 1 (i.e. it is financed more through borrowings than through stockholders’ equity)” (Stock Market for Beginners) However, it has also been rationalized in this study, that capital intensive business tends to have higher debt to equity ratios, and that business with reliable (ie. earnings which don’t fluctuate much through economic cycles) earning can sustain a higher debt to equity ratio. Easy Jet is a highly capital intensive business which needs higher debt for capital acquisitions but has reliable income from operations. C. VALUATION RATIOS Price earning ratios. P/E ratios determine if one company is better than the other when investing in the stock market. Investors advocate using a P/E of 10, or a P/E of as high as 25. All other things being equal, a stock with a lower PE ratio would provide better value than one with a higher PE. Following the rule of a lower PE ratio is better value than one with higher PE, investors will most likely look at investing in the competitors of Easy Jet (Stock Market for Beginners) 250 Table 5. Comparison of Price Earning Ratios   Company Industry Sector S&P 500 P/E Ratio (TTM) 14.78 2.42 3.44 26.67 P/E High - Last 5 Yrs. -- 0.05 0.57 29.78 P/E Low - Last 5 Yrs. -- 0.00 0.16 9.20 Beta 0.72 0.42 1.05 0.95 Price to Sales (TTM) 0.49 0.07 0.38 2.22 Price to Book (MRQ) 0.90 1.26 1.44 4.56 Price to Tangible Book (MRQ) 1.38 1.41 1.79 8.58 Price to Cash Flow (TTM) 8.89 0.73 1.25 13.19 Price to Free Cash Flow (TTM) -- 0.59 38.08 46.80 % Owned Institutions -- -- -- -- TTM – trailing twelve months Source: Reuters The price earning ratio of the industry and the sector are much lower than Easy Jet and therefore a careful analysis should be done by an investor on the prevailing conditions set by the company before investing in Easy Jet. However, the five years sales figure of EasyJet show continuous improvement, has a potential for “significant turn around” and may be just waiting for the opportune time for an increase valuation in the stock market. a. Price to sales ratio is “a ratio that compares a firm’s stock price with its sales per share (or its market value with total revenue). It is used by some analysts to find companies that may be temporarily undervalued in the stock market. A low P/S ratio is used to characterize a firm with the potential for a significant turn around because sales has already taken place and improvement need only take place in the margin the firm is able to earn on each dollar of sales.” (Farflex. the Free Dictionary) 163 b. Price to book ratio compares a stock market value to the total assets less total liabilities (book value). It is determined by dividing current stock price by common stockholders equity per share (book value) adjusted by stock splits. (Farflex) 34 c. Price to cash flow is the percentage of the fund’s net assets held in cash (cash and cash equivalents). An analyst said that “if the net income is much larger than cash flow from operations, it is a signal that the quality of company earnings is questionable. If cash flows from operations exceeds net income, the company may be much healthier than what the net income suggests. (Morning.star.com) 63 Cash flow of Easy Jet as of 2008, shows is much bigger than the net income showing that the company is financially healthier than what the net income proposes 29 d. Dividends Dividends yield is a return on investment expressed in percentage Easy Jet did not declare any dividend yield for 5 years. 21 Table 6. Comparison of Dividend Yields   Company Industry Sector S&P 500 Dividend Yield -- 0.02 0.06 2.66 Dividend Yield - 5 Year Avg. 0.00 0.72 1.21 1.86 Dividend 5 Year Growth Rate -- 0.70 20.53 11.79 Payout Ratio(TTM) 0.00 2.47 7.89 52.04 e. GROWTH RATES Sales growth is the increase in sales over a specific period of time. As seen in the table below, sales growth of Easy Jet as compared with its own performance, and with that of the competitors in the industry, show a favorable growth 43 Table 7. Comparison of growth rates   Company Industry Sector S&P 500 Sales (MRQ) vs Qtr. 1 Yr. Ago 36.39 -0.26 7.64 12.01 Sales (TTM) vs TTM 1 Yr. Ago 31.47 1.37 5.26 13.82 Sales - 5 Yr. Growth Rate 20.45 4.36 6.41 14.82 EPS (MRQ) vs Qtr. 1 Yr. Ago -22.73 -63.38 -5.89 17.59 EPS (TTM) vs TTM 1 Yr. Ago -46.00 -- -- -- EPS - 5 Yr. Growth Rate 19.28 1.55 29.55 19.05 Capital Spending - 5 Yr. Growth Rate 7.15 15.49 15.37 13.38 Source Reuters f. Earning per share of- EPS. EPS is the portion of a companys profit allocated to each outstanding share of common stock and an indicator of profitability. Growth rate in earnings per share refers to the annual rate of growth returns that an investor expects to receive from his investment. EPS of Easy Jet on a yearly average showed negative value, while showing a 5 year EPS growth rate of 19.28, slightly higher than S&P 500 roughly 3.85 per year 75 IV. PERFORMANCE RATIO explains the return on investments of investors.. It is expressed in profits margins, EBITD, different categories of returns as a measure of management effectiveness. Gross margin is profit divided by sales revenue; gross profit divided by net sales revenue expressed in percentage. Table below shows EasyJet having a high gross margin as compared with the competition. Analyst would care to know how much money the company would earn if EBITDA is not taken into consideration However, interest, tax, depreciation and amortization are inevitable expenses that must be considered by the company, and it could be argued that EBITDA is not a helpful indicator of profitability. 105 Table 8. Comparison of margin of profitability   Company Industry Sector S&P 500 Gross Margin (TTM) 35.93 2.26 8.64 37.05 Gross Margin - 5 Yr. Avg. 37.74 23.36 24.05 36.80 EBITD Margin (TTM) 5.84 -- -- -- EBITD - 5 Yr. Avg 8.24 8.87 13.04 21.08 Operating Margin (TTM) 3.85 0.33 2.83 -- Operating Margin - 5 Yr. Avg. 6.19 2.65 8.30 18.29 Pre-Tax Margin (TTM) 4.66 0.40 1.56 15.41 Pre-Tax Margin - 5 Yr. Avg. 7.14 3.45 9.01 18.05 Net Profit Margin (TTM) 3.52 0.30 0.39 11.25 Net Profit Margin - 5 Yr. Avg. 5.23 1.96 5.76 12.69 Effective Tax Rate (TTM) 24.50 1.45 13.82 26.64 Effective Tax Rate - 5 Yr. Avg. 26.68 27.66 40.50 30.32 Source: Reuters a. Management Effectiveness ROA measures a company’s earnings in relation to all the resources it had (the shareholders’ capital plus the borrowed funds the expected gain (or loss) of an investor. Table 9 shows how Easy Jet fared with its competitors with respect to ROA, ROI and ROE 45 Table 9. Comparison of Returns   Company Industry Sector S&P 500 Return on Assets (TTM) 2.96 0.19 1.44 8.14 Return on Assets - 5 Yr. Avg. 4.40 1.47 3.47 7.54 Return on Investment (TTM) 4.08 0.26 2.31 11.15 Return on Investment - 5 Yr. Avg. 5.88 2.06 5.32 10.06 Return on Equity (TTM) 6.85 -0.04 4.83 20.37 Return on Equity - 5 Yr. Avg. 8.94 6.57 10.47 20.43 Source: Reuters b. Efficiency Receivable turnover is the efficiency of collection policy. .(Farflex) A too low receivable turnover indicates leniency of credit policy. Easy Jet shows high receivable turnover comparable with S&P 500[ 29] Table 10. Comparison of turn over   Company Industry Sector S&P 500 Revenue/Employee (TTM) -- 141,322 21,978,833 862,606 Net Income/Employee (TTM) -- 6,689 1,112,917 92,457 Receivable Turnover (TTM) 10.26 1.92 1.51 11.13 Inventory Turnover (TTM) -- 11.64 2.52 9.39 Asset Turnover (TTM) 0.84 0.07 Source: Reuters V. A brief analysis of share prices of the company over the last 4 to 6 weeks. Easy Jet has been established in 1995, listed in the London Stock Exchange in November 2000 and had a successful flotation in the stock market. As of January 2, 2009, listed share price is 280.250. Trade volume at this price as of December 31 is 280,774.07. Annex 1 shows the historical prices of stock exchange transactions of Easy Jet. London Stock Exchange reports show Price change of +5.50 and a percent change of +2.00% (Reuters) However, latest analysis in the stock market show a “Hold” recommendation to Easy Jet as shown below. 92 Analyst Recommendations Source: Reuters Table XI. Consensus recommendations of analysts Estimates Consensus Recommendation Hold EPS Est. (Current Period) -- EPS Est. (Current Year) 24.56  Source Reuters Discussion and conclusion. a. Comparison of firm’s performance over time, (5 years) showed continued growth in revenue and sales for Easy Jet. Asset growth was seen thru acquisition of additional fleet. Cash flows are more than the net income which is a healthy sign of liquidity and efficiency in management. 47 b. Comparing between firms of differing size in the industry. Performance of Easy Jet has been compared with the industry, sector and S&R 500. The return on assets, equity and receivables all point to the positive side showing efficiency of financial management of the company. 44 c. Key relationship by relating inputs (costs) with outputs ( benefits) The margin of profitability indicates more benefits are derived from inputs as the net profit margin is higher than the industry and sector next only to S & R 500 companies. EasyJet has not declared dividend for 5 years of operation, and showed negative growth in earnings.. Analysts who are experts in the stock market trading have recommended “hold” to Easy Jet. It is possible that cash from operations and earnings are flowed back to operation to realize more profit. There are indications of profitability in investment in Easy Jet, but until such time that management makes sound policy on dividends and growth earnings, investment in Easy Jet is a speculative buy and exposed to risks. As an investor, one will have to think twice before investing in Easy Jet as there are other companies available for investment. 149 LIST OF TABLES 1. Easy Jet Quick Ratio Analysis 2 2. Comparative current ratio analysis 3 3. Debt to equity analysis 3 4. Comparison of debt/equity with competitors 4 5. Comparison of price-earning ratio 5 6. Comparison of dividend yield 6 7. Comparison of growth rates 7 8. Comparison of table of profitability 8 9. Comparison of returns 9 10. Consensus of recommendation of Analysts 10 Annexes Annex 1. Table of Formula and calculations 1. EPS = Net Income-Dividends on Pref. Stock/Ave. Outstanding shares 2. Quick Ratio = (Cash + Cash Equiv. + Accts. Receivable) /Current Liabilities 3. Current Ratio = Current Assets / Current Liabilities 4. Debt to Equity = Total Liabilities / Stockholders’ Equity 5. P/E = Stock’s market capitalization / after-tax earnings over a 12 month period TTM 6 Gross margin = (gross revenue-cost of sales) x 100 / Cost of sales 7. Price to sales ratio is calculated by the stocks capitalization divided by its sales over the trailing 12 months. Source: Business Directory.com Annex 2. Annual Income Statement Top of Form View: AnnualInterim Bottom of Form In Millions of British Pounds (except for per share items) 2008 2008-09-30 Period Length 12 Months 2007 2007-09-30 Period Length 12 Months 2006 2006-09-30 Period Length 12 Months 2005 2005-09-30 Restated 2006-03-31 Period Length 12 Months 2004 2004-09-30 Period Length 12 Months Revenue 2,362.8 1,797.2 1,619.7 1,341.4 1,091.0 Other Revenue, Total -- -- -- -- -- Total Revenue 2,362.8 1,797.2 1,619.7 1,341.4 1,091.0 Cost of Revenue, Total 1,513.8 1,029.2 911.5 729.4 929.3 Gross Profit 849.0 768.0 708.2 612.0 161.7 Selling/General/Admin. Expenses, Total 567.9 432.2 440.2 411.9 111.2 Research & Development -- -- -- -- -- Depreciation/Amortization 46.9 34.2 28.2 16.6 -- Interest Expense, Net - Operating -- -- -- -- -- Interest/Investment Income - Operating -- -- -- -- (0.2) Interest Expense(Income) - Net Operating -- -- -- -- (0.2) Unusual Expense (Income) 12.9 (10.6) 0.0 -- 0.0 Other Operating Expenses, Total 130.3 129.6 122.0 117.3 -- Total Operating Expense 2,271.8 1,614.6 1,501.9 1,275.2 1,040.3 Operating Income 91.0 182.6 117.8 66.2 50.7 Interest Expense, Net Non-Operating (34.0) (35.4) (24.1) (10.9) (2.7) Interest/Invest Income - Non-Operating 53.2 54.7 35.5 27.3 14.2 Interest Income(Exp), Net Non-Operating 19.2 19.3 11.4 16.4 11.5 Gain (Loss) on Sale of Assets -- -- -- -- -- Other, Net -- -- -- -- -- Net Income Before Taxes 110.2 201.9 129.2 82.6 62.2 Provision for Income Taxes 27.0 49.6 35.1 23.6 21.1 Net Income After Taxes 83.2 152.3 94.1 59.0 41.1 Minority Interest -- -- -- -- -- Equity In Affiliates -- -- -- -- -- U.S. GAAP Adjustment -- -- -- -- -- Net Income Before Extra. Items 83.2 152.3 94.1 59.0 41.1 Accounting Change -- -- -- -- -- Discontinued Operations -- -- -- -- -- Extraordinary Item -- -- -- -- -- Tax on Extraordinary Items -- -- -- -- -- Net Income 83.2 152.3 94.1 59.0 41.1 Preferred Dividends -- -- -- -- -- General Partners Distributions -- -- -- -- -- Miscellaneous Earnings Adjustment -- -- -- -- -- Pro Forma Adjustment -- -- -- -- -- Interest Adjustment - Primary EPS -- -- -- -- -- Income Available to Com Excl ExtraOrd 83.2 152.3 94.1 59.0 41.1 Income Available to Com Incl ExtraOrd 83.2 152.3 94.1 59.0 41.1 Basic Weighted Average Shares 419.40 416.00 405.70 399.30 397.70 Basic EPS Excluding Extraordinary Items 0.198 0.366 0.232 0.148 0.103 Basic EPS Including Extraordinary Items 0.198 0.366 0.232 0.148 0.103 Dilution Adjustment -- -- -- 0.0 0.0 Diluted Weighted Average Shares 428.87 428.20 415.40 408.90 406.40 Diluted EPS Excluding ExtraOrd Items 0.194 0.356 0.227 0.144 0.101 Diluted EPS Including ExtraOrd Items 0.194 0.356 0.227 0.144 0.101 DPS - Common Stock Primary Issue 0.000 0.000 0.000 0.000 0.000 Gross Dividends - Common Stock 0.0 0.0 0.0 0.0 0.0 Total Special Items 12.9 (10.6) 0.0 -- 17.1 Normalized Income Before Taxes 123.1 191.3 129.2 82.6 79.3 Effect of Special Items on Income Taxes 3.2 (2.6) 0.0 -- 0.0 Inc Tax Ex Impact of Sp Items 30.2 47.0 35.1 23.6 21.1 Normalized Income After Taxes 92.9 144.3 94.1 59.0 58.2 Normalized Inc. Avail to Com. 92.9 144.3 94.1 59.0 58.2 Basic Normalized EPS 0.222 0.347 0.232 0.148 0.146 Diluted Normalized EPS 0.217 Source: Reuters Annual Cash Flow Statement Top of Form View: AnnualInterim Bottom of Form In Millions of British Pounds (except for per share items) 2008 2008-09-30 Period Length 12 Months 2007 2007-09-30 Period Length 12 Months 2006 2006-09-30 Reclassified 2007-09-30 Period Length 12 Months 2005 2005-09-30 Reclassified 2006-03-31 Period Length 12 Months 2004 2004-09-30 Period Length 12 Months Net Income/Starting Line 83.2 152.3 94.1 59.0 50.5 Depreciation/Depletion 44.4 33.3 27.4 15.8 25.3 Amortization 2.5 0.9 0.8 0.8 17.1 Deferred Taxes -- -- -- -- -- Non-Cash Items 14.4 8.0 18.2 14.2 0.0 Changes in Working Capital 151.7 76.3 84.7 157.2 74.0 Cash from Operating Activities 296.2 270.8 225.2 247.0 166.9 Capital Expenditures (330.4) (275.5) (325.1) (238.4) (370.4) Other Investing Cash Flow Items, Total (87.2) 3.4 10.8 75.7 316.7 Cash from Investing Activities (417.6) (272.1) (314.3) (162.7) (53.7) Financing Cash Flow Items 4.5 (214.5) 96.8 (14.2) 0.0 Total Cash Dividends Paid -- -- -- -- -- Issuance (Retirement) of Stock, Net 6.9 16.5 17.9 2.0 9.0 Issuance (Retirement) of Debt, Net (5.5) 69.1 169.8 99.3 57.5 Cash from Financing Activities 5.9 (128.9) 284.5 87.1 66.5 Foreign Exchange Effects 28.6 (11.4) (1.7) (0.4) -- Net Change in Cash (86.9) (141.6) 193.7 Source: Reuters Annual Balance Sheet Top of Form View: AnnualInterim Bottom of Form In Millions of British Pounds (except for per share items) 2008 2008-09-30 2007 2007-09-30 2006 2006-09-30 Restated 2007-09-30 2005 2005-09-30 Restated 2006-03-31 2004 2004-09-30 Cash -- -- -- -- -- Cash & Equivalents 632.2 719.1 860.7 667.0 510.3 Short Term Investments 96.5 14.4 1.0 6.1 -- Cash and Short Term Investments 728.7 733.5 861.7 673.1 510.3 Accounts Receivable - Trade, Net 467.2 361.8 128.0 103.7 99.2 Notes Receivable - Short Term -- -- -- -- -- Receivables - Other -- 25.0 58.3 54.5 29.0 Total Receivables, Net 467.2 386.8 186.3 158.2 128.2 Total Inventory -- -- -- -- -- Prepaid Expenses -- 30.2 40.9 52.5 46.2 Other Current Assets, Total 219.1 15.9 12.2 7.1 0.0 Total Current Assets 1,415.0 1,166.4 1,101.1 890.9 684.7 Property/Plant/Equipment, Total - Gross 1,216.9 1,022.4 752.1 435.8 391.8 Accumulated Depreciation, Total (114.3) (86.6) (56.4) (37.2) (61.4) Property/Plant/Equipment, Total - Net 1,102.6 935.8 695.7 398.6 330.4 Goodwill, Net 359.8 309.6 309.6 309.6 309.6 Intangibles, Net 80.6 1.8 1.1 1.4 -- Long Term Investments 21.3 0.3 0.7 0.2 0.2 Note Receivable - Long Term 12.0 11.1 0.0 -- -- Other Long Term Assets, Total 104.5 91.4 81.2 29.1 -- Other Assets, Total -- -- -- -- -- Total Assets 3,095.8 2,516.4 2,189.4 1,629.8 1,324.9 Accounts Payable 653.0 39.6 31.5 6.6 17.6 Payable/Accrued -- -- -- -- -- Accrued Expenses -- 192.3 190.4 159.1 116.6 Notes Payable/Short Term Debt 76.0 26.6 15.3 0.0 0.0 Current Port. of LT Debt/Capital Leases 56.7 40.5 32.8 16.3 9.7 Other Current liabilities, Total 124.1 322.3 252.9 232.5 170.8 Total Current Liabilities 909.8 621.3 522.9 414.5 314.7 Long Term Debt 570.5 395.9 351.7 201.0 110.1 Capital Lease Obligations -- 89.0 100.0 0.0 -- Total Long Term Debt 570.5 484.9 451.7 201.0 110.1 Total Debt 703.2 552.0 499.8 217.3 119.8 Deferred Income Tax 108.1 35.0 32.0 22.2 20.2 Minority Interest -- -- -- -- -- Other Liabilities, Total 229.2 222.8 199.9 128.7 90.5 Total Liabilities 1,817.6 1,364.0 1,206.5 766.4 535.5 Redeemable Preferred Stock, Total -- -- -- -- -- Preferred Stock - Non Redeemable, Net -- -- -- -- -- Common Stock, Total 105.7 104.8 102.6 100.1 99.8 Additional Paid-In Capital 640.2 633.9 591.4 557.2 554.2 Retained Earnings (Accumulated Deficit) 532.2 413.7 288.9 206.1 135.4 Treasury Stock - Common -- -- -- -- -- ESOP Debt Guarantee -- -- -- -- -- Unrealized Gain (Loss) -- -- -- -- -- Other Equity, Total 0.1 0.0 -- -- -- Total Equity 1,278.2 1,152.4 982.9 863.4 789.4 Total Liabilities & Shareholders Equity 3,095.8 2,516.4 2,189.4 1,629.8 1,324.9 Shares Outs - Common Stock Primary Issue 423.13 419.10 410.50 400.40 399.20 Shares Outstanding - Common Issue 2 -- -- -- -- -- Shares Outstanding - Common Issue 3 -- -- -- -- -- Shares Outstanding - Common Issue 4 -- -- -- -- -- Total Common Shares Outstanding 423.13 419.10 410.50 400.40 399.20 Total Preferred Shares Outstanding -- -- -- -- - Source: Reuters Annex 3. Financial Strength   Company Industry Sector S&P 500 Quick Ratio (MRQ) 1.56 0.92 1.40 1.03 Current Ratio (MRQ) 1.56 1.03 1.78 1.27 LT Debt to Equity (MRQ) 44.63 121.39 73.63 107.05 Total Debt to Equity (MRQ) 55.01 149.18 108.60 152.47 Interest Coverage (TTM) -- 0.04 0.73 17.19 Source: Reuters Annex 4 Historical Prices of Easy Jet (Yahoo Finance) http://uk.finance.yahoo.com/q/hp?s=EZJ.L PRICES Date Open High Low Close Volume Adj Close* 31-Dec-08 282.50 282.50 275.25 280.25 362,100 280.25 30-Dec-08 276.25 283.00 271.25 274.75 556,500 274.75 29-Dec-08 282.25 282.25 271.50 273.25 1,027,000 273.25 24-Dec-08 266.75 281.75 263.25 281.75 256,100 281.75 23-Dec-08 266.75 277.25 265.50 266.75 990,100 266.75 22-Dec-08 255.25 270.00 252.00 266.75 1,347,300 266.75 19-Dec-08 269.50 269.50 250.25 250.25 3,774,900 250.25 18-Dec-08 264.75 271.00 262.50 262.75 3,067,900 262.75 17-Dec-08 269.00 272.00 261.25 262.50 1,978,900 262.50 16-Dec-08 275.00 275.00 257.25 263.50 2,617,100 263.50 15-Dec-08 276.25 282.00 264.00 266.00 3,057,400 266.00 12-Dec-08 281.50 282.75 265.00 269.25 4,270,900 269.25 11-Dec-08 315.00 315.00 284.50 287.00 2,577,100 287.00 10-Dec-08 305.50 308.50 287.75 307.50 1,349,100 307.50 9-Dec-08 293.25 315.00 281.25 308.00 2,312,700 308.00 8-Dec-08 275.50 300.00 271.00 299.00 3,909,100 299.00 5-Dec-08 273.00 273.00 250.00 265.25 2,792,800 265.25 4-Dec-08 273.50 286.25 261.75 273.00 2,386,000 273.00 3-Dec-08 260.00 274.75 254.00 272.25 1,509,100 272.25 2-Dec-08 256.50 281.50 241.50 260.75 2,969,700 260.75 1-Dec-08 276.00 279.75 255.25 260.25 1,779,900 260.25 28-Nov-08 267.25 282.50 264.25 275.00 1,867,700 275.00 27-Nov-08 258.25 272.00 249.50 269.00 1,376,100 269.00 26-Nov-08 253.50 271.75 249.00 261.00 2,906,800 261.00 25-Nov-08 265.00 270.75 245.25 263.50 2,760,200 263.50 24-Nov-08 255.00 267.00 247.00 266.00 2,779,600 266.00 21-Nov-08 243.75 262.50 234.75 256.00 3,672,200 256.00 20-Nov-08 217.25 245.00 213.00 232.25 5,342,700 232.25 19-Nov-08 255.00 255.00 206.25 220.25 4,764,900 220.25 18-Nov-08 273.25 274.00 215.00 251.00 8,026,700 251.00 17-Nov-08 270.00 280.00 254.50 276.50 3,248,600 276.50 14-Nov-08 293.25 297.25 257.25 266.00 4,742,000 266.00 13-Nov-08 263.25 289.00 263.00 279.50 2,491,900 279.50 12-Nov-08 297.25 302.75 250.00 264.00 2,998,700 264.00 11-Nov-08 303.25 306.50 276.25 283.25 2,140,200 283.25 10-Nov-08 312.75 317.00 291.50 294.50 2,290,100 294.50 7-Nov-08 321.25 335.25 294.50 299.50 2,197,200 299.50 6-Nov-08 300.75 328.50 297.75 316.50 2,581,500 316.50 5-Nov-08 320.00 320.00 297.25 305.50 3,445,800 305.50 4-Nov-08 300.25 319.75 299.75 317.50 2,318,600 317.50 3-Nov-08 313.50 313.50 287.50 294.75 2,849,000 294.75 31-Oct-08 315.00 319.50 284.25 308.00 3,497,800 308.00 30-Oct-08 297.25 316.50 285.00 316.50 2,611,000 316.50 29-Oct-08 282.50 287.75 268.50 286.00 1,993,600 286.00 28-Oct-08 276.25 280.25 243.50 268.00 2,441,600 268.00 27-Oct-08 265.00 275.75 248.50 266.25 1,720,600 266.25 24-Oct-08 278.50 280.00 240.25 273.50 3,004,900 273.50 23-Oct-08 297.00 317.25 280.75 287.00 2,737,200 287.00 22-Oct-08 311.75 314.00 299.00 312.50 2,393,300 312.50 21-Oct-08 317.00 329.75 300.00 313.00 1,653,800 313.00 20-Oct-08 322.00 322.25 301.00 311.25 2,813,200 311.25 17-Oct-08 318.75 327.75 304.25 317.00 3,199,200 317.00 16-Oct-08 298.75 315.00 281.25 306.25 2,624,700 306.25 15-Oct-08 325.00 327.25 300.00 309.00 2,311,700 309.00 14-Oct-08 328.00 352.75 301.75 320.00 1,893,100 320.00 13-Oct-08 300.00 322.00 300.00 319.50 2,611,500 319.50 10-Oct-08 280.25 309.50 280.25 302.00 3,388,300 302.00 9-Oct-08 307.50 317.25 297.75 304.75 1,316,200 304.75 8-Oct-08 279.75 324.25 270.00 302.00 3,526,200 302.00 7-Oct-08 312.00 319.50 284.00 294.25 5,761,300 294.25 6-Oct-08 319.75 332.00 301.25 305.00 1,974,100 305.00 3-Oct-08 324.25 333.25 311.00 327.50 3,058,100 327.50 2-Oct-08 314.75 328.25 308.00 322.00 3,224,400 322.00 1-Oct-08 317.25 326.00 305.75 314.75 2,814,300 314.75 30-Sep-08 286.00 336.75 282.75 315.00 5,431,000 315.00 29-Sep-08 339.75 339.75 295.00 304.25 4,749,000 304.25 * Close price adjusted for dividends and splits. List of References Definitions. Business Directory.com [on line] Available from Retrieved 01 Jan. 2009 Easy Jet. In Wikepedia. The Free Enclyclopedia. [on line] Available from: http://en.wikipedia.org/wiki/EasyJet Retrieved 01 Jan. 2009. Estimates for Easy Jet Plc. 01 Jan. 2009. Reuters [on line] Available from http://www.reuters.com/fieasyJet mission Retrieved 01 Jan. 2009 Historical Prices of Easy Jet. 01 Jan. 2009. Yahoo Finance [on line] Available from http://uk.finance.yahoo.com/q/hp?s=EZJ.L Retrieved 02 Jan. 2009 Press releases for Easy Jet. Reuters. [on line] Available from http://www.reuters.com/finance/stocks/pressReleases?symbol=EZJ.L Retrieved 02, 2009. Definitions. Farflex. The Free Dictionary [online] Available from http://www.thefreedictionary.com/ Retrieved 03 Jan. 2009 Price to Sales Ratio. Definition. Morning.star.com [on line] Available from Retrieved 01 Jan. 2009 Stock Market Investing for beginners. 07 Sept. 2008. [on line] Available from http://beginnersstockinvesting.blogspot.com/2008/09/quick-ratio-formula.html Retrieved 31 Dec. 2008. . http://www.reuters.com/finance/stocks/pressReleases?symbol=EZJ.L http://www.reuters.com/finance/stocks/estimates?symbol=EZJ.L Read More
Cite this document
  • APA
  • MLA
  • CHICAGO
(Investment Analysis of Easy Jet Airline Company Case Study, n.d.)
Investment Analysis of Easy Jet Airline Company Case Study. https://studentshare.org/finance-accounting/1719463-financial-accounting
(Investment Analysis of Easy Jet Airline Company Case Study)
Investment Analysis of Easy Jet Airline Company Case Study. https://studentshare.org/finance-accounting/1719463-financial-accounting.
“Investment Analysis of Easy Jet Airline Company Case Study”. https://studentshare.org/finance-accounting/1719463-financial-accounting.
  • Cited: 0 times

CHECK THESE SAMPLES OF Investment Analysis of Easy Jet Airline Company

Virgin Airlines' Failure in Different Countries

The company was in the exploratory process to merge with the SN Brussels to recover its status, but failed after the 9/11 attack.... The company had to face severe competition from the rival airlines such as Ryanair and Easyjet.... Introduction Virgin Blue airline under the guidance of Sir Richard Branson was launched in the year 2000.... The motive of the airline was to provide a low fare carrier to the people of Australia.... The Virgin Blue airline demonstrated the success story in the airline industry in the short run....
17 Pages (4250 words) Assignment

An Audit of the Business Environment of Royal Bengal Airlines

As a result company takes economical (in the side of currency sharing) and technological advantage here.... The growth in the Asian economy, in particular the travel sector within Southeast Asia, has created an opportunity in the market for a new airline.... RBA was born as a direct result of this, with the aim of utilizing the potential development of the Asian market and turning this into a profitable and successful airline venture.... These are thoroughly given below:Supplier Power: It assesses how easy it is for suppliers to drive up prices....
6 Pages (1500 words) Essay

Strategy and Competition of Swissair

nbsp;The SWOT analysis of the company shows that while the strengths of the business were exploited, the weaknesses and were not accounted for and those weaknesses eventually led to the threats to the company becoming realities.... The plans which were made to bring Swissair to the top of the pile essentially led to the downfall of the company.... The rapid expansion which was supposed to bring Swissair out of its financial worries only served to make the situation worse eventually leading to liquidity problems for the company....
6 Pages (1500 words) Essay

Marketing- Mission statement

The company's name is the selling point that it… For the sake of this paper it is the mission statement that shall be dwelled in more in order to establish the competitive edge that a company can have in using it as a selling point.... It is also important to highlight that the er in doing so shall take a real life situation and an internationally known company to analyse how it has used its mission statement in the various marketing management strategies and tactics....
11 Pages (2750 words) Essay

Dubai International airport

In the Middle East, this is the major airline company with over 2500 flights weekly to over 100 destinations in six continents in 74 countries (Emirate airline, 2005).... The answers derived will be written down to be used for analysis of the information gained.... Dubai International airport is the headquarters of Emirates airline organization, in the United Arab Emirates.... The main aim of this research proposal is to try to investigate the influence and effects that Emirates airline organization has had on the world's airlines in terms of quality of services offered....
4 Pages (1000 words) Essay

Is Thai Airways Going to Bankruptcy

In this study, the aim is to conduct a comprehensive analysis of the company finances and situation to establish the basis of bankruptcy claims and probabilities.... The government undertook a conjoined investment alongside Thai Air company (TAC), a Thailand domestic air carrier, and the Scandinavian Airlines System… The investment was introduced in the capital market with SAS owning 30%, while TAC owned the rest.... 3% of the company's shareholdings, while the remaining 48....
11 Pages (2750 words) Research Paper

Challenges Faced by the Apple Company

"Challenges Faced by the Apple company" paper analizes the evolution of the Apple Computer was one of the most notable in the history of the computer industry.... hellip; The dropping of the word computer from the company's name is one of the best ways to guide the thinking of the public that Apple Inc.... Since the public is already prepared for the change in the product line of the company, it will be easier for the public to accept the new products from Apple, Inc....
6 Pages (1500 words) Case Study

The Traditional Airline Industry

… Low-Cost AirlinesIntroduction “In 2001, while most traditional players reported losses and some succumbed to the competition, Europe's leading low-cost carriers were more than merely profitable: Ryanair and easy jet boasted operating margins of 26 Low-Cost AirlinesIntroduction “In 2001, while most traditional players reported losses and some succumbed to the competition, Europe's leading low-cost carriers were more than merely profitable: Ryanair and easy jet boasted operating margins of 26 and 9....
10 Pages (2500 words) Essay
sponsored ads
We use cookies to create the best experience for you. Keep on browsing if you are OK with that, or find out how to manage cookies.
Contact Us