StudentShare

Our website is a unique platform where students can share their papers in a matter of giving an example of the work to be done. If you find papers
matching your topic, you may use them only as an example of work. This is 100% legal. You may not submit downloaded papers as your own, that is cheating. Also you
should remember, that this work was alredy submitted once by a student who originally wrote it.
✕
Free
Financial Ratios for British Airways - Essay Example
Summary
In the paper “Financial Ratios for British Airways” the author discusses the Liquidity Position of Easy Jet, which is better than that of British Airways. Its current, as well as quick ratios, are both better than that of BA. Easy Jet has the advantage over the BA…
- Subject: Finance & Accounting
- Type: Essay
- Level: Undergraduate
- Pages: 4 (1000 words)
- Downloads: 0
- Author: iondricka
Extract of sample "Financial Ratios for British Airways"
Financial Ratios British Airways (Financial Ratios for the year 2005 & 2006)
Current Ratio
1.0 times
1.1 times
Quick Ratio
0.9 times
1.0 times
Debt to Total Assets
76.3%
84.7%
Times Interest Earned
4.3 times
8.3 times
Inventory Turnover *
82.79 times
209.9 times
Ave. Collection Period *
51.5 days
14.4 days
Fixed Assets Turnover *
0.9 times
2.0 times
Total Assets Turnover *
0.7 times
1.4 times
Profit Margin on Sales
3.4%
5.5%
Return on Total Assets *
2.3%
7.8%
Return on Net Worth *
9.7%
51.3%
Easy Jets ( Financial Ratios for the year 2005 & 2006)
Current Ratio
2.1 times
2.1 times
Quick Ratio
2.1 times
2.1 times
Debt to Total Assets
47.0%
53.7%
Times Interest Earned
8.5 times
6.4 times
Inventory Turnover *
0
0
Ave. Collection Period *
57.3 days
24.0 days
Fixed Assets Turnover *
1.8 times
3.1 times
Total Assets Turnover *
0.8 times
1.5 times
Profit Margin on Sales
4.4%
5.8%
Return on Total Assets *
3.6%
8.9%
Return on Net Worth *
6.8%
19.1%
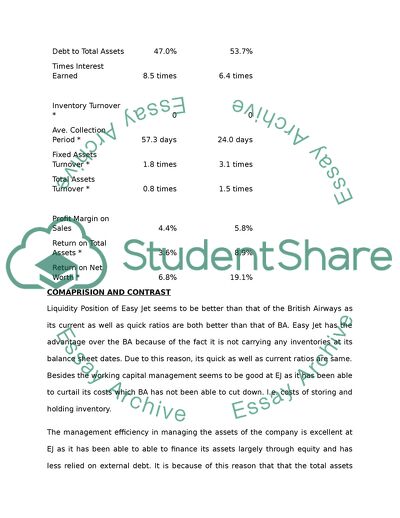
COMAPRISION AND CONTRAST
Liquidity Position of Easy Jet seems to be better than that of the British Airways as its current as well as quick ratios are both better than that of BA. Easy Jet has the advantage over the BA because of the fact it is not carrying any inventories at its balance sheet dates. Due to this reason, its quick as well as current ratios are same. Besides the working capital management seems to be good at EJ as it has been able to curtail its costs which BA has not been able to cut down. I.e. costs of storing and holding inventory.
The management efficiency in managing the assets of the company is excellent at EJ as it has been able to able to finance its assets largely through equity and has less relied on external debt. It is because of this reason that that the total assets financed through debt is just 47% and 53% in 2005 & 2006 as compared to BA whose ratio of debt to assets have shown an increase i.e. from 76% to 83%. This not only impairs the management’s ability to effectively manage the assets but also significantly reduce the profits since higher proportion of returns goes to debt servicing. In 2006, BA has been able to greatly able to lessen its cost of goods sold. This also seems to be the reason behind recording higher interest covered ratio in 2006 as compared to EJ- a move showing BA’s management attitude to concentrate on cost cutting. In 2006 BA somewhat seems to be in driving seat as for as controlling and efficient management of the assets. Inventory turnover has greatly increased showing efficient management of inventories. EJ due to enjoying no inventory, do not have any inventory turnover ratio. Collection efforts of both the companies seem to be inline with each other.
As for as the profit margins are concerned, BA still is enjoying higher margins despite the claims made by EJ that it enjoys low cost.
Overall, Shareholders of BA are better off than the shareholders of EJ since they enjoyed higher returns on their investments during the period.
APPENDIX
British Airways
BA-5
BA-6
CASH
147
1,591
MARKETABLE SECURITIES
0
0
INVENTORY
159
146
ACCOUNTS RECEIVABLE
2,034
1,202
OTHER, MISCELLANEOUS
3,026
3,493
CURRENT ASSETS
5,366
6,432
FIXED ASSETS (NET)
16,023
14,926
TOTAL ASSETS
21,389
21,358
CURRENT LIABILITIES
5,623
6,021
LONG-TERM LIAB.
10,702
12,072
TOTAL LIABILITIES
16,325
18,093
SHs EQUITY (NET WORTH)
5,064
3,265
TOTAL EQUITIES
21,389
21,358
Statement, no. of months:
12
6
NET SALES
14,411
15,283
COST OF GOODS SOLD
13,163
2,929
GROSS PROFIT
1,249
12,354
OPERATING EXPENSES
252
11,089
GROSS OPERATING INCOME
997
1,265
DEPRECIATION
0
0
NET OPERATING INCOME
997
1,265
OTHER INCOME
0
0
GROSS INCOME
997
1,265
OTHER EXPENSES
0
0
INTEREST EXPENSES
232
153
NET INCOME BEFORE TAXES
765
1,113
INCOME TAX
275
275
NET INC. BEFORE DIVIDENDS
490
838
Current Ratio
1.0 times
1.1 times
Quick Ratio
0.9 times
1.0 times
Debt to Total Assets
76.3%
84.7%
Times Interest Earned
4.3 times
8.3 times
Inventory Turnover *
90.9 times
209.9 times
Ave. Collection Period *
51.5 days
14.4 days
Fixed Assets Turnover *
0.9 times
2.0 times
Total Assets Turnover *
0.7 times
1.4 times
Profit Margin on Sales
3.4%
5.5%
Return on Total Assets *
2.3%
7.8%
Return on Net Worth *
9.7%
51.3%
EJ-5
EJ-6
CASH
667
861
MARKETABLE SECURITIES
6
13
INVENTORY
0
0
ACCOUNTS RECEIVABLE
211
213
OTHER, MISCELLANEOUS
7
0
CURRENT ASSETS
891
1,087
FIXED ASSETS (NET)
739
1,036
TOTAL ASSETS
1,630
2,124
CURRENT LIABILITIES
415
509
LONG-TERM LIAB.
352
632
TOTAL LIABILITIES
766
1,141
SHs EQUITY (NET WORTH)
863
983
TOTAL EQUITIES
1,630
2,124
2005
2006
NET SALES
1,341
1,620
COST OF GOODS SOLD
1,135
1,341
GROSS PROFIT
206
279
OPERATING EXPENSES
0
0
GROSS OPERATING INCOME
206
279
DEPRECIATION
140
161
NET OPERATING INCOME
66
118
OTHER INCOME
27
35
GROSS INCOME
93
153
OTHER EXPENSES
0
0
INTEREST EXPENSES
11
24
NET INCOME BEFORE TAXES
82
129
INCOME TAX
24
35
NET INC. BEFORE DIVIDENDS
58
94
Current Ratio
2.1 times
2.1 times
Quick Ratio
2.1 times
2.1 times
Debt to Total Assets
47.0%
53.7%
Times Interest Earned
8.5 times
6.4 times
Inventory Turnover *
#DIV/0!
#DIV/0!
Ave. Collection Period *
57.3 days
24.0 days
Fixed Assets Turnover *
1.8 times
3.1 times
Total Assets Turnover *
0.8 times
1.5 times
Profit Margin on Sales
4.4%
5.8%
Return on Total Assets *
3.6%
8.9%
Return on Net Worth *
6.8%
19.1%
British Airways
Ratios for 2005
In Million
Ratio
Formulae
Amount
Amount
Ratio
Current ratio
Current Asset/Current Liabilities
5366
5623
0.95
Quick Ratio
(Current Assets-Inventory)/Current Liabilities
5207
5623
0.93
Debt to total assets
Total Debt/Total Assets
16325
21389
76.32%
Times Interest Earned
Operating Profit/Interest
997
232
4.30
Inventory Turnover
COGS/Inventory
13163
159
82.79
Av.Collection Period
(Recievables/sales/365)
2034
14411
51.52
Fixed Asset Turnover
Sales/Fixed Assets
14411
16023
0.90
Total Asset Turnover
Sales/Total Assets
14411
21389
0.67
Profit Margin on sales
Net Income/Sales
490
14411
3.40%
Return on total assets
Net Income/Total Assets
490
21389
2.29%
Return on Networth
Net Income/Equity
490
5064
9.68%
Ratios for 2006
In Million
Ratio
Formulae
Amount
Amount
Ratio
Current ratio
Current Asset/Current Liabilities
6432
6021
1.07
Quick Ratio
(Current Assets-Inventory)/Current Liabilities
6286
6021
1.04
Debt to total assets
Total Debt/Total Assets
18093
21358
84.71%
Times Interest Earned
Operating Profit/Interest
1265
153
8.27
Inventory Turnover
COGS/Inventory
2929
146
20.06
Av.Collection Period
(Recievables/sales/365)
1202
15283
28.71
Fixed Asset Turnover
Sales/Fixed Assets
15283
14926
1.02
Total Asset Turnover
Sales/Total Assets
15283
21358
0.72
Profit Margin on sales
Net Income/Sales
838
15283
5.48%
Return on total assets
Net Income/Total Assets
838
21358
3.92%
Return on Networth
Net Income/Equity
838
5064
16.55%
EASY JET
Ratios for 2005
In Million
Ratio
Formulae
Amount
Amount
Ratio
Current ratio
Current Asset/Current Liabilities
891
415
2.15
Quick Ratio
(Current Assets-Inventory)/Current Liabilities
891
415
2.15
Debt to total assets
Total Debt/Total Assets
766
1630
46.99%
Times Interest Earned
Operating Profit/Interest
66
11
6.00
Inventory Turnover
COGS/Inventory
1135
0
0.00
Av.Collection Period
(Recievables/sales/365)
211
1341
57.43
Fixed Asset Turnover
Sales/Fixed Assets
1341
739
1.81
Total Asset Turnover
Sales/Total Assets
1341
1630
0.82
Profit Margin on sales
Net Income/Sales
58
1341
4.33%
Return on total assets
Net Income/Total Assets
58
1630
3.56%
Return on Networth
Net Income/Equity
58
863
6.72%
Ratios for 2006
In Million
Ratio
Formulae
Amount
Amount
Ratio
Current ratio
Current Asset/Current Liabilities
1087
509
2.14
Quick Ratio
(Current Assets-Inventory)/Current Liabilities
1087
509
2.14
Debt to total assets
Total Debt/Total Assets
1141
2124
53.72%
Times Interest Earned
Operating Profit/Interest
118
24
4.92
Inventory Turnover
COGS/Inventory
1341
0
0.00
Av.Collection Period
(Recievables/sales/365)
213
1620
47.99
Fixed Asset Turnover
Sales/Fixed Assets
1620
1036
1.56
Total Asset Turnover
Sales/Total Assets
1620
2124
0.76
Profit Margin on sales
Net Income/Sales
94
1620
5.80%
Return on total assets
Net Income/Total Assets
94
2124
4.43%
Return on Networth
Net Income/Equity
94
983
9.56%
Read
More
sponsored ads
Save Your Time for More Important Things
Let us write or edit the essay on your topic
"Financial Ratios for British Airways"
with a personal 20% discount.
GRAB THE BEST PAPER
