StudentShare
Contact Us
Sign In / Sign Up for FREE
Search
Go to advanced search...
Free

Analysis of AMRs Financial Statements - Research Paper Example

Cite this document
Summary
This research paper "Analysis of AMR’s Financial Statements" assesses the impact of financing techniques, assesses various market alternatives such as bond and securities markets as alternatives to raising capital, and evaluates the impact of varying the levels of working capital…
Download full paper File format: .doc, available for editing
GRAB THE BEST PAPER95.7% of users find it useful
Analysis of AMRs Financial Statements
Read Text Preview

Extract of sample "Analysis of AMRs Financial Statements"

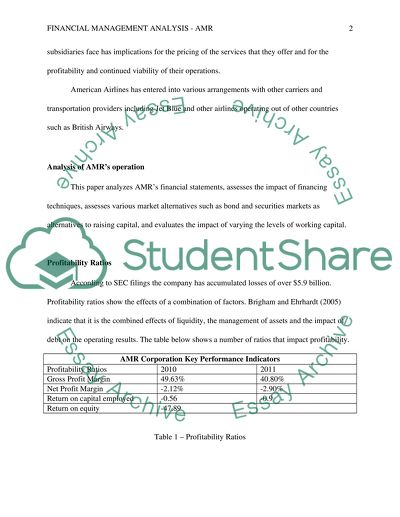
? Financial Management Analysis – AMR Introduction According to PHX Corporate documents filed with the Securities and Exchange Commission (SEC) indicates that AMR’s principal office is located in Forth Worth, Texas. The company which operates mainly in the airline industry was incorporated in October 1982. The corporation’s principal subsidiary is American Airlines, Inc. which was founded in 1934. At the end of 2010 American Airlines provided airline services to over 160 destinations throughout North America, the Caribbean, Asia, Latin America and Europe. AMR also has a wholly owned subsidiary American Eagle Holding Corporation (AMR Eagle). AMR Eagle owns two airlines – American Eagle Airlines and Executive Airlines. This two airlines operate as regional airlines and do business as American Eagle and are known as American Eagle Carriers (PHX Corporate 2011). These airlines act as feeders for American Airlines. Information provided by PHX Corporate (2011) indicates that American Airlines also have contractual arrangements with independently owned regional airlines which does business as American Connection. These operations consist of a fleet of approximately 900 aircraft which serves approximately 250 cities in some 50 countries with an average of approximately 3,400 flights daily. AMR through its airlines faces competition on its domestic route from Air Tran Airways, Alaska airlines, Continental Airlines, Delta Airlines, Frontier Airlines, Jet Blue, Hawaiian Airlines, Southwest Airlines, Spirit Airlines, United Airlines, US Airways, Virgin American Airlines and their affiliated regional carriers (PHX Corporate 2011). Other competitors that provide domestic transportation include ground and rail services. The competition that AMR’s subsidiaries face has implications for the pricing of the services that they offer and for the profitability and continued viability of their operations. American Airlines has entered into various arrangements with other carriers and transportation providers including Jet Blue and other airlines operating out of other countries such as British Airways. Analysis of AMR’s operation This paper analyzes AMR’s financial statements, assesses the impact of financing techniques, assesses various market alternatives such as bond and securities markets as alternatives to raising capital, and evaluates the impact of varying the levels of working capital. Profitability Ratios According to SEC filings the company has accumulated losses of over $5.9 billion. Profitability ratios show the effects of a combination of factors. Brigham and Ehrhardt (2005) indicate that it is the combined effects of liquidity, the management of assets and the impact of debt on the operating results. The table below shows a number of ratios that impact profitability. AMR Corporation Key Performance Indicators Profitability Ratios 2010 2011 Gross Profit Margin 49.63% 40.80% Net Profit Margin -2.12% -2.90% Return on capital employed -0.56 -0.9 Return on equity -47.89 Table 1 – Profitability Ratios Table 1 indicates that over 50% of the company’s revenue is spent on cost of sales resulting in gross profit margins of 49.63% for 2010 and 40.8% in 2011, which suggests an 8.8% reduction in the gross profit margin. These figures indicates increasing costs and would suggests that unless operating expenses can be reduced substantially the corporation will continue to make huge losses. The net profit is calculated by deducting AMR’s operational expenses from its gross profit and represents earnings before tax (EBT) as a percentage of revenues. Brigham and Ehrhardt (2005) indicate that this ratio indicates the profit per dollar of sales. In this case the figures are negative and indicate the losses generated for each dollar of sales. The information in Table 1 indicates that the net profit margins for the year 2010 and the current 2011 period are negative 2.12% and negative 2.90%. When combined with the information of the gross profit margins for both periods the information suggests that operating expenses declined and is therefore suggestive that operational expenses and cost of sales did not move in the same direction even though there was a 0.78% increase in the net loss margin. According to BPP (2009) it is virtually impossible to assess profits or growth in profits without relating them to the amount of funds (capital) that was utilized in making the profits. BPP (2009) further indicates that the most important profitability ratio is return on capital employed (ROCE). AMR’s ROCE indicates the company’s earnings before interest and tax (EBIT) as a percentage of the amount of capital that it has employed during the period analyzed. a measure of how efficiently the company’s assets have been utilized to generate revenue. It is made up of two ratios – the profit margin and the asset turnover rate. The net profit margin is a profitability ratio while the asset turnover ratio is an asset management ratio. Asset management ratios indicate how efficiently the company’s assets are being utilized. ROCE is negative for both periods and indicates that the assets have not been utilized efficiently. This coupled with the losses encountered by the company has resulted in a negative 0.56% return in 2010. The information calculated for 2011 is not applicable as it relates to a shorter time period which would not be comparable. According to Brigham and Ehrhardt (2005) the most important accounting ratio is ultimately the return on equity (ROE). The company’s ROE indicates how well it is utilizing shareholders capital. Based on financial information filed with the SEC shareholders equity was in deficit of $3,945 million in 2010 due to accumulated deficit $5,607 million which the company has accumulated over the past 5 years (PHX Corporate 2011). Information in the SEC filing also indicates that AMR’s earnings per share (EPS) though improving was a negative $1.41 in 2010. In the two previous years (2009 and 2008) the EPS was $4.99 and $8.16 respectively. Liquidity ratios Liquidity ratios indicate whether a company will be able to pay its debts as they fall due (Brigham & Ehrhardt (2005). Liquidity ratios provide an indication of the relationship between the company’s current assets and it current liabilities. The two widely used liquidity ratios are the current ratio and the quick ratio. The quick ratio takes the fact that some current assets such as inventory are not very liquid and would therefore takes some time to be converted into cash. The table below provides information on these two very important ratios for AMR Corporation. AMR Corporation’s Key Liquidity Ratios Liquidity Ratios 2010 2011 Current ratio 0.83 0.8 Quick ratio 0.68 0.60 Table 2 – Liquidity Ratios The information in Table 2 indicates that AMR will not be able to pay its debts as they fall due. The corporation’s current assets represented 83% of its current liabilities in 2010 and 80% in 2011. The quick ratio indicates that it will only be able to pay 60% of its current liabilities if it was called on to pay up those debts. According to PHX Corporate (2011) SEC filings indicate that AMR has operated historically with a working capital deficit and this is also true for many of the other airlines operating in the industry. SEC files also suggests that the company has been very reliant on using external financing to fund capital expenditure and most recently to fund operating losses, repayment of maturing debts and employee pension obligations. SEC filing further indicates that at December 31, 2010 the company had $4.5 billion in unrestricted cash and short-term investments and $450 million in restricted cash and shot-term investments at fair value. Long-term Solvency Ratio Banks and lenders are interested in these ratios. The two widely used ratios are the debt ratio and leverage. The debt ratio is the ratio of a company’s total debts to its total assets. The total assets include current and non-current assets while the debts consist of all amounts payable. According to Brigham and Ehrhardt (2005) the debt ratio measures the percentage of the funds provided by sources other than equity. The company’s equity is in deficit and therefore a ratio involving AMR’s leverage would not tell much as the deficit speaks to the financial state of the company. The debt ratios for the past two years and the current year to date figures are indicated. The figures for 2009 and 2010 have been calculated while the year to date (2011) figure was retrieved from Business Week (2011). AMR Corporation’s Key Solvency Ratios Solvency Ratios 2009 2010 2011 Debt ratio 113.7% 115.7% 117.5 leverage Key Financial Information The graph below provides visual information on key operating expenses and income over the past three years. Figure 1 The graph in Figure 1 indicates that operating expenses were substantially more than revenues in 2008 and 2009. The figures were pretty close in 2010. It must be noted that interest expense is not included in the figures for operating expenses that were used to generate the graph in Figure 1. It is clear that the airline is struggling and therefore cannot afford anymore losses. Right now AMR is only operating to pay pensions, salaries, buy fuel and repay its other debt obligations. Salaries and aircraft fuel account for over 60% of the operating expenses as shown in Figure 2. Figure 2 Figure 2 indicates that the book value of AMR’s total assets have declined while the deficit in stockholders equity increased, as indicated earlier. It also indicates that a substantial portion of AMR’s total liabilities is made up of other liabilities of which approximately 75% relates to pension and post retirement benefits. As employees continue to retire the amount will continue to increase. The level of liabilities indicates that the company faces a high level of risk of defaulting on both current and future obligations. Assessment of AMR’s capacity to raise funds SEC filings suggests that over the past 5 years the company has borrowed approximately $8.8 billion which has been used to finance capital expenditure, fund operating losses, repay maturing debts as well as employee pension obligations (PHX Corporate 2011). In order to continue its operations it will require even more funds to do so effectively. The options that are available to companies include issuing bonds and selling additional shares on the stock exchange. The stock exchange is not a viable option for AMR at this time because stockholder’s equity is currently in deficit and this has been so for quite some time. This would seem to indicate that in terms of book value the shares are worthless as creditors would have prior claim to the assets of the company. The company’s total liabilities exceed it total assets for both periods and so indicates that if the company was to cease operations it would not be able to pay all its liabilities. Based on the kinds of assets that AMR has, it is highly unlikely that it will be able to generate the values that are currently in the books. Furthermore, its liquidity and profitability indicators along with the current economic scenario in the industry indicate that it would not be able to attract many investors by going that route. The company could however consider issuing preferred stocks which provide the option to investors to sell it back with certain guarantees on specified dates. This would require additional guarantees for the payment of dividends or an imputed interest element taking into consideration the time value of money. This would however, be a hard sell as the current economic scenario as well as the problems facing the company would not allow them to put forward a favorable prospectus. The bond market may be the most viable option but the investors would use any information available to them in making their decisions. According to SEC filings most of AMR’s aircraft assets are encumbered as a result of the company’s financing activities in recent years (APX Corporate 2011). Additionally, since the terrorist attacks of September 11, 2001 the company’s credit rating has been reduced to below investment grade. These factors have served to increase the company’s borrowing cost because of the high levels of risks associated with its debts (APX Corporate 2011). All of these factors together indicate that seeking finance by issuing bonds may not materialize as investors pay close attention to the ratings given by credit rating agencies such as Standard & Poors. According to the Securities and Exchange Commission (2003) for more than 30 years regulators including the SEC have increasingly used help monitor the risk of investments held by regulated entities. With the recent corporate failures and the claims that these rating agencies have been affected by conflict of interest in their ratings of certain companies the financial statements themselves provide adequate information to deter or encourage investors. Conclusion AMR’s financial statements for the past three years have nothing to recommend them. The company’s situation is being aggravated with increasing competition in the industry. Additionally a fine of $24 million was proposed for American Airlines in 2010 for alleged maintenance violations (Crawley 2010). The financial difficulties that it faces may lead to increased risk of maintenance violations resulting in even more fines, claims against the company as a result of accidents that may lead to increases in insurance premiums. The ratios indicate that the company is not profitable, does not have enough liquidity and is not solvent. It therefore means that it is not a going concern. If it were to cease operations it would only be able to pay approximately 60% of its current liabilities within a 30 day period. Its total liabilities surpass its total assets. Additionally, the company’s may not be able to obtain the current book value for its fleet of aircrafts. References BPP Learning Media (2009). ACCA Paper 7: Financial Reporting. 3rd ed. London: BPP Learning Media Ltd Brigham, E.F. and Ehrhardt, M.C. (2005) Financial Management: Theory and Practice. 11th ed. USA: Thomson South Western Business Week. (2011)AMR Corp: Financial Ratios. Retrieved on Aug 18th 2011 from: http://investing.businessweek.com/businessweek/research/stocks/financials/ratios.asp?ticker=AMR:US Crawley, J. (2010). Record $24.2 million fine proposed for American Airlines. Retrieved on Aug 18th from: http://www.reuters.com/article/2010/08/26/us-amr-fine-idUSTRE67P3TU20100826 Daily Finance (2011) AMR Daily Quote Page. Retrieved July 21st, 2011 from: http://www.dailyfinance.com/financials/amr-corporation/amr/nys/key-ratios PHX Corporate. (2011)AMR Corporation 2010 Annual Report. Retrieved on Aug 18th from: http://phx.corporate-ir.net/External.File?item=UGFyZW50SUQ9NDIyOTIzfENoaWxkSUQ9NDM3MDEwfFR5cGU9MQ==&t=1 U.S. Securities and Exchange Commission. (2003). Report on the Role and Function of Credit Rating Agencies in the Operation of the Securities Markets. Retrieved Aug 18th from: http://www.sec.gov/news/studies/credratingreport0103.pdf Read More
Cite this document
  • APA
  • MLA
  • CHICAGO
(“Professional Challenge: Financial Management Analysis Research Paper”, n.d.)
Retrieved from https://studentshare.org/finance-accounting/1430739-u06a2-professional-challenge-yt-financial-management-analysis-amr
(Professional Challenge: Financial Management Analysis Research Paper)
https://studentshare.org/finance-accounting/1430739-u06a2-professional-challenge-yt-financial-management-analysis-amr.
“Professional Challenge: Financial Management Analysis Research Paper”, n.d. https://studentshare.org/finance-accounting/1430739-u06a2-professional-challenge-yt-financial-management-analysis-amr.
  • Cited: 0 times

CHECK THESE SAMPLES OF Analysis of AMRs Financial Statements

Financial Statement Analysis: Alcatel-Lucent

The research will be focusing on a few areas of the financial statements in the analysis of this company we.... But to be categorized such assets as assets in the financial statements, they should be able to be measured reliably and they should be considered value adding to the financial performance of the company.... The analysis of the company is described in detail here.... The paper tells that the analysis of a company's financial data reflects the company's performance....
7 Pages (1750 words) Research Paper

RISK MANAGEMENT IN ABN AMRO BANK

An analysis of its credit exposure and their currency status is also given (ABN AMRO 2010, p.... The company reports interest rate risk by providing a comparative analysis of the percentage NII-at-Risk; duration of equity in terms of years; and VaR banking book between the current and prior year.... Market risk is reported using a graph as well as a comparative analysis of the highest, lowest and average VaR of the current and prior year.... Credit risk is reported in the form of an analysis according to the industry sector in which the loans are made, the type of loans, with an indication of the carrying amount of the loans....
5 Pages (1250 words) Essay

What Extensible Business Reporting Language Is

The information on the XBRL platform can be freely downloaded especially the financial statements can be downloaded as spreadsheet format so that it can be easily used for further analysis (AICPA.... The professional users of financial statements of business like the security analysts can analyze the company's financial information by comparing with other competitors very easily.... XBRL has published guideline for the users in its websites to help the preparers of financial statements (FFIEC, 2006, p....
5 Pages (1250 words) Research Paper

Impacts on the financials of Compass Group

During the analysis of the lessee's financial position, it is evident that many users tend to want to capitalize operating leases through adjustments made to the reported financial information.... Such is the information that is normally available to many users of the statements and the entire statement.... In this essay, the author demonstrates the International Accounting Standards Board and the US financial Accounting Standards Board.... And also the author describes how realizing an improvement in the quality and the comparability of the financial reporting....
5 Pages (1250 words) Essay

Strengthening the Management of Financing

As per the convention of consistency, the same accounting methods should be adopted every year in preparing financial statements.... Personal financial statements Care should be taken that the financial statements are not older than 90 days and financial statements of all principal owners and guarantors should be included.... Venture capitalists may be institutional risk takers, financial institutions, wealthy persons, etc....
6 Pages (1500 words) Research Paper

Liquidation Assessment through Strategic Financial Statement Analysis

Apart from this secondary data, ten companies that failed and were liquidated recently will be selected and their financial statements analyzed to pinpoint the indicators of vulnerable areas that led to their liquidation.... This study will present the causes of the corporate failures resulting in their liquidation through the technique of strategic financial statement analysis.... Again in the UK, Red Flag Alert says that more than 140,000 were showing signs of financial distress in q4 2009....
14 Pages (3500 words) Essay

The Financial Statement Analysis of the Southwest Airlines

The author of the "The Financial Statement analysis of the Southwest Airlines" paper states that the company must have an ideal mix of debt and equity in its capital base.... Any excessive reliance on any particular source is not good for its financial health.... In the financial year 2008, Southwest Airlines paid $130 million as interest expense and in this year the company earned Earning before interest and tax (EBIT) of $278 million.... An interest coverage ratio of less than 2 indicates financial risk (Massachusetts Institute of Technology, n....
6 Pages (1500 words) Case Study

Financial Statements - Sullivan Barrett Pty Ltd

The paper "financial statements - Sullivan Barrett Pty Ltd" is a perfect example of a finance and accounting case study.... The financial statements have been prepared in accordance with the Corporation Act and AASB 101 regulations for special financial statement reporting.... Other professional accounting techniques have also been incorporated in the financial statements.... The paper "financial statements - Sullivan Barrett Pty Ltd" is a perfect example of a finance and accounting case study....
6 Pages (1500 words) Case Study
sponsored ads
We use cookies to create the best experience for you. Keep on browsing if you are OK with that, or find out how to manage cookies.
Contact Us