StudentShare
Contact Us
Sign In / Sign Up for FREE
Search
Go to advanced search...
Free

Chain and Gear Business Expansion Plan 2014 - Essay Example

Cite this document
Summary
This essay describes the research from London School of Economics, shows that the number of new cyclists increased by 11% in 2010. This increase has created demand for new and used bicycles in the UK. Chain and Gear will be situated along Fulham Rd, Chelsea, London…
Download full paper File format: .doc, available for editing
GRAB THE BEST PAPER98.2% of users find it useful
Chain and Gear Business Expansion Plan 2014
Read Text Preview

Extract of sample "Chain and Gear Business Expansion Plan 2014"

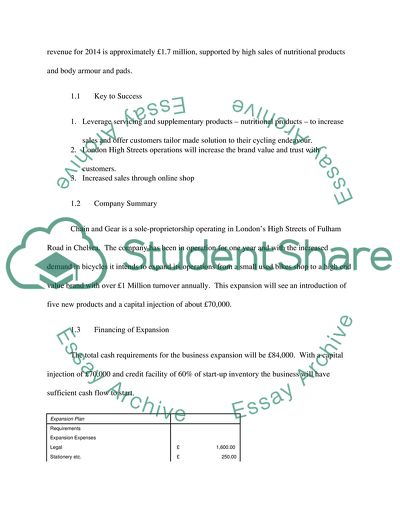
Chain and Gear Business Expansion Plan 2014 1. Executive Summary Research from London School of Economics, shows that the number of new cyclist increased by 11% in 2010. This increase has created demand for new and used bicycles in the UK. This increase in cyclist creates an opportunity for expansion of Chain and Gear who currently specialise in used bicycles. This business plan is intended to source for a loan of £60,000 to expand the business, repayable in equal instalments for 36 months. Chain and Gear will be situated along Fulham Rd, Chelsea, London. Chain and Gear, an established bicycle retailer and repair shop, intends to expand its operations by opening a shop in London. The expansion will include development of an ecommerce website to increase sells and customer service, development of five new products. The services we currently offer are limited to Used bikes. The new products are new bikes (hybrid and Mountain) from various suppliers, cycling nutrition products such as energy drinks, body armour and Pads from Dainese and finally, accessories and spares. Servicing and maintenance will be offered free for all bikes bought at the shop for a period of 3months from the date of purchase. We expect a gross Margin of 46% on the new products and an expected 40% net margin. The Break-even point is estimated at 710 units. With the changing weather patterns in the UK, sales are expected to be at peak levels in the summer months. Tour De France’s influence on cycling will be important with many communities organizing small events. Chain and Gear will optimise these events to promote its products and increase revenue. The annual expected revenue for 2014 is approximately £1.7 million, supported by high sales of nutritional products and body armour and pads. 1.1 Key to Success 1. Leverage servicing and supplementary products – nutritional products – to increase sales and offer customers tailor made solution to their cycling endeavour. 2. London High Streets operations will increase the brand value and trust with customers. 3. Increased sales through online shop 1.2 Company Summary Chain and Gear is a sole-proprietorship operating in London’s High Streets of Fulham Road in Chelsea. The company has been in operation for one year and with the increased demand in bicycles it intends to expand its operations from a small used bikes shop to a high end value brand with over £1 Million turnover annually. This expansion will see an introduction of five new products and a capital injection of about £70,000. 1.3 Financing of Expansion The total cash requirements for the business expansion will be £84,000. With a capital injection of £70,000 and credit facility of 60% of start-up inventory the business will have sufficient cash flow to start. Expansion Plan   Requirements   Expansion Expenses   Legal £ 1,600.00 Stationery etc. £ 250.00 Promotional Materials £ 300.00 Consultants £ 800.00 Rent, fixtures and fittings £ 5,000.00 Insurance £ 350.00 Website Development £ 3,000.00 Total Start-up Expenses £ 11,300.00     Expansion Assets   Cash Required £ 5,000.00 Start-up Inventory £ 31,979.00 Other Current Assets £ 18,000.00 Long-term Assets £ 17,500.00 Total Assets £ 72,479.00 Total Requirements £ 83,779.00 1.4 Expansion Plan funding The intended will be funded by a loan of £60,000 sourced from banks and a £10,000 cash injection from the owner. Chain and Gear as already agreed a credit facility from its main suppliers in the market for purchase of inventory. Chain and gear will be required to only fund 40% of the initial inventory reducing the total cash requirements to expand the business. 2. Products 1. New Hybrid Bikes – we will sell new hybrid bikes at our stores. The hybrid bike I popular because of its cost and suitability for city usage. It is light and the cost is lower than mountain bikes. Customers will have the option of selecting the bike they want from several brands that we will stock up in our stores. Hybrids are also good for sports, fitness and leisure riding hence the popularity. 2. Mountain Bike – a choice from BMX to Carrera, customers will have long range of choice on mountain bikes. With mountain bike being a specialised area gross margin from the sale of a mountain bike will certainly make up for the lower sales volumes in this category. 3. Cycling Nutritional Products – this section will have several energy drinks and nutritional healthy guide for cyclist. The products under this category are expected to be the major differentiator from our competitors. 4. Body Armour and Pads - we will concentrate on selling only one brand of body armour, Dainese. The choice of this brand is important in maintaining our brand value as a high-end market provider of protective clothing. The volume of sales of the protective gear is expected to increase as the number of cyclist increase. With more people paying attention to safety, protective clothing is going to be a business driver. 5. Accessories and spares – we will introduce sale of spares and other accessories like bike watches. This product will complement our maintenance service and offer customers a one-stop shop for all their cycling needs. 2.1 Brands Our main brands are BMX, Carrera, Boardman, Voodoo and Apollo. The will be the main brands that we will deal with in the New Bikes category. The bile variety will include Adult, Women, Unisex and Kids. With prices range from £175 to £1050 the average unit price of a Hybrid Bicycle is £400 while that of a Mountain bike is £650. Dainese’s body armour and pads ranges from £100 to £350. The protective gear include knee guards, chest vests and neck braces. 3. Competition and market share Our main competitors are Halfords and other independent bicycle shop owners. With Halfords being a big market player, personal attention to each customer is limited. We will leverage a lean customer base by providing supplier products and services to all our customers. Personal care for each customer will be our main goal. Our location is another competitive advantage. Our customer is the High Street shopper in London. These shoppers walk or ride past the shops. They are also health conscious individuals willing to invest in a better lifestyle. Comfort and safety of the bicycle and the accessories will increase customer retention. They know they can get the service they need by dropping their bike off picking it up on later. Our customer retention method is to offer superior service and products. We will also seek to increase sales via our web portal. Marketing efforts will focus on selling Chain and Gear as business that operates in the entire UK. We will ship products bought online within one day (24-hour deliver) program. 3.1 Market Analysis and Segmentation Our main customer is leisure rides and sports enthusiastic riders. We will take advantage of government’s cycle to work program to increase our market share. The figure below adapted from [Lon14] shows the increased number of new cyclist. The new cyclists are about 11%. This population will offer opportunity for growth in the industry and also increased revenues for Chain and Gear. Market Analysis             Year 1 Year 2 Year 3 Potential Customers Growth CAGR Leasire riders 4% 27,500 28,600 29,744 4.00% Fitness riders 1% 6,500 6,533 6,566 0.50% Sports riders 2% 160,000 163,200 166,464 2.00% Other 0% 2,000 2,000 2,000 0.00% Total 2.22% 196,000 200,333 204,774 2.22% 3.3 Sales Forecast A comprehensive sales schedule is included. 3.4 Pricing Mechanism We intend to maintain a gross margin of above 46%. This pricing mechanism will enable us to maintain strong accounting indicators. With increasing number of independent shops our pricing method will be put under pressure, but the increased customer service and supplementary services will give us a competitive edge. We offer free service programs to our customers as a method of customer retention. 3.5 Management and Personnel We intend to keep 4 highly knowledgeable staff members in our shop. They will help to advise customers and be in charge of the sales. Personnel Plan Number of People         Year 1 Year 2 Year 3 Manager 1 £ 18,000.00 £ 18,000.00 £ 18,000.00 Full time staff 3 £ 25,200.00 £ 30,000.00 £ 30,000.00 Part-time Employees Not specified £ 4,800.00 £ 7,000.00 £ 7,000.00 Total Payroll   £ 48,000.00 £ 55,000.00 £ 55,000.00 Appendices Overhead Budget Instructions : enter data in yellow areas     2014 JAN FEB MAR APR MAY JUN JUL AUG SEP OCT NOV DEC JAN New Hybrid Bikes                           Sales Price per unit £400.00 £400.00 £400.00 £400.00 £400.00 £400.00 £400.00 £400.00 £400.00 £400.00 £400.00 £400.00   Cost per unit £ 250.00 £ 250.00 £ 250.00 £ 250.00 £ 250.00 £ 250.00 £ 250.00 £ 250.00 £ 250.00 £ 250.00 £ 250.00 £ 250.00   Gross Margin per unit £ 150.00 £ 150.00 £ 150.00 £ 150.00 £ 150.00 £ 150.00 £ 150.00 £ 150.00 £ 150.00 £ 150.00 £ 150.00 £ 150.00 0 Gross Margin % 38% 38% 38% 38% 38% 38% 38% 38% 38% 38% 38% 38%                               Volume purchased 110 75 90 110 110 80 90 70 60 40 30 30   Volume sold 30 40 65 70 91 85 95 70 70 60 50 40   Stock remaining 80 35 25 40 19 -5 -5 0 -10 -20 -20 -10 0 Cumulative stock 80 115 140 180 199 194 189 189 179 159 139 129 129                             % sales in cash 60% 75% 80% 80% 75% 85% 60% 65% 70% 70% 75% 80%   % sales in credit 40% 25% 20% 20% 25% 15% 40% 35% 30% 30% 25% 20%   Cash sales 7200 12000 20800 22400 27300 28900 22800 18200 19600 16800 15000 12800 0 Credit sales   4800 4000 5200 5600 9100 5100 15200 9800 8400 7200 5000 3200 Total sales 7200 16800 24800 27600 32900 38000 27900 33400 29400 25200 22200 17800 3200                             % purchases in cash 40% 40% 40% 40% 40% 40% 40% 40% 40% 40% 40% 40%   % purchases in credit 60% 60% 60% 60% 60% 60% 60% 60% 60% 60% 60% 60%   Cash purchases 11000 7500 9000 11000 11000 8000 9000 7000 6000 4000 3000 3000 0 Credit purchases   16500 11250 13500 16500 16500 12000 13500 10500 9000 6000 4500 4500 Total purchases 11000 24000 20250 24500 27500 24500 21000 20500 16500 13000 9000 7500 4500 New Mountain Bikes                           Sales Price per unit £ 650.00 £ 650.00 £ 650.00 £ 650.00 £ 650.00 £ 650.00 £ 650.00 £ 650.00 £ 650.00 £ 650.00 £ 650.00 £ 650.00   Cost per unit £ 400.00 £ 400.00 £ 400.00 £ 400.00 £ 400.00 £ 400.00 £ 400.00 £ 400.00 £ 400.00 £ 400.00 £ 400.00 £ 400.00   Gross Margin per unit £ 250.00 £ 250.00 £ 250.00 £ 250.00 £ 250.00 £ 250.00 £ 250.00 £ 250.00 £ 250.00 £ 250.00 £ 250.00 £ 250.00 0 Gross Margin % 38% 38% 38% 38% 38% 38% 38% 38% 38% 38% 38% 38%                               Volume purchased 50 50 60 60 70 80 70 50 50 30 30 50   Volume sold 20 20 30 45 45 70 70 65 65 50 40 35   Stock remaining 30 30 30 15 25 10 0 -15 -15 -20 -10 15 0 Cumulative stock 30 60 90 105 130 140 140 125 110 90 80 95 95                             % sales in cash 70% 80% 65% 65% 70% 75% 75% 65% 60% 80% 85% 65%   % sales in credit 30% 20% 35% 35% 30% 25% 25% 35% 40% 20% 15% 35%   Cash sales 9100 10400 12675 19013 20475 34125 34125 27463 25350 26000 22100 14788 0 Credit sales   3900 2600 6825 10238 8775 11375 11375 14788 16900 6500 3900 7963 Total sales 9100 14300 15275 25838 30713 42900 45500 38838 40138 42900 28600 18688 7963                             % purchases in cash 40% 40% 40% 40% 40% 40% 40% 40% 40% 40% 40% 40%   % purchases in credit 60% 60% 60% 60% 60% 60% 60% 60% 60% 60% 60% 60%   Cash purchases 8000 8000 9600 9600 11200 12800 11200 8000 8000 4800 4800 8000 0 Credit purchases   12000 12000 14400 14400 16800 19200 16800 12000 12000 7200 7200 12000 Total purchases 8000 20000 21600 24000 25600 29600 30400 24800 20000 16800 12000 15200 12000 Cycling Nutrition Products                           Sales Price per unit £ 20.00 £ 20.00 £ 20.00 £ 20.00 £ 20.00 £ 20.00 £ 20.00 £ 20.00 £ 20.00 £ 20.00 £ 20.00 £ 20.00   Cost per unit £ 8.00 £ 8.00 £ 8.00 £ 8.00 £ 8.00 £ 8.00 £ 8.00 £ 8.00 £ 8.00 £ 8.00 £ 8.00 £ 8.00   Gross Margin per unit £ 12.00 £ 12.00 £ 12.00 £ 12.00 £ 12.00 £ 12.00 £ 12.00 £ 12.00 £ 12.00 £ 12.00 £ 12.00 £ 12.00 0 Gross Margin % 60% 60% 60% 60% 60% 60% 60% 60% 60% 60% 60% 60%                               Volume purchased 2000 2000 2000 2500 2500 3000 3000 2500 2000 2000 500 0   Volume sold 1200 1100 1500 1600 1500 2200 2800 2400 1500 1500 1300 1800   Stock remaining 800 900 500 900 1000 800 200 100 500 500 -800 -1800 0 Cumulative stock 800 1700 2200 3100 4100 4900 5100 5200 5700 6200 5400 3600 3600                             % sales in cash 70% 80% 85% 80% 75% 70% 75% 80% 65% 70% 80% 70%   % sales in credit 30% 20% 15% 20% 25% 30% 25% 20% 35% 30% 20% 30%   Cash sales 16800 17600 25500 25600 22500 30800 42000 38400 19500 21000 20800 25200 0 Credit sales   7200 4400 4500 6400 7500 13200 14000 9600 10500 9000 5200 10800 Total sales 16800 24800 29900 30100 28900 38300 55200 52400 29100 31500 29800 30400 10800                             % purchases in cash 40% 40% 40% 40% 40% 40% 40% 40% 40% 40% 40% 0%   % purchases in credit 60% 60% 60% 60% 60% 60% 60% 60% 60% 60% 60% 0%   Cash purchases 6400 6400 6400 8000 8000 9600 9600 8000 6400 6400 1600 0 0 Credit purchases   9600 9600 9600 12000 12000 14400 14400 12000 9600 9600 2400 0 Total purchases 6400 16000 16000 17600 20000 21600 24000 22400 18400 16000 11200 2400 0 Body Armour and Pads - Dainese                           Sales Price per unit £ 130.00 £ 130.00 £ 130.00 £ 130.00 £ 130.00 £ 130.00 £ 130.00 £ 130.00 £ 130.00 £ 130.00 £ 130.00 £ 130.00   Cost per unit £ 70.00 £ 70.00 £ 70.00 £ 70.00 £ 70.00 £ 70.00 £ 70.00 £ 70.00 £ 70.00 £ 70.00 £ 70.00 £ 70.00   Gross Margin per unit £ 60.00 £ 60.00 £ 60.00 £ 60.00 £ 60.00 £ 60.00 £ 60.00 £ 60.00 £ 60.00 £ 60.00 £ 60.00 £ 60.00 0 Gross Margin % 46% 46% 46% 46% 46% 46% 46% 46% 46% 46% 46% 46%                               Volume purchased 180 200 400 450 550 550 500 500 500 250 200 150   Volume sold 50 70 250 400 450 580 600 550 450 300 200 120   Stock remaining 130 130 150 50 100 -30 -100 -50 50 -50 0 30 0 Cumulative stock 130 260 410 460 560 530 430 380 430 380 380 410 410                             % sales in cash 80% 85% 80% 85% 90% 92% 85% 90% 85% 80% 80% 85%   % sales in credit 20% 15% 20% 15% 10% 8% 15% 10% 15% 20% 20% 15%   Cash sales 5200 7735 26000 44200 52650 69368 66300 64350 49725 31200 20800 13260 0 Credit sales   1300 1365 6500 7800 5850 6032 11700 7150 8775 7800 5200 2340 Total sales 5200 9035 27365 50700 60450 75218 72332 76050 56875 39975 28600 18460 2340                             % purchases in cash 40% 40% 40% 40% 40% 40% 40% 40% 40% 40% 40% 40%   % purchases in credit 60% 60% 60% 60% 60% 60% 60% 60% 60% 60% 60% 60%   Cash purchases 5040 5600 11200 12600 15400 15400 14000 14000 14000 7000 5600 4200 0 Credit purchases   7560 8400 16800 18900 23100 23100 21000 21000 21000 10500 8400 6300 Total purchases 5040 13160 19600 29400 34300 38500 37100 35000 35000 28000 16100 12600 6300 Accessories and Spares                           Sales Price per unit 60 60 60 60 60 60 60 60 60 60 60 60   Cost per unit 32 32 32 32 32 32 32 32 32 32 32 32   Gross Margin per unit 28 28 28 28 28 28 28 28 28 28 28 28 0 Gross Margin % 47% 47% 47% 47% 47% 47% 47% 47% 47% 47% 47% 47%                               Volume purchased 120 130 130 140 160 160 160 170 165 160 140 130   Volume sold 100 120 140 140 150 160 160 160 170 160 150 120   Stock remaining 20 10 -10 0 10 0 0 10 -5 0 -10 10 0 Cumulative stock 20 30 20 20 30 30 30 40 35 35 25 35 35                             % sales in cash 80% 85% 90% 85% 80% 75% 80% 85% 80% 90% 90% 85%   % sales in credit 20% 15% 10% 15% 20% 25% 20% 15% 20% 10% 10% 15%   Cash sales 4800 6120 7560 7140 7200 7200 7680 8160 8160 8640 8100 6120 0 Credit sales   1200 1080 840 1260 1800 2400 1920 1440 2040 960 900 1080 Total sales 4800 7320 8640 7980 8460 9000 10080 10080 9600 10680 9060 7020 1080                             % purchases in cash 40% 40% 40% 40% 40% 40% 40% 40% 40% 40% 40% 40%   % purchases in credit 60% 60% 60% 60% 60% 60% 60% 60% 60% 60% 60% 60%   Cash purchases 1536 1664 1664 1792 2048 2048 2048 2176 2112 2048 1792 1664 0 Credit purchases   2304 2496 2496 2688 3072 3072 3072 3264 3168 3072 2688 2496 Total purchases 1536 3968 4160 4288 4736 5120 5120 5248 5376 5216 4864 4352 2496 Sales summary New Hybrid Bikes 12000 16000 26000 28000 36400 34000 38000 28000 28000 24000 20000 16000 New Mountain Bikes 13000 13000 19500 29250 29250 45500 45500 42250 42250 32500 26000 22750 Cycling Nutrition Products 24000 22000 30000 32000 30000 44000 56000 48000 30000 30000 26000 36000 Body Armour and Pads - Dainese 6500 9100 32500 52000 58500 75400 78000 71500 58500 39000 26000 15600 Accessories and Spares 6000 7200 8400 8400 9000 9600 9600 9600 10200 9600 9000 7200 Total Sales Value 61500 67300 116400 149650 163150 208500 227100 199350 168950 135100 107000 97550 Stock summary New Hybrid Bikes 20000 28750 35000 45000 49750 48500 47250 47250 44750 39750 34750 32250 New Mountain Bikes 12000 24000 36000 42000 52000 56000 56000 50000 44000 36000 32000 38000 Cycling Nutrition Products 6400 13600 17600 24800 32800 39200 40800 41600 45600 49600 43200 28800 Body Armour and Pads - Dainese 9100 18200 28700 32200 39200 37100 30100 26600 30100 26600 26600 28700 Accessories and Spares 640 960 640 640 960 960 960 1280 1120 1120 800 1120 Total Stock Value 48140 85510 117940 144640 174710 181760 175110 166730 165570 153070 137350 128870 Purchases summary New Hybrid Bikes 27500 18750 22500 27500 27500 20000 22500 17500 15000 10000 7500 7500 New Mountain Bikes 20000 20000 24000 24000 28000 32000 28000 20000 20000 12000 12000 20000 Cycling Nutrition Products 16000 16000 16000 20000 20000 24000 24000 20000 16000 16000 4000 0 Body Armour and Pads - Dainese 12600 14000 28000 31500 38500 38500 35000 35000 35000 17500 14000 10500 Accessories and Spares 3840 4160 4160 4480 5120 5120 5120 5440 5280 5120 4480 4160 Total Purchases Value 79940 72910 94660 107480 119120 119620 114620 97940 91280 60620 41980 42160 Debtors summary New Hybrid Bikes 4800 4000 5200 5600 9100 5100 15200 9800 8400 7200 5000 3200 New Mountain Bikes 3900 2600 6825 10238 8775 11375 11375 14788 16900 6500 3900 7963 Cycling Nutrition Products 7200 4400 4500 6400 7500 13200 14000 9600 10500 9000 5200 10800 Body Armour and Pads - Dainese 1300 1365 6500 7800 5850 6032 11700 7150 8775 7800 5200 2340 Accessories and Spares 1200 1080 840 1260 1800 2400 1920 1440 2040 960 900 1080 Total Debtors 18400 13445 23865 31297.5 33025 38107 54195 42777.5 46615 31460 20200 25382.5 Creditors summary New Hybrid Bikes 16500 11250 13500 16500 16500 12000 13500 10500 9000 6000 4500 4500 New Mountain Bikes 12000 12000 14400 14400 16800 19200 16800 12000 12000 7200 7200 12000 Cycling Nutrition Products 9600 9600 9600 12000 12000 14400 14400 12000 9600 9600 2400 0 Body Armour and Pads - Dainese 7560 8400 16800 18900 23100 23100 21000 21000 21000 10500 8400 6300 Accessories and Spares 2304 2496 2496 2688 3072 3072 3072 3264 3168 3072 2688 2496 Total Creditors 47964 43746 56796 64488 71472 71772 68772 58764 54768 36372 25188 25296 Overhead Budget Instructions : enter data in yellow areas     2014 JAN FEB MAR APR MAY JUN JUL AUG SEP OCT NOV DEC Website Design 2500 0 0 0 0 0 0 0 0 0 0 0 Rent 1000 1000 1000 1000 1000 1000 1000 1000 1000 1000 1000 1000 Insurance 350 350 350 350 350 350 350 350 350 350 350 350 Payroll 4000 4000 4000 4000 4000 4000 4000 4000 4000 4000 4000 4000 Utilities 270 270 270 270 270 270 270 270 270 270 270 270 Marketing 4500 3500 1000 1000 1000 4500 4200 1000 1000 1500 1500 1500 Stationery and Office Expenses 120 120 120 120 120 120 120 120 120 120 120 120 Website maintenance and Support 150 150 150 150 150 150 150 150 150 150 150 150 Leased Service Van 350 350 350 350 350 350 350 350 350 350 350 350 Security System 30 30 30 30 30 30 30 30 30 30 30 30 Miscellaneous 40 40 40 40 40 40 40 40 40 40 40 40 Loan Interest 521 521 521 521 521 521 521 521 521 521 521 521 Total overheads 13831 10331 7831 7831 7831 11331 11031 7831 7831 8331 8331 8331 Cash Flow Budget Instructions : enter data in yellow areas       2014 JAN FEB MAR APR MAY JUN JUL AUG SEP OCT NOV DEC Inflow Cash sales 43,100 53,855 92,535 118,353 130,125 170,393 172,905 156,573 122,335 103,640 86,800 72,168 Credit sales 0 18,400 13,445 23,865 31,298 33,025 38,107 54,195 42,778 46,615 31,460 20,200 Old Assets sold 0 0 0 0 0 0 0 0 0 0 0 0 Loans received £ 60,000.00 0 0 0 0 0 0 0 0 0 0 0 Capital introduced £ 10,000.00 0 0 0 0 0 0 0 0 0 0 0 Total inflow 113,100 72,255 105,980 142,218 161,423 203,418 211,012 210,768 165,113 150,255 118,260 92,368 Outflow Cash purchases 31,976 29,164 37,864 42,992 47,648 47,848 45,848 39,176 36,512 24,248 16,792 16,864 Credit purchases 0 47,964 43,746 56,796 64,488 71,472 71,772 68,772 58,764 54,768 36,372 25,188 Website Design 2,500 0 0 0 0 0 0 0 0 0 0 0 Rent 1,000 1,000 1,000 1,000 1,000 1,000 1,000 1,000 1,000 1,000 1,000 1,000 Insurance 350 350 350 350 350 350 350 350 350 350 350 350 Payroll 4,000 4,000 4,000 4,000 4,000 4,000 4,000 4,000 4,000 4,000 4,000 4,000 Utilities 270 270 270 270 270 270 270 270 270 270 270 270 Marketing 4,500 3,500 1,000 1,000 1,000 4,500 4,200 1,000 1,000 1,500 1,500 1,500 Stationery and Office Expenses 120 120 120 120 120 120 120 120 120 120 120 120 Website maintenance and Support 150 150 150 150 150 150 150 150 150 150 150 150 Leased Service Van 350 350 350 350 350 350 350 350 350 350 350 350 Security System 30 30 30 30 30 30 30 30 30 30 30 30 Miscellaneous 40 40 40 40 40 40 40 40 40 40 40 40 Loan Interest 521 521 521 521 521 521 521 521 521 521 521 521 Loan principal repayed 1,780 1,780 1,780 1,780 1,780 1,780 1,780 1,780 1,780 1,780 1,780 1,780 Fixed assets purchased 17,500 2,000 2,000 1,000 0 10,000 0 0 0 0 0 0 Total outflow 65,087 91,239 93,221 110,399 121,747 142,431 130,431 117,559 104,887 89,127 63,275 52,163 Opening balance 0 48,013 29,029 41,788 73,607 113,282 174,269 254,850 348,059 408,284 469,412 524,397 Net cash flow in/(out) 48,013 -18,984 12,759 31,819 39,676 60,987 80,581 93,209 60,226 61,128 54,985 40,205 Closing balance 48,013 29,029 41,788 73,607 113,282 174,269 254,850 348,059 408,284 469,412 524,397 564,602 Cash Flow Workings 2014 JAN FEB MAR APR MAY JUN JUL AUG SEP OCT NOV DEC Cash sale New Hybrid Bikes 7,200 12,000 20,800 22,400 27,300 28,900 22,800 18,200 19,600 16,800 15,000 12,800 New Mountain Bikes 9,100 10,400 12,675 19,013 20,475 34,125 34,125 27,463 25,350 26,000 22,100 14,788 Cycling Nutrition Products 16,800 17,600 25,500 25,600 22,500 30,800 42,000 38,400 19,500 21,000 20,800 25,200 Body Armour and Pads - Dainese 5,200 7,735 26,000 44,200 52,650 69,368 66,300 64,350 49,725 31,200 20,800 13,260 Accessories and Spares 4,800 6,120 7,560 7,140 7,200 7,200 7,680 8,160 8,160 8,640 8,100 6,120 Total cash sale 43,100 53,855 92,535 118,353 130,125 170,393 172,905 156,573 122,335 103,640 86,800 72,168 Credit sale New Hybrid Bikes 0 4,800 4,000 5,200 5,600 9,100 5,100 15,200 9,800 8,400 7,200 5,000 New Mountain Bikes 0 3,900 2,600 6,825 10,238 8,775 11,375 11,375 14,788 16,900 6,500 3,900 Cycling Nutrition Products 0 7,200 4,400 4,500 6,400 7,500 13,200 14,000 9,600 10,500 9,000 5,200 Body Armour and Pads - Dainese 0 1,300 1,365 6,500 7,800 5,850 6,032 11,700 7,150 8,775 7,800 5,200 Accessories and Spares 0 1,200 1,080 840 1,260 1,800 2,400 1,920 1,440 2,040 960 900 Total credit sale 0 18,400 13,445 23,865 31,298 33,025 38,107 54,195 42,778 46,615 31,460 20,200 Cash purchase New Hybrid Bikes 11,000 7,500 9,000 11,000 11,000 8,000 9,000 7,000 6,000 4,000 3,000 3,000 New Mountain Bikes 8,000 8,000 9,600 9,600 11,200 12,800 11,200 8,000 8,000 4,800 4,800 8,000 Cycling Nutrition Products 6,400 6,400 6,400 8,000 8,000 9,600 9,600 8,000 6,400 6,400 1,600 0 Body Armour and Pads - Dainese 5,040 5,600 11,200 12,600 15,400 15,400 14,000 14,000 14,000 7,000 5,600 4,200 Accessories and Spares 1,536 1,664 1,664 1,792 2,048 2,048 2,048 2,176 2,112 2,048 1,792 1,664 Total cash purchase 31,976 29,164 37,864 42,992 47,648 47,848 45,848 39,176 36,512 24,248 16,792 16,864 Credit purchase New Hybrid Bikes 0 16,500 11,250 13,500 16,500 16,500 12,000 13,500 10,500 9,000 6,000 4,500 New Mountain Bikes 0 12,000 12,000 14,400 14,400 16,800 19,200 16,800 12,000 12,000 7,200 7,200 Cycling Nutrition Products 0 9,600 9,600 9,600 12,000 12,000 14,400 14,400 12,000 9,600 9,600 2,400 Body Armour and Pads - Dainese 0 7,560 8,400 16,800 18,900 23,100 23,100 21,000 21,000 21,000 10,500 8,400 Accessories and Spares 0 2,304 2,496 2,496 2,688 3,072 3,072 3,072 3,264 3,168 3,072 2,688 Total credit purchase 0 47,964 43,746 56,796 64,488 71,472 71,772 68,772 58,764 54,768 36,372 25,188 Income Statement 2014 JAN FEB MAR APR MAY JUN JUL AUG SEP OCT NOV DEC TOTAL Sales 61,500 67,300 116,400 149,650 163,150 208,500 227,100 199,350 168,950 135,100 107,000 97,550 1,701,550 Cost of sales Opening Stock 0 48,140 85,510 117,940 144,640 174,710 181,760 175,110 166,730 165,570 153,070 137,350 1,550,530 Purchases 79,940 72,910 94,660 107,480 119,120 119,620 114,620 97,940 91,280 60,620 41,980 42,160 1,042,330 Closing stock 48,140 85,510 117,940 144,640 174,710 181,760 175,110 166,730 165,570 153,070 137,350 128,870 1,679,400 Total cost of sales 31,800 35,540 62,230 80,780 89,050 112,570 121,270 106,320 92,440 73,120 57,700 50,640 913,460 Gross profit 29,700 31,760 54,170 68,870 74,100 95,930 105,830 93,030 76,510 61,980 49,300 46,910 788,090 Overheads Website Design 2,500 0 0 0 0 0 0 0 0 0 0 0 2,500 Rent 1,000 1,000 1,000 1,000 1,000 1,000 1,000 1,000 1,000 1,000 1,000 1,000 12,000 Insurance 350 350 350 350 350 350 350 350 350 350 350 350 4,200 Payroll 4,000 4,000 4,000 4,000 4,000 4,000 4,000 4,000 4,000 4,000 4,000 4,000 48,000 Utilities 270 270 270 270 270 270 270 270 270 270 270 270 3,240 Marketing 4,500 3,500 1,000 1,000 1,000 4,500 4,200 1,000 1,000 1,500 1,500 1,500 26,200 Stationery and Office Expenses 120 120 120 120 120 120 120 120 120 120 120 120 1,440 Website maintenance and Support 150 150 150 150 150 150 150 150 150 150 150 150 1,800 Leased Service Van 350 350 350 350 350 350 350 350 350 350 350 350 4,200 Security System 30 30 30 30 30 30 30 30 30 30 30 30 360 Miscellaneous 40 40 40 40 40 40 40 40 40 40 40 40 480 Loan Interest 521 521 521 521 521 521 521 521 521 521 521 521 6,252 Total Overheads 13,831 10,331 7,831 7,831 7,831 11,331 11,031 7,831 7,831 8,331 8,331 8,331 110,672 Net profit 15,869 21,429 46,339 61,039 66,269 84,599 94,799 85,199 68,679 53,649 40,969 38,579 677,418 Statement of Financial Position 2014 JAN FEB MAR APR MAY JUN JUL AUG SEP OCT NOV DEC Non-current assets 17,500 19,500 21,500 22,500 22,500 32,500 32,500 32,500 32,500 32,500 32,500 32,500 Current Assets Inventory 48,140 85,510 117,940 144,640 174,710 181,760 175,110 166,730 165,570 153,070 137,350 128,870 Trade receivables 18,400 13,445 23,865 31,298 33,025 38,107 54,195 42,778 46,615 31,460 20,200 25,383 Cash 48,013 29,029 41,788 73,607 113,282 174,269 254,850 348,059 408,284 469,412 524,397 564,602 Total 114,553 127,984 183,593 249,544 321,017 394,136 484,155 557,566 620,469 653,942 681,947 718,854 Less current liabilities Trade payables 47,964 43,746 56,796 64,488 71,472 71,772 68,772 58,764 54,768 36,372 25,188 25,296 Cash overdrawn 0 0 0 0 0 0 0 0 0 0 0 0 Total 47,964 43,746 56,796 64,488 71,472 71,772 68,772 58,764 54,768 36,372 25,188 25,296 Working capital 66,589 84,238 126,797 185,056 249,545 322,364 415,383 498,802 565,701 617,570 656,759 693,558 84,089 103,738 148,297 207,556 272,045 354,864 447,883 531,302 598,201 650,070 689,259 726,058 Long Term loans 58,220 56,440 54,660 52,880 51,100 49,320 47,540 45,760 43,980 42,200 40,420 38,640 Net Assets 25,869 47,298 93,637 154,676 220,945 305,544 400,343 485,542 554,221 607,870 648,839 687,418 Financed by : Share capital 10,000 10,000 10,000 10,000 10,000 10,000 10,000 10,000 10,000 10,000 10,000 10,000 Profit and loss 15,869 21,429 46,339 61,039 66,269 84,599 94,799 85,199 68,679 53,649 40,969 38,579 Retained earnings 0 15,869 37,298 83,637 144,676 210,945 295,544 390,343 475,542 544,221 597,870 638,839 Total Equity 25,869 47,298 93,637 154,676 220,945 305,544 400,343 485,542 554,221 607,870 648,839 687,418 Check total 0 0 0 0 0 0 0 0 0 0 0 Ratios 2014 JAN FEB MAR APR MAY JUN JUL AUG SEP OCT NOV DEC TOTAL Profitability Gross profit ratio 48% 47% 47% 46% 45% 46% 47% 47% 45% 46% 46% 48% 46% Net profit ratio 26% 32% 40% 41% 41% 41% 42% 43% 41% 40% 38% 40% 40% ROCE ratio 61% 79% 89% 94% 95% 97% 98% 98% 98% 98% 98% 99% Liquidity or Solvency Current ratio or working capital ratio 2.39 2.93 3.23 3.87 4.49 5.49 7.04 9.49 11.33 17.98 27.07 28.42 Acid or Quick test 1.38 0.97 1.16 1.63 2.05 2.96 4.49 6.65 8.31 13.77 21.62 23.32 Efficiency Receivables collection period (days) 9 6 6 6 6 5 7 7 8 7 6 8 Payables payment period (days) 47 34 28 24 25 19 18 17 18 15 13 15 Inventory turnover (days) 41 15 19 18 17 19 21 19 17 14 12 12 Budget Summary Budget Summary   Sales £1,701,550 Gross Profit £788,090 Gross Profit Margin 46% Net Profit £677,418 Net Profit Margin 40% Return on Capital Employed 99% Break Even units 737.8133333 References Lon14: , (London School of Economic (LSE), 2014), Read More
Cite this document
  • APA
  • MLA
  • CHICAGO
(“Chain and Gear Business Expansion Plan 2014 Essay”, n.d.)
Chain and Gear Business Expansion Plan 2014 Essay. Retrieved from https://studentshare.org/finance-accounting/1634702-business-plan-case-study
(Chain and Gear Business Expansion Plan 2014 Essay)
Chain and Gear Business Expansion Plan 2014 Essay. https://studentshare.org/finance-accounting/1634702-business-plan-case-study.
“Chain and Gear Business Expansion Plan 2014 Essay”, n.d. https://studentshare.org/finance-accounting/1634702-business-plan-case-study.
  • Cited: 0 times

CHECK THESE SAMPLES OF Chain and Gear Business Expansion Plan 2014

Kudler Strategic Plan Part II

Customers are already The paper discusses the new strategy and implementation plan, the functional tactics with a work breakdown structure, a Gantt chart to define the timeline and the tasks and the deadline.... It also discusses the key success factors for the implementation plan.... It also includes the risks and the risk management along with a contingency plan.... Her perfect strategy with dogged determination to purse the goals had made the chain to remain afloat and also do brisk business despite the general slump in the industry....
5 Pages (1250 words) Essay

Debenhams Plcs Competitive Position in Its Various Markets

6% respectively (Global Business Browser, 2014).... A study of the external environment and cultural challenges brings forth the trend of challenges faced by Debenhams while the internal study and CSR initiatives highlight the key sustainability attempts towards challenging competition in retail business.... This paper "Debenhams Plc's Competitive Position in Its Various Markets" focuses on Debenhams Plc which is a departmental store chain that was established in 1993 in the United Kingdom....
23 Pages (5750 words) Essay

Strategic Supply Chain Report for Tata Motors

For instance, back in 1954, Tata Motors purposely entered a joint venture agreement with Daimler-Benz in Germany so as to penetrate the markets of commercial vehicles (The Economic Times, 2014).... To expand its market potential in the UK, Tata Motors decided to acquire Jaguar Land Rover and Daimler's brand on luxury cars from Ford Motor Company in 2008 (Zacks Investment Research, 2014).... As one of its business strategy, Tata Motors was able to successfully establish several assembly plants in six (6) different geographical areas throughout India (i....
6 Pages (1500 words) Case Study

Marketing Strategy of Kempinski

The hotel business had boomed till The wine trade business of Kempinski has been quite active from 1862 (Kempinski, 2014a).... The hotel group's target customers include wealthy and high profile individuals travelling for leisure, vacation or business.... The hotels also cater to various incentive groups and business conferences.... Reto Wittwer is the present CEO and Managing Director of the company… The global hotel chain engages more than 20000 employees....
8 Pages (2000 words) Research Proposal

Supply Chain Management and Logistics

nbsp;The move methodology created supply fastens to end up more dynamic, reflecting the flimsy additionally very guaranteeing business.... his paper stresses that one explanation behind changing supply chains are new circulation methodologies, which are controlled by expanding client administration desires, developed business sector scope, immediate channel structures, long haul channel connections, and developing gainfulness, stabilization, and vindication.... They have a supply chain management categorized under operational and strategic....
22 Pages (5500 words) Assignment

Youth Worker Training and Consulting Agency

CONNECTION, INC.... provides and presents information for the postmodern youth worker by providing workshops, speaking engagements, consulting and seminars to disseminate relevant information pertaining to all kinds of issues of Christian adolescents and teens.... Among other… things, the thematic areas covered include Relational skills, Teambuilding, Interpersonal Communication, Ongoing Personal Development, Understanding Family Dynamics, Understanding Youth Culture and Community Building....
14 Pages (3500 words) Essay

DWC Supply chain

BALAN SUNDARAKANIFor the Program of Master in Quality ManagementAtUniversity of Wollongong in DubaiMay 2014 Dubai, UAETable of content1.... Furthermore, where traveling and transport is a part of communication, DWC successfully serves through its airport and Jebel Ali Port (Linton, 2014).... The entire facility's master plan has been created based on the concept of extreme forward thinking.... It is a part of Dubai Strategic plan 2015....
1 Pages (250 words) Research Paper

KFC Marketing Plan

Economic forces restrict customers to spend lavishly in such fast food outlets (Ferrell & Hartline, 2014).... Government procedures and policies to a certain extent provide the required guidelines for smooth functioning of business operations of an organization (Ferrell & Hartline, 2014).... There are various economic forces that have a significant impact on the business operations of KFC (KFC, 2014a).... This organization is greatly affected by global and national economic factors such as inflation and interest rates, cost of labor, stages of business cycle, unemployment rates and growth rates of economy (KFC, 2014a; Pride & Ferrell, 2012)....
15 Pages (3750 words) Research Paper
sponsored ads
We use cookies to create the best experience for you. Keep on browsing if you are OK with that, or find out how to manage cookies.
Contact Us