StudentShare
Contact Us
Sign In / Sign Up for FREE
Search
Go to advanced search...

Statistics - Essay Example

Cite this document
Summary
There are a number of evidences which show that the concentration of atmospheric carbon dioxide has been steady increasing globally. This rise is attributed to increasing human…
Download full paper File format: .doc, available for editing
GRAB THE BEST PAPER95.4% of users find it useful
Statistics
Read Text Preview

Extract of sample "Statistics"

Download file to see previous pages

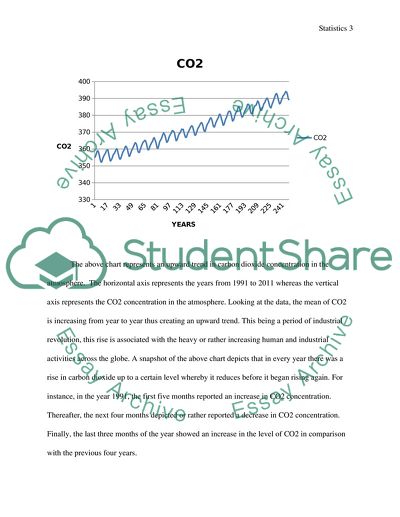
Therefore, this paper presents carbon dioxide data and a presentation of its trend over the years. In addition, the paper presents data on unemployment and house prices and their relationship in United Kingdom over the years. The above chart represents an upward trend in carbon dioxide concentration in the atmosphere. The horizontal axis represents the years from 1991 to 2011 whereas the vertical axis represents the CO2 concentration in the atmosphere. Looking at the data, the mean of CO2 is increasing from year to year thus creating an upward trend.

This being a period of industrial revolution, this rise is associated with the heavy or rather increasing human and industrial activities across the globe. A snapshot of the above chart depicts that in every year there was a rise in carbon dioxide up to a certain level whereby it reduces before it began rising again. For instance, in the year 1991, the first five months reported an increase in CO2 concentration. Thereafter, the next four months depicted or rather reported a decrease in CO2 concentration.

Finally, the last three months of the year showed an increase in the level of CO2 in comparison with the previous four years. Therefore, this rising trend in CO2 concentration is due to factors such as increased use of the fossil fuel across the globe and other agricultural or industrial activities that contribute to the emission of greenhouse gases into the atmosphere. Looking at the unemployment rate chart, there is a downward trend in the rate of unemployment over the years. The vertical axis is the rate of unemployment in every year whereas the horizontal axis is the years; from 1991 to 2013.

The mean of unemployment rate is reducing from year to year. For instance, the mean in the year 1991 is 7.675, in 1992 is 9.341 and in 1993 is 9.891667. The trend in house prices chart shows an upward trend in house price over the years. The horizontal axis of the

...Download file to see next pages Read More
Tags
Cite this document
  • APA
  • MLA
  • CHICAGO
(“Statistics Essay Example | Topics and Well Written Essays - 1000 words - 9”, n.d.)
Statistics Essay Example | Topics and Well Written Essays - 1000 words - 9. Retrieved from https://studentshare.org/finance-accounting/1628876-statistics
(Statistics Essay Example | Topics and Well Written Essays - 1000 Words - 9)
Statistics Essay Example | Topics and Well Written Essays - 1000 Words - 9. https://studentshare.org/finance-accounting/1628876-statistics.
“Statistics Essay Example | Topics and Well Written Essays - 1000 Words - 9”, n.d. https://studentshare.org/finance-accounting/1628876-statistics.
  • Cited: 0 times

CHECK THESE SAMPLES OF Statistics

Statistics assignment

If the Poisson events are occurring at a rate of λ per unit time, then we have fY (y) Statistics 302 Assignment 2 Report written by: Number: ”I confirm that I have not received help from, or given help to, anyone else in constructing thesolution to this assignment”______________________ NameQ1....
2 Pages (500 words) Statistics Project

Statistics/Probability

In 2001 the stock market took some big swings up and down.... One thousand investors were asked how often they tracked their investments.... The table below shows their responses.... What is the probability that an investor tracks the portfolio monthly? ... ... .... In a battleground state,… Assuming that there are only two parties - Democrat and Republican, if two voters are randomly selected for a telephone survey, what is the probability that they one is a Democrat followed by a Republican?...
2 Pages (500 words) Statistics Project

Statistics Assignment

The alternative hypothesis H1 is that perceived quality of merchandise is a determining factor of store image for shoppers at speciality stores than at discount stores, since it is a true hypothesis and the claim is to be a true one whereas the null hypothesis is that the… The minor problem may be due to the expected frequency of Unspecified for male is less than 5....
5 Pages (1250 words) Statistics Project

Descriptive Statistics

art I: Your first task it to do the following Descriptive Statistics Consider this scenario: You are on the Board of Directors of the National Parkinsons Association.... Your Statistics should be the same - math is math, but your decision might be different than mine or your peers.... So, explain why based upon the Statistics you have calculated.... able 1: Number of months that patients went without experiencing debilitating symptoms Group 1 resultsGroup 2 results 445536586101521822137245536 The following table summarizes descriptive Statistics for the results....
2 Pages (500 words) Statistics Project

Descriptive Statistics: Personal Expenditures and Determinants

Similarly, understanding Statistics on consumption helps business organizations in planning their productions, an aspect that affects wastes in storage cost, and goods that expire before sales.... Consumption, measurable through quantities of goods and services that individuals demand for in a period, is one of the aspects of economics, and it depends on factors whose understanding may be significant to consumers, producers, and intermediaries....
6 Pages (1500 words) Statistics Project

Inferential Statistics

The independent variables are App, Graphical User Interface (GUI) and functionality.... The study evaluates the consumer decisions in buying a smartphone in particular the set of attributes on the software (Del I.... Hawkins,… The primary data was collected at a cell phone shop and sampled 20 selling days....
6 Pages (1500 words) Statistics Project

Descriptive statistics

Based on the descriptive Statistics given in tasks 1 through 6 above, it is clear that there exists a significant difference in the pre-test and post-test for the Eccentric viewing (EV).... Out of the 12 people, 11 people improved while only one person never improved, this clearly… Based on the descriptive Statistics given in tasks 1 through 4 above, it is clear that there exists a significant difference in the average percentage of Consultations in which Trainees The mean for the experimental post-workshop was found to be 30 while that of control post-workshop was established to be 16....
4 Pages (1000 words) Statistics Project

Characteristics of Dutch Fashion Stores - Examining the Sales Model

6 Pages (1500 words) Statistics Project
sponsored ads
We use cookies to create the best experience for you. Keep on browsing if you are OK with that, or find out how to manage cookies.
Contact Us