StudentShare
Contact Us
Sign In / Sign Up for FREE
Search
Go to advanced search...
Free

Financial Analysis of Abiomed Incorporation - Research Paper Example

Cite this document
Summary
The paper "Financial Analysis of Abiomed Incorporation" discusses that ABMD has got the right track in making its way to profitability again. The only thing that can make the company more profitable is to increase its sales volume such that it directly influences the profitability of the company…
Download full paper File format: .doc, available for editing
GRAB THE BEST PAPER94.3% of users find it useful
Financial Analysis of Abiomed Incorporation
Read Text Preview

Extract of sample "Financial Analysis of Abiomed Incorporation"

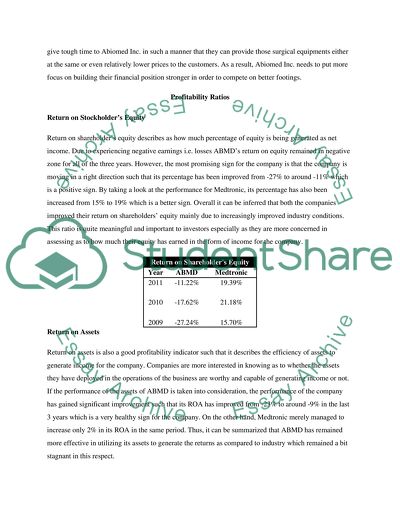
?Abiomed Inc. – Financial Analysis Executive Summary The financial performance of the Abiomed Inc. has been analyzed in this report such that the ratio analysis is the technique which is used to cover this financial analysis. Abiomed Inc. still in its loss making era, however, there are chances that the company might turn into profit zone in upcoming years. The performance of the company in other areas has remained better than the industry and the company seems to be quite safe due to less amount of debt included in its capital structure which can actually prevent it from the likelihood of bankruptcy. Introduction Those companies which suffer some losses and struggle in making their business operations more profitable provide a long term basis for investment especially to those investors who are risk takers. The potential for growth mainly lies with such companies as once these companies start coming back to profitable tracks they provide good returns especially to those investors who put their investment at stake in the bad times of those companies. However, the risk of losing money also exists such that there are chances that these companies may perform even more sluggish operations which in turn lead them towards the way to bankruptcy. Company Overview Among those companies which are going through their struggling phase of life, Abiomed Inc. is one of those companies. The company mainly develops surgical products especially for heart failing patients and provides those equipments to hospitals. This report provides a financial analysis of Abiomed Inc. for the past three years, as well as with its industry giant Medtronic Inc. This financial analysis is conducted with the help of ratio analysis in respect four broader categories which are 1) Profitability, 2) Efficiency, 3) Liquidity, and 4) Solvency. Competitive Environment and Market Conditions The competitive environment for medical and surgical equipments is quite intense especially for the equipments, which facilitate heart failing patients. The financial position of Abiomed Inc. is not as stable and strong as its competitors possess. The competitors can provide better equipments as they have latest technology and better infrastructure as compared to Abiomed Inc. These competitors have a tendency to give tough time to Abiomed Inc. in such a manner that they can provide those surgical equipments either at the same or even relatively lower prices to the customers. As a result, Abiomed Inc. needs to put more focus on building their financial position stronger in order to compete on better footings. Profitability Ratios Return on Stockholder’s Equity Return on shareholder’s equity describes as how much percentage of equity is being generated as net income. Due to experiencing negative earnings i.e. losses ABMD’s return on equity remained in negative zone for all of the three years. However, the most promising sign for the company is that the company is moving in a right direction such that its percentage has been improved from -27% to around -11% which is a positive sign. By taking a look at the performance for Medtronic, its percentage has also been increased from 15% to 19% which is a better sign. Overall it can be inferred that both the companies improved their return on shareholders’ equity mainly due to increasingly improved industry conditions. This ratio is quite meaningful and important to investors especially as they are more concerned in assessing as to how much their equity has earned in the form of income for the company. Return on Shareholder's Equity Year ABMD Medtronic 2011 -11.22% 19.39%     2010 -17.62% 21.18%     2009 -27.24% 15.70% Return on Assets Return on assets is also a good profitability indicator such that it describes the efficiency of assets to generate income for the company. Companies are more interested in knowing as to whether the assets they have deployed in the operations of the business are worthy and capable of generating income or not. If the performance of the assets of ABMD is taken into consideration, the performance of the company has gained significant improvement such that its ROA has improved from -23% to around -9% in the last 3 years which is a very healthy sign for the company. On the other hand, Medtronic merely managed to increase only 2% in its ROA in the same period. Thus, it can be summarized that ABMD has remained more effective in utilizing its assets to generate the returns as compared to industry which remained a bit stagnant in this respect. Return on Assets Year ABMD Medtronic 2011 -8.93% 10.18%     2010 -14.68% 11.03%     2009 -23.24% 8.78% Return on Sales Return on Sales is also known as Net Profit Margin which shows that how much percentage of sales is converted into income. This ratio is considered as quite significant such that it describes as to how much a company has earned in percentage terms with respect to the amount of sales. The return on sales ratio for ABMD has shown tremendous increase as it boosted from the worst ever ratio of around -43% to -11% showing an increase of massive 32%. It provides a hope to the company that with in next year or two the company can view the positive return on sales if it followed the same growth rate. On the other hand, Medtronic also remained successful in increasing its return on sales from 14% to 19% in the same period. However on cumulative basis, ABMD brought incredible improvement especially in this area of its financial performance. Return on Sales Year ABMD Medtronic 2011 -11.62% 19.43%     2010 -22.19% 19.59%     2009 -43.16% 14.18% Return on Operating Profits Operating profits are generally more observed as compared to gross profits due to their vastly increasing presentation in the financial statements. Normally gross profits are not shown directly these days however operating profits is a significant part of the financial statements. This ratio describes the percentage of sales which is converted into that profit which is available for distribution to the debt holders, shareholders and tax collection authorities. This profit is generated after incurring all costs and expenditures pertaining to generate sales. The operating profit margins for ABMD has shown solid improvisation such that with the ever decline negative operating returns of -40%, the company strongly came back and added up some 30% increase in its operating profit margin which remained at around -11% last year. Conversely, a bit fluctuating performance can be observed especially with Medtronic however it managed to increase from 16% to nearly 24% in past 3 years. Operating Profit Margin Year ABMD Medtronic 2011 -11.06% 23.37%     2010 -29.26% 25.09%     2009 -40.32% 16.71% Efficiency Ratios Inventory Turnover Inventory turnover mainly describes the rolling of the merchandize in a fiscal year. The higher the turnover of the inventory, lesser will be the chances for inventory to become obsolete. The inventory turnover for ABMD has experienced marvelous growth such as around 5 turnovers a year it has increased to 13 turnovers a year approximately which is a very healthy sign for the company. On the other hand Medtronic has shown sound and consistent turnover of around 10 every year which shows the stability of its inventory management. Inventory Turnover Year ABMD Medtronic 2011 13.48 9.40     2010 9.31 10.68     2009 4.95 10.24 Days inventory in hand Days inventory in hand, reflects the days a particular item takes from its inclusion to inventory till the time it is sold by the company. On 365 day count mechanism, the company used to take around 74 days a year to complete a particular cycle of inventory which has now been improved to merely 27 days. It means that the company is taking quite lesser time as compared to 2009 in order to complete its inventory cycle. A very consistent trend can be observed with the case of Medtronic where the company has maintained a range of 34 to 39 days to complete its inventory cycle depicting its stable performance in this area. Days Inventory in hand Year ABMD Medtronic 2011 27 39     2010 39 34     2009 74 36 Accounts Receivable Turnover Another important indicator to reflect whether a company is capable of collecting its credit from the debtors or not is shown accounts receivable turnover. The higher the receivable turnovers, the better will be the collection of receivables, thus, reducing the chances for uncollectible debts. ABMD has shown reasonable improvement in this area such that its turnover has increased from 4.66 turnovers a year to 6.58 turnovers a year. Conversely, Medtronic’s receivable pattern has shown a decent pattern of having 4 to 5 turnovers a year which reflects its sound policy and effective management in this regard. Receivable Turnover Year ABMD Medtronic 2011 6.58 4.17     2010 6.34 4.74     2009 4.66 4.67 Debtors Collection Period Debtors’ collection period, indicates the number of days required by a company to collect its debts after making sales to the customers. Earlier in 2009 the performance of ABMD was quite frustrating as the company used to take around 78 days to recover an average receivable from the customers. However, the company has remained successful in mitigating this period and in 2011 and now takes around 55 days a year to collect its receivables. Medtronic on the other hand has shown some interesting pattern in its receivable collection period such it takes around 80 odd days to collect its receivables which is a bit alarming sign for the company. From this, it seems as if ABMD has shown better performance from the industry. Debtors Collection Period Year ABMD Medtronic 2011 55 88     2010 58 77     2009 78 78 Accounts Payable Turnover Accounts payable turnover is a very important as well as sensitive ratio because either an increasing or decreasing trends of turnovers can provide harms to the company. The company needs to be very proactive in making its payment strategy to its creditors as too early payments can create cash shortage and too late payments can deteriorate the business terms with suppliers. In 2009, ABMD had just only 13 turnovers a year however they increased to around 23 in the next year. But now it is at 16 turnovers a year which seems to be more stable than the earlier periods. Medtronic on the other hand shows more promptness in making its payments to its creditors which can be witnessed by the higher accounts payable turnover as the company is slowly increasing number of turnovers a year from 39 turnovers to 31 turnovers till 2011. Payable Turnover Year ABMD Medtronic 2011 16.10 31.18     2010 22.77 37.66     2009 13.19 38.22 Creditors Payment Period Days taken by a company to complete a payment cycle, is denoted by creditors payment period. The performance of ABMD has remained a bit volatile such that it could not make up its appropriate number of days to make its payments. Currently the company takes around 23 days to make the payments to it creditors. On the other hand, Medtronic has a very stable and more frequent payment pattern to its creditors such it does not take more than 10 to 12 days to make its payments which shows their sound cash position as well. Creditors Payment Period Year ABMD Medtronic 2011 23 12     2010 16 10     2009 28 10 Liquidity Ratios Cash to Total Assets Ratio The cash ratio of the company identifies the percentage of assets which is in the form of cash and other cash equivalents. This ratio shows the ability to meet any contingency as well as provide a relatively safe heaven to the company. However, excessive availability of cash is also an alarming sign to the company which shows that the cash available could have been invested somewhere else to earn more returns. The cash ratio of ABMD has improved from 1.31% to 4.43% which is a better indicator to the company because Medtronic, the other industry giant, has been maintaining a cash ratio of around 4.54% to 5.39%. In this way ABMD seems to be on the right track following industry’s trends. Cash Ratio Year ABMD Medtronic 2011 4.43% 4.54%     2010 3.70% 4.98%     2009 1.31% 5.39% Current Ratio The current ratio of the company depicts the liquidity position of the company. It describes as in order to pay $1 of the current liability, how much amount company has in current assets to cover it. ABMD’s current ratio is at its declining phase such that it has decreased from 5.03 times to around 3.79 times. Still ABDM is well above the industry average which has been set by Medtronic that is under 2 times. Current Ratio Year ABMD Medtronic 2011 3.79 1.93     2010 4.58 1.92     2009 5.03 0.72 Quick Ratio Quick ratio describes even more liquid position of the company such that it wipes out the effect of inventories from the current assets due to their less liquid nature. Overall ABMD has maintaining a fairly better ratio which is around 3.5 times. This shows how liquid position of the company to finance its current liabilities. Medtronic however showed that in order to pay $1 current liability, it has around $1.6 liquid current assets to cover it. ABMD seems to be more liquid as compared to the industry patterns. Quick Ratio Year ABMD Medtronic 2011 3.46 1.57     2010 4.07 1.63     2009 4.19 0.58 Solvency Ratio Debt to Asset Ratio The leverage or riskiness of a company is best described by the Debt to Asset ratio which highlights the capital structure of the company. From this view, ABMD has a relatively lower amount of its assets financed by the debt holders. In 2009, the debt to assets ratio of the company was around 15% which now has increased to 20% till 2011. This shows that the company is highly safe as it has not taken too much debt to finance its assets which is indeed a very satisfying measure for the company. Medtronic however has around 45% debt to asset ratio which is relatively higher. Since it is an industry giant, therefore it sets out the example for other industry participants. As compared to industry, ABMD is on a very safe side due to lack of debt in its overall capital structure. Debt to Assets Ratio Year ABMD Medtronic 2011 20.40% 47.52%     2010 16.68% 47.92%     2009 14.69% 44.12% Debt to Equity Ratio This ratio basically meant for the capital structure of the firm. It describes the debt to equity ratio of the company in times. For instance, ABMD has debt to equity ratio of 0.26 which means that for $1 equity, the company has $0.26 debt in its capital structure. Medtronic on the other hand has been on a riskier side reflecting that it has $0.91 debt as compared to $1 equity in its capital structure. Debt to Equity Ratio Year ABMD Medtronic 2011 0.26 0.91     2010 0.20 0.92     2009 0.17 0.79 Interest Coverage Ratio This ratio describes as how much amount of profits a company has in order to pay its interest expenditure. A higher ratio is considered as a better one as it reflects that a company has more profits under its belt to cover its financing costs. Since ABMD has not taken too much interest bearing loans, therefore its interest expenses are negligible in this regard. Most of its liabilities come under current liabilities which do not lead to any interest payments. As a result of this, the interest coverage ratio has not been computed for ABMD. Conclusion From the above analysis, the performance of the ABMD has remained fluctuating such that in different areas, the company has shown different results. If profitability is taken into consideration, the company has been in a negative zone for more than 3 years. However, the improvement signs can be observed for ABMD in this regard. As far as the efficiency of ABMD is concerned, the company’s performance has remained quite volatile. The company performed better in terms of its inventory and receivable management but the company has remained far away from the industry practices in terms of its payable management such that taking too much time in making its payments. Liquidity position of the company is quite satisfactory as the company has more liquidity as compared to Medtronic which is a key figurehead in the overall healthcare industry. Solvency or leverage position of ABMD is also very satisfactory as the company is not burdened with too much debt and has a very safe capital structure as compared to industry trends. Recommendations It is quite evident from the company’s current financial perspective that ABMD has got the right track in making its way to profitability again. The only thing that can make the company more profitable is to increase its sales volume such that it directly influences the profitability of the company. As far as other areas of the company are concerned, the company’s performance has remained either in line with the industry practices or even better than the industry trends. So the company should focus more on gaining momentum to make better sales volumes to come out of the black hole of deep losses. Appendix Return on Shareholder's Equity Year ABMD Medtronic 2011 Net Income (11,755) -11.22% 3,096 19.39% Shareholders' Equity 104,743 15,968 2010 (19,024) -17.62% 3,099 21.18% 107,956 14,629 2009 (31,597) -27.24% 2,070 15.70% 115,983 13,182 Return on Assets Year ABMD Medtronic 2011 Net Income (11,755) -8.93% 3,096 10.18% Total Assets 131,588 30,424 2010 (19,024) -14.68% 3,099 11.03% 129,570 28,090 2009 (31,597) -23.24% 2,070 8.78% 135,958 23,588 Return on Sales Year ABMD Medtronic 2011 Net Income (11,755) -11.62% 3,096 19.43% Net Sales 101,151 15,933 2010 (19,024) -22.19% 3,099 19.59% 85,713 15,817 2009 (31,597) -43.16% 2,070 14.18% 73,210 14,599 Operating Profit Margin Year ABMD Medtronic 2011 Operating Profits (11,185) -11.06% 3,723 23.37% Net Sales 101,151 15,933 2010 (25,076) -29.26% 3,969 25.09% 85,713 15,817 2009 (29,518) -40.32% 2,440 16.71% 73,210 14,599 Inventory Turnover Year     ABMD   Medtronic 2011 Sales 101,151 13.48 15,933 9.40   Inventory 7,505 1,695   2010 85,713 9.31 15,817 10.68   9,211 1,481   2009 73,210 4.95 14,599 10.24       14,777     1,426   Receivable Turnover Year     ABMD   Medtronic 2011 Sales 101,151 6.58 15,933 4.17   Receivables 15,376 3,822   2010 85,713 6.34 15,817 4.74   13,516 3,335   2009 73,210 4.66 14,599 4.67       15,724     3,123   Payable Turnover Year     ABMD   Medtronic 2011 Sales 101,151 16.10 15,933 31.18   Payables 6,283 511   2010 85,713 22.77 15,817 37.66   3,764 420   2009 73,210 13.19 14,599 38.22       5,550     382   Days Inventory in hand Year     ABMD Medtronic 2011 365 365 27 365 39   Inventory Turnover 13 9   2010 365 39 365 34   9 11   2009 365 74 365 36       5   10   Debtors Collection Period Year     ABMD Medtronic 2011 365 365 55 365 88   Receivable Turnover 7 4   2010 365 58 365 77   6 5   2009 365 78 365 78       5   4   Creditors Payment Period Year     ABMD Medtronic 2011 365 365 23 365 12   Payable Turnover 16 31   2010 365 16 365 10   23 38   2009 365 28 365 10       13   38   Cash Ratio Year     ABMD Medtronic 2011 Cash 5,831 4.43% 1,382 4.54%   Total Assets 131,588 30,424   2010 4,788 3.70% 1,400 4.98%   129,570 28,090   2009 1,785 1.31% 1,271 5.39%       135,958   23,588   Current Ratio Year     ABMD Medtronic 2011 Current Assets 84,737 3.79 9,117 1.93   Current Liabilities 22,343 4,714   2010 82,668 4.58 9,839 1.92   18,064 5,121   2009 88,489 5.03 7,452 0.72       17,579   10,406   Quick Ratio Year     ABMD Medtronic 2011 Current Assets - Inventories 77,232 3.46 7,422 1.57   Current Liabilities 22,343 4,714   2010 73,457 4.07 8,358 1.63   18,064 5,121   2009 73,712 4.19 6,026 0.58       17,579   10,406   Debt to Assets Ratio Year       ABMD   Medtronic 2011 Total Liabilities 26,845 20.40% 14,456 47.52%   Total Assets 131,588 30,424   2010 21,614 16.68% 13,461 47.92%   129,570 28,090   2009 19,975 14.69% 10,406 44.12%       135,958   23,588   Debt to Equity Ratio Year       ABMD   Medtronic 2011 Total Liabilities 26,845 0.26 14,456 0.91   Total Equity 104,743 15,968   2010 21,614 0.20 13,461 0.92   107,956 14,629   2009 19,975 0.17 10,406 0.79       115,983   13,182   References Abiomed. (2010). Annual Report 2010. Retrieved April 20, 2012, from Abiomed: http://thomson.mobular.net/thomson/7/3007/4310/ Abiomed. (2011). Annual Report 2011. Retrieved April 20, 2012, from Abiomed: http://mobular.net/ccbn/7/3240/4525/index.html Medtronic Inc. (2010). Annual Report 2010. Retrieved April 20, 2012, from Medtronic Inc.: http://216.139.227.101/interactive/mdc2010/ Medtronic Inc. (2011). Annual Reprt 2011. Retrieved April 20, 2012, from Medtronic Inc.: http://216.139.227.101/interactive/mdt2011/ Yahoo! Finance. (n.d.). ABMD: Summary for Abiomed Inc. Retrieved April 20, 2012, from Yahoo! Finance: http://finance.yahoo.com/q?s=ABMD Yahoo! Finance. (n.d.). MDT: Summary for Medtronic Inc. Retrieved April 20, 2012, from Yahoo! Finance: http://finance.yahoo.com/q?s=mdt&ql=1 Read More
Cite this document
  • APA
  • MLA
  • CHICAGO
(“Financial Analysis of Abiomed Incorporation Research Paper”, n.d.)
Retrieved from https://studentshare.org/finance-accounting/1397579-financial-analysis-project
(Financial Analysis of Abiomed Incorporation Research Paper)
https://studentshare.org/finance-accounting/1397579-financial-analysis-project.
“Financial Analysis of Abiomed Incorporation Research Paper”, n.d. https://studentshare.org/finance-accounting/1397579-financial-analysis-project.
  • Cited: 0 times

CHECK THESE SAMPLES OF Financial Analysis of Abiomed Incorporation

An Analysis of Corporate Social Responsibility of the United Kindom Firms

This project "An analysis of Corporate Social Responsibility of the United Kindom Firms" discusses CSR reporting and the accounting aspects of CSR within organizations.... In addition, several factors were identified that affect the successful incorporation of CSR practices and policies within an organization....
60 Pages (15000 words) Capstone Project

Financial Strategies

Furthermore, the paper has undertaken a fundamental analysis of the effectiveness of the financial strategies that have been undertaken by the management of the various corporations reviewed in the research project.... The four corporations reviewed include 21Vianet Group incorporation from China, Microsoft Corporation from America, Pearson Corporation from United Kingdom and Abakanvagonmash from the Russian market.... Only 21Vianet Group incorporation employs debt financing more than equity as illustrated above....
16 Pages (4000 words) Essay

Environmental Analysis

Primarily, the connection bases its application on global financial crisis that affects most countries' financial statuses.... The competition increment allows for developments in technology and growth in influence of financial positions for each element of the market....
6 Pages (1500 words) Essay

Internal and External Analysis of General Motors

nbsp;… In the paper, analysis of the external environment of General Motors (GM) is done through the use of various analysis tools for the in-depth understanding of the external environment of GM and aid in the formation of perspective on the strategic issue.... The tools to be used in the paper aimed to analyze the external environment include PESTLE, Dominant Economic Features, Driving Forces analysis, Porter's forces, Strategic group map, competitor analysis framework, and key success factors....
16 Pages (4000 words) Research Paper

A Critical Analysis of the Film Avatar (2009)

The analysis will focus on the plot development and how themes relating to real life and matters affecting humans are presented.... The financial run out experienced by VA fits well in the experienced economic recession from 2008 across the world.... It is a science fiction film which was written and directed by James Cameron....
7 Pages (1750 words) Essay

Indonesian Expansion of Financial Products Retailer

The paper “Indonesian Expansion of financial Products Retailer ” considers it a promising strategy for COF, due to rapid industry's technological changes, short-lived commodity life cycles, and borderless markets promoted by globalization, stable political climate and market's steady growth.... hellip; Capital One financial Corporation (COF), a Fortune 500 US-based financial institution headquartered in Fairfax County, Virginia has been accredited to having initiated the mass marketing of credit cards....
13 Pages (3250 words) Coursework

Company Financial Position

Barely Edible CompanyPurpose of the case: Perform credit analysis of the Barely Edible CompanyCompetitive analysis: The structure of the company, unique product, and its class as premium fast foods gives it a competitive edge over the competitors.... Key financial concepts: Initial Public Offer (IPO), scenario analysis, and financial ratiosConclusion: The Company displays growth that is improving its financial position.... The following book review "Company financial Position" explores whether the company is in a position to qualify the revolving loan....
2 Pages (500 words) Book Report/Review

Does Walmart Help or Hurt Local Economy

describes the influence of Walmart's stores' incorporation on the economy of the United States and other host countries.... The author takes into account the development of Walmart's incorporation, its business strategies, and relations with its employees and government agencies.... hellip; Moreover, the project defines the remarkable contributions of Walmart stores incorporation into the economy of Arkansas and the living standards of its employees....
6 Pages (1500 words) Case Study
sponsored ads
We use cookies to create the best experience for you. Keep on browsing if you are OK with that, or find out how to manage cookies.
Contact Us