StudentShare
Contact Us
Sign In / Sign Up for FREE
Search
Go to advanced search...
Free

Portfolio: Creating a Logistic Model of Fish Population - Math Problem Example

Cite this document
Summary
In the above math problem 'Math Portfolio: Creating a Logistic Model of Fish Population', using the formulas, a logistic model is built in stages, which reflects the increase in the conditional population of freshwater fish that developed from 10,000 individuals placed in the lake created by the hydropower project, and a hypothetical increase in the fish population is determined…
Download full paper File format: .doc, available for editing
GRAB THE BEST PAPER91.4% of users find it useful
Math Portfolio: Creating a Logistic Model of Fish Population
Read Text Preview

Extract of sample "Portfolio: Creating a Logistic Model of Fish Population"

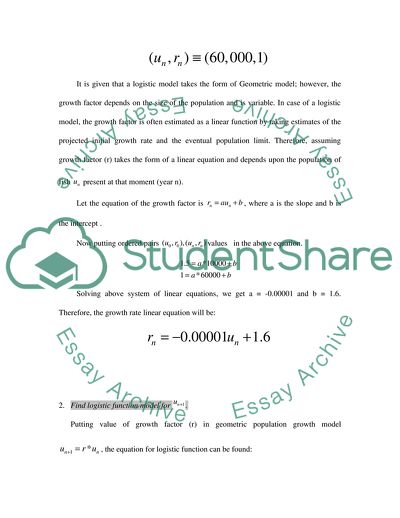
Math Portfolio: Creating a Logistic Model (HL Type II) A geometric population growth model takes the from where r is the growth factor and is the population at year n. For example, if the population were to increase annually by 20%, the growth factor is r = 1.2 and this would lead to an exponential growth. If r = 1 the population is stable. A logistic model takes a similar form to the geometric, but the growth factor depends on the size of the population and is variable. The growth factor is often estimated as a linear function by taking estimates of the projected initial growth rate and the eventual population limit. METHOD: 1. A hydroelectric project is expected to create a large lake into which some fish are to be placed. A biologist estimates that if 10,000 fish were introduced into the lake, the population of fish would increase by 50% in the first year, but the long-term sustainable limit would be about 60,000. Form the information above, write two ordered pairs in the form where . Hence, determine the slope and equation of the linear growth factor in terms of . It is given that if 10,000 fish were introduced into the lake, the population of fish would increase by 50% in the first year, therefore this will be the value for ordered pairand that will be equal to. Furthermore, the long-term sustainable limit is given as 60,000, which means that at this time there will be no further population increase (for fish). Therefore, the growth rate at this particular moment will be equal to 1 (.i.e. 0% increase in fish population thereafter), which means that the second ordered pair, will be . It is given that a logistic model takes the form of Geometric model; however, the growth factor depends on the size of the population and is variable. In case of a logistic model, the growth factor is often estimated as a linear function by taking estimates of the projected initial growth rate and the eventual population limit. Therefore, assuming growth factor (r) takes the form of a linear equation and depends upon the population of fish present at that moment (year n). Let the equation of the growth factor is , where a is the slope and b is the intercept . Now putting ordered pairs values in the above equation. Solving above system of linear equations, we get a = -0.00001 and b = 1.6. Therefore, the growth rate linear equation will be: 2. Find logistic function model for . Putting value of growth factor (r) in geometric population growth model , the equation for logistic function can be found: 3. Using the model, determine the fish population over the next 20 years and show these values using a line graph. Using the logistic function model derived above, the fish population over the next 20 years is shown in below table 1. From table 1, it can be seen that from year 17th onwards , the population of fish will be equal to the sustainable limit of 60,000. Table 1: The Fish Population over the Next 20 Years (initial population 10,000) Year (n) Population () 1 15000 2 21750 3 30069 4 39069 5 47247 6 53272 7 56856 8 58644 9 59439 10 59772 11 59908 12 59963 13 59985 14 59994 15 59998 16 59999 17 60000 18 60000 19 60000 20 60000 The line graph of the fish population over the Next 20 Years is shown in below figure 1. Figure 1: The Fish Population over the Next 20 Years (initial population 10,000) 4. The biologist speculates that the initial growth rate may vary considerably. Following the process above, fine new logistic function models for using initial growth rates 2, 2.3, and 2.5. Describe any new developments. For deriving new logistic function models for using initial growth rates 2, 2.3, and 2.5 , we need to find the values of the ordered pairs . It is given that the sustainable limit of fish population is 60,000, therefore, for the ordered pair , will be (60000, 1). Furthermore, for different initial growth rates 2, 2.3, and 2.5, the ordered pair values will be (10000, 2), (10000, 2.3) and (10000, 2.5) respectively. When , ordered pairs values will be and Taking linear equation as earlier, i.e. Putting the ordered pairs values in above equation, Solving above system of linear equations, the value of a = -0.00002 and b = 2.2. Therefore, linear growth rate equation will be: The logistic model function will be: When, ordered pairs values will beand Taking linear equation as earlier, i.e. Putting the ordered pairs values in above equation, Solving above system of linear equations, the value of a = -0.000026 and b = 2.56. Therefore, linear growth rate equation will be: The logistic model function will be: When , ordered pairs values will beand . Taking linear equation as earlier, i.e. Putting the ordered pairs values in above equation, Solving above system of linear equations, the value of a = -0.00003 and b = 2.8. Therefore, linear growth rate equation will be: The logistic model function will be: From above calculation for initial growth rates 2, 2.3, and 2.5, it can be seen that for higher values of initial growth rate the slope of the growth rate decreases and the intercept increases. 5. A peculiar outcome is observed for higher values of the initial growth rate. Show this with an initial growth rate r = 2.9. Explain the phenomenon. When , ordered pairs values will beand . Taking linear equation as earlier, i.e. Putting the ordered pairs values in above equation, Solving above system of linear equations, the value of a = -0.00003 and b = 2.8. Therefore, linear growth rate equation will be: The logistic model function will be: Let us compare the fish population over the next 20 years using the initial growth rates 1.5, 2, 2.3, 2.5, and 2.9. Table 2 shows the population of fish using logistic model derived for the initial growth rates of 1.5, 2, 2.3, 2.5, and 2.9. From table 2 data, it can be seen that as the value of initial growth rate (r) increases, the number of data that is greater than 60,000 (sustainable limit) also increases. For values of initial growth 2, 2.3, and 2.5, the number of records that is greater than 60,000 (sustainable limit) is approximately near to the sustainable limit of 60,000. However, for initial growth rate of 2.9, the number of records are alternatively greater than 60,000 (sustainable limit) and most of the times they are near to 70,000 limit. From given data the sustainable limit of fish population is 60,000. Therefore, it can be said for initial growth rate of 2.9 that fish population using linear growth rate equation cannot be modelled and a peculiar outcome will be observed. Similarly, for higher values of the initial growth rate (r >2.9) this can be true. Table 2: Fish Population over the Next 20 Years for different initial growth rates (r) Year (n) Population () r = 1.5 r = 2 r = 2.3 r = 2.5 r = 2.9 0 10000 10000 10000 10000 10000 1 15000 20000 23000 25000 29000 2 21750 36000 45126 51250 63162 3 30069 53280 62577 64703 55573 4 39069 60441 58384 55574 64922 5 47247 59908 60837 62953 52779 6 53272 60018 59513 57376 67261 7 56856 59996 60267 61893 48702 8 58644 60001 59849 58378 69611 9 59439 60000 60084 61218 44188 10 59772 60000 59953 58981 70739 11 59908 60000 60026 60784 41872 12 59963 60000 59985 59354 70716 13 59985 60000 60008 60504 41920 14 59994 60000 59995 59589 70721 15 59998 60000 60003 60324 41910 16 59999 60000 59999 59738 70720 17 60000 60000 60001 60208 41912 18 60000 60000 60000 59833 70720 19 60000 60000 60000 60133 41912 20 60000 60000 60000 59893 70720 6. Once the fish population stabilizes, the biologist and the regional managers see the commercial possibility of an annual controlled harvest. The difficulty would be to manage a sustainable harvest without depleting the stock. Using the first model encountered in this task with r = 1.5, determine whether it would be feasible to initiate an annual harvest 5,000 fish after a stable population is reached. What would be the new stable fish population with an annual harvest of this size? With 5,000 fish harvest, the logistic model function will be given by: Table 3: Fish population with an annual harvest of 5000 fish after stabilization Year (n) Population () r = 1.5 0 60000 1 55000 2 52750 3 51574 4 50920 5 50543 6 50323 7 50193 8 50115 9 50069 10 50041 11 50025 12 50015 13 50009 14 50005 15 50003 16 50002 17 50001 18 50001 19 50000 20 50000 Suppose the sustainable limit is reached (i.e. from start at year = 0), therefore, in first year the fish population will be same using the model function derived for initial growth rate (r) of 1.5. As now an annual harvest of 5,000 fish is made, therefore, the population after harvest will be equal to 55,000 and will be used for next period (i.e. for second year). Table 3 shows the population of fish for 20 years period assuming an initial sustainable limit of (population of fish) 60,000 at starting year. From table 3, it can be seen that the population of fish decreases as years goes on and the population of fish reaches at new sustainable limit of 55,000 (50,000+5,000) in 20 years time (19th years onwards). From above , it can be said that it would be not feasible to initiate an annual harvest 5,000 fish after a stable population is reached because than population of the fish will start decreasing and a new sustainable limit will be found as 55,000. 7. Investigate other harvest sizes. Some annual harvests will be sustainable, and others will cause the population to die out. Illustrate your findings graphically. Let H denotes let the harvest of fish. With H fish harvest, the logistic model function will be given by: Let us assume that the sustainable limit is reached (i.e. from start at year = 0), therefore, in first year the fish population will be same using the model function derived for initial growth rate (r) of 1.5. Let us calculate the fish population with harvest (H) values of 3,000, 5,000, 8,000, 9,000, 10,000, 15,000, 20,000, 30,000 and 40,000. Table 4, shows the fish population over 25 year’s period for these harvest size. From table 4, it can be seen that harvest size of up to 9,000 is sustainable for 25 years’ period. However, for harvest size of 10,000 the fish population dies in 25 years time; for harvest size of 15,000 the fish population dies in 8 years time; for harvest size of 20,000 the fish population dies in 5 years time; for harvest size of 30,000 the fish population dies in 3 years time and for harvest size of 40,000 the fish population dies in 2 years time. Table 4: Fish population with an annual harvest of 5000 fish after stabilization Harvest (H) 3000 5000 8000 9000 10000 15000 20000 30000 40000 Year (n) Population () 0 60000 60000 60000 60000 60000 60000 60000 60000 60000 1 57000 55000 52000 51000 50000 45000 40000 30000 20000 2 55710 52750 48160 46590 45000 36750 28000 9000 -12000 3 55100 51574 45862 43838 41750 30294 16960 -16410 4 54800 50920 44346 41923 39369 24294 4260 5 54650 50543 43288 40501 37492 17968 -13366 6 54574 50323 42522 39399 35930 10520 7 54535 50193 41954 38515 34579 725 8 54515 50115 41525 37790 33369 -13844 9 54505 50069 41197 37183 32255 10 54500 50041 40943 36667 31205 11 54498 50025 40746 36223 30190 12 54496 50015 40591 35836 29190 13 54496 50009 40469 35495 28183 14 54495 50005 40373 35193 27150 15 54495 50003 40297 34923 26069 16 54495 50002 40237 34681 24914 17 54495 50001 40189 34462 23656 18 54495 50001 40151 34263 22253 19 54495 50000 40120 34081 20653 20 54495 50000 40096 33915 18780 21 54495 50000 40077 33761 16521 22 54495 50000 40061 33620 13704 23 54495 50000 40049 33489 10048 24 54495 50000 40039 33367 5067 25 54495 50000 40031 33254 -2150 Below figure 2 based on table 4, shows the Fish Population over the Next 25 Years for Different Harvest sizes. Figure 2: The Fish Population over the Next 25 Years for Different Harvest sizes 8. Find the maximum annual sustainable harvest. Let H denotes let the harvest of fish. With H fish harvest, the logistic model function will be given by: For maximum sustainable harvest size (H): Therefore, For quadratic equation, the roots are given by: Therefore, using above formula, the value of will be: For real value of, i.e. Therefore, the maximum annual sustainable harvest will be equal to 9,000 fish for a given sustainable limit of 60,000. 9. Politicians in the area are anxious to show economic benefits from this project and wish to begin the harvest before the fish population reaches its projected steady state. The biologist is called upon to determine how soon fish may be harvested after the initial introduction of 10,000 fish. Again using the first model in this task, investigate different initial population sizes from which a harvest of 8,000 fish is sustainable. Table 5 shows the population of fish over 25 years period with different initial introduction of fish in lake and harvest of 8,000 fish using model function . Table 5: Different Initial Population Sizes and Harvest Size of 8,000 Fish Year (n) Different Initial Population Sizes 0 10000 15000 18000 20000 30000 40000 50000 55000 60000 1 7000 13750 17560 20000 31000 40000 47000 49750 52000 2 2710 12109 17012 20000 31990 40000 45110 46849 48160 3 -3737 9909 16326 20000 32950 40000 43827 45010 45862 4 6872 15456 20000 33863 40000 42915 43757 44346 5 2523 14341 20000 34714 40000 42247 42865 43288 6 -4027 12888 20000 35492 40000 41747 42210 42522 7 10960 20000 36190 40000 41367 41719 41954 8 8335 20000 36807 40000 41075 41346 41525 9 4641 20000 37344 40000 40848 41058 41197 10 -789 20000 37804 40000 40672 40835 40943 11 20000 38195 40000 40533 40661 40746 12 20000 38524 40000 40423 40525 40591 13 20000 38797 40000 40337 40417 40469 14 20000 39023 40000 40268 40332 40373 15 20000 39209 40000 40214 40264 40297 16 20000 39361 40000 40171 40211 40237 17 20000 39485 40000 40136 40168 40189 18 20000 39585 40000 40109 40134 40151 19 20000 39666 40000 40087 40107 40120 20 20000 39732 40000 40069 40086 40096 21 20000 39785 40000 40056 40068 40077 22 20000 39827 40000 40044 40055 40061 23 20000 39862 40000 40036 40044 40049 24 20000 39889 40000 40028 40035 40039 25 20000 39911 40000 40023 40028 40031 Figure 3 based on table 5 , shows the fish population over the next 25 years for different initial population and harvest of 8,000 fish Figure 3: The Fish Population over the Next 25 Years for Different initial population and harvest of 8,000 fish From above table 5, it can be seen that for initial introduction population less than 20,000 fish, the fish population dies out. It can be seen also for initial introduction size of 10,000 (in year 3), 15,000 (in year 6) and 18,000 (in year 10). For initial introduction population with size of 20,000 and 40,000 fish, the fish population never dies out and remains constant forever after harvesting of fish as initial introduction population size of fish i.e. 20,000 and 40,000 fish respectively. For other initial introduction population greater than 20,000 size the fish population after harvesting increases for next years and takes a sustainable limit of approximately 48,000 (40,000 after harvesting). Therefore, with an initial population of 20,000 or greater than 20,000 , a harvest of 8,000 fish is sustainable. Read More
Cite this document
  • APA
  • MLA
  • CHICAGO
(Math Portfolio: Creating a Logistic Model of Fish Population Problem, n.d.)
Math Portfolio: Creating a Logistic Model of Fish Population Problem. https://studentshare.org/environmental-studies/1712371-math-portfolio
(Math Portfolio: Creating a Logistic Model of Fish Population Problem)
Math Portfolio: Creating a Logistic Model of Fish Population Problem. https://studentshare.org/environmental-studies/1712371-math-portfolio.
“Math Portfolio: Creating a Logistic Model of Fish Population Problem”. https://studentshare.org/environmental-studies/1712371-math-portfolio.
  • Cited: 0 times

CHECK THESE SAMPLES OF Math Portfolio: Creating a Logistic Model of Fish Population

Dignity in Elderly care

A global aging population entails specific requirements.... Dignity is a comprehensive subject, which is predisposed to vary within the context of ethical and diverse cultural backgrounds.... It encompasses various intrinsic values ranging from freedom to love.... hellip; The term ‘dignity' derived from the Latin word dignitas or dignus that means worthy, can be defined as “quality of being worthy of honour” or “a sense of self-importance” (Collins Language....
80 Pages (20000 words) Essay

Managing Business Operations: UPS

It can also be done by configuring a broad portfolio of solutions for targeted industries.... The author examines operational management issues at the Olympics, UPS Operations Strategies, UPS enterprise strategy, principles of lean and agile thinking, Strategies to reduce carbon emitted to the air, Continuous Advancement, Carbon offsetting and how it works....
8 Pages (2000 words) Assignment

Advanced marketing strategy

However,one of the main criticisms is the obsolescence of the model in the current competitive market conditions, when new sources of competitive advantage are available to companies.... The new competitive conditions of the 21st century demands a re-formulation of this model in order to integrate the new business paradigms identified and applied by academics and professionals....
11 Pages (2750 words) Essay

International Marketing Research and Strategy for Topshop

t's co-branding with Kate Moss, the famous model earlier this year was a calculated move to give it a fresh thrust to move into the lucrative American and European markets, and it has since never looked back.... This had led the owners to think of expanding and have retained a consultant to advice on the best overseas market for their products. ...
16 Pages (4000 words) Essay

The notion of strategy in organizations

The paper comprises and thus will discuss the following sections: Definition of strategy; Strategy as a Plan or Ploy; Strategy as a position; Strategy as a perspective; Elements of strategy; Creation of strategy development; Strategic Analysis; Porter's Five Forces model; Threat of entry; Value chain analysis etc.... Porter's Five Forces model ... The study found that respondents were aware of other tools such as value chain analysis, competition analysis and portfolio analysis, but none used them....
15 Pages (3750 words) Essay

Business Plan for Online Apparel Business: Case of Bonanza Apparels

The Middle East has a burgeoning population of over 100 million and growing fast.... hellip; The modern way to do business is the B2C model and the advent of the internet and expansion of broadband connections have felicitated this greatly.... The paper “Business Plan for Online Business Bonanza Apparels” proved the brand's capability to succeed in the innovative online shop....
16 Pages (4000 words) Speech or Presentation

Dignity in Elderly Care

Derivations made from primary researches based on interviewing elderly patients at the geriatric ward, and a relational study of the provided care with the Picker Institute's dignity indicators, helped the researcher to analyze the quality of health services provided for the elderly population by the Maltese government.... While creating an awareness of the gulf separating humans from all other species can sensitize us to our potential for dignity” (Holmes, 2008, 130)....
88 Pages (22000 words) Thesis
sponsored ads
We use cookies to create the best experience for you. Keep on browsing if you are OK with that, or find out how to manage cookies.
Contact Us