StudentShare
Contact Us
Sign In / Sign Up for FREE
Search
Go to advanced search...
Free

Statistic Analysis - Essay Example

Cite this document
Summary
This paper 'Statistic Analysis' tells that it is observed that control group has the least snake approach response with mean 17.8 whereas the desensitization group possesses the highest snake approach response with mean score 27.1 followed by Film watching group with 24.8 as mean score and Modelling group with 21.0…
Download full paper File format: .doc, available for editing
GRAB THE BEST PAPER93% of users find it useful
Statistic Analysis
Read Text Preview

Extract of sample "Statistic Analysis"

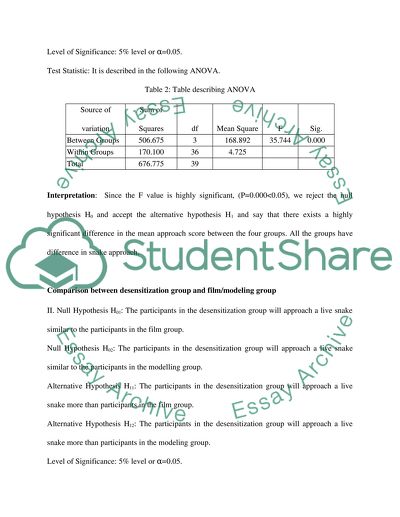
Analysis Before proceeding to the test of hypotheses, the descriptive statistics along with the mean, SD, SE are present in the following table. Table 1: Table showing the Descriptive Statistics for each group Variable N Mean SD SE 95% Confidence Interval for Mean Min. Max. Lower Bound Upper Bound Control 10 17.80 1.687 .533 16.59 19.01 15 21 Film 10 24.80 1.874 .593 23.46 26.14 22 28 Modelling 10 21.00 1.700 .537 19.78 22.22 19 24 Desensitisation 10 27.10 3.107 .983 24.88 29.32 22 32 Total 40 22.68 4.166 .659 21.34 24.01 15 32 From the above table (table 1) it is observed that control group has the least snake approach response with mean 17.8 whereas the desensitization group possesses the highest snake approach response with mean score 27.1 followed by Film watching group with 24.8 as mean score and Modelling group with 21.0 as mean score. After the descriptive statistics, we perform omnibus ANOVA to compare all the groups in one table. Null Hypothesis H0: There is no significant difference in the mean approach score between all the groups under consideration. In otherwords, all the groups have the same (equal) approach towards snake. ?1=?2=?3=?4. Alternative Hypothesis H1: There is a significant difference in the mean approach score between all the groups under consideration. In otherwords, all the groups do not have the same (equal) approach towards snake. ?1#?2#?3#?4. Level of Significance: 5% level or ?=0.05. Test Statistic: It is described in the following ANOVA. Table 2: Table describing ANOVA Source of variation Sum of Squares df Mean Square F Sig. Between Groups 506.675 3 168.892 35.744 0.000 Within Groups 170.100 36 4.725 Total 676.775 39 Interpretation: Since the F value is highly significant, (P=0.0000.05, we accept the null hypothesis H01 and conclude that the participants in the desensitization group have on par approach in handling live snakes with that of participants in the film group. On the other hand, we reject the null hypothesis H02 and accept the alternative hypothesis H12 and conclude that there is a highly significant difference in the mean scores between desensitization and modeling group. Desensitization group approach snake far better than modeling group. III. Comparison between modeling group and film group Null Hypothesis H0: The participants in the modelling group will approach a live snake more than the participants in the film group. Alternative Hypothesis H1: The participants in the modelling group will approach a live snake less than participants in the film group. Level of Significance: 5% level or ?=0.05. Interpretation: From the above table-3, since P=0.002 Read More
Tags
Cite this document
  • APA
  • MLA
  • CHICAGO
(“Statistical Analysis Essay Example | Topics and Well Written Essays - 2000 words”, n.d.)
Retrieved from https://studentshare.org/environmental-studies/1421332-statistical-analysis
(Statistical Analysis Essay Example | Topics and Well Written Essays - 2000 Words)
https://studentshare.org/environmental-studies/1421332-statistical-analysis.
“Statistical Analysis Essay Example | Topics and Well Written Essays - 2000 Words”, n.d. https://studentshare.org/environmental-studies/1421332-statistical-analysis.
  • Cited: 0 times

CHECK THESE SAMPLES OF Statistic Analysis

Statistic analysis of an exporting apple company

Statistic Analysis of an exporting apple company ... Examine all interesting effects, present important data, and consider problems in the analysis.... An apple exporting company is currently retrenching and would like to reduce the number of packers in one of their processing plants from 3 packers to only 2....
4 Pages (1000 words) Essay

Reflections on possible difficulties encountered in carrying out a country risk analysis

Experts name these “additional” risks as country risks, which, as Meldrum mentions, “arise from a variety of national differences… Country risk analysis (CRA) is used to find out how these potential risks may influence the return of internationally placed investments. ...
4 Pages (1000 words) Essay

The Statistic Analysis at Consumer Consumers Demand Service Through Social Media

The paper "The Statistic Analysis at Consumer Consumers Demand Service Through Social Media" provides a critical review of the article "Consumers demand services through social media" which reports on research findings about how consumers apply social media in seeking services.... hellip; According to the findings by NM insight, almost 50 percent of people who use social media in the United States look for services through the media....
1 Pages (250 words) Book Report/Review

Have You Experienced Gender Discrimination at Work

The female employment rate has climbed steadily from 53% in 1971 to 67% in 2011.... Gender inequity has become a controversy among the different workplaces.... In this research, the condition of gender equity and whether women have received the same career opportunities as men will be investigated....
5 Pages (1250 words) Essay

Determinants of Plasma Retinol and Beta-Carotene Levels

However, the determining factors of… Subsequently, the present research implemented t tests, nonparametric tests, and regression analysis in examining potential determining factors of these elements. A regression analysis was carried out to determine the impact The statistical analysis demonstrated that for this showed that sex was significant at the .... The first test that was carried out was a regression analysis.... This regression analysis examined the correlation between sex and plasma Retinol (ng/ml) levels....
3 Pages (750 words) Statistics Project

The Impact of Poverty on Childrens Learning

The data in this study was professionally collected in the form of the questionnaire from the intended persons before being subjected into the viable Statistic Analysis tools to realize dependable results.... The study was to confirm the poverty level in the rural areas of specific states in the US that were thought of making the state… The federal government depending on the outcome of the study intended to drastically reduce the level of assistance that was being levelled on the perceived poverty striken people of the state-this was following a policy program enacted The paper "Rural, Poverty-Level Mothers by Thurston and Navarrete" is a delightful example of a sociology article....
2 Pages (500 words) Article

Methods of Identifying and Preventing SQL Attacks

AMNESIA applies Statistic Analysis that develops models of different forms of queries that are generated by an application at a point of access to the database (Halfond and Orso, 174).... hellip; analysis, through a model referred to as AMNESIA, which is a technique integrating static analysis and monitoring runtime.... he other way of detecting the SQL injection attacks is through the Taint Based Approach, which uses the WebSSARI for the detection of input-validation concerning the errors through an analysis of the information flow....
5 Pages (1250 words) Report

Using SPSS to Analyse Taxes on Personal Income

his report provides an analysis of the taxes on the personal income of OECD countries based on the data set provided by OECD iLibrary.... Objectives:Main objective of the analysis is to establish:The variations on the taxes on personal income tax as a percentage of the GDP in the OECD countriesThe trend in the income tax as a percentage of the Gross domestic product across the OECD countries(for 10 years)The relationship between the personal income tax as a percentage GDP and the country's total revenue....
7 Pages (1750 words) Math Problem
sponsored ads
We use cookies to create the best experience for you. Keep on browsing if you are OK with that, or find out how to manage cookies.
Contact Us