StudentShare
Contact Us
Sign In / Sign Up for FREE
Search
Go to advanced search...
Free

X-Ray Chromatography - Essay Example

Cite this document
Summary
The essay "X-Ray Chromatography" talks about X-rays as electromagnetic radiations comprising of photons formed as a consequence of emission of an inner orbital electron followed by the transition of atomic orbital electrons from high energy to low energy state…
Download full paper File format: .doc, available for editing
GRAB THE BEST PAPER95.8% of users find it useful
X-Ray Chromatography
Read Text Preview

Extract of sample "X-Ray Chromatography"

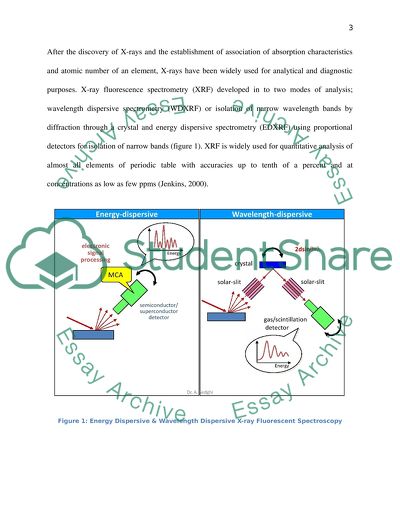
? TABLE OF CONT INTRODUCTION 3 PROPERTIES OF X-RAYS 4 PRINCIPLE 5 INSTRUMENTATION 8 SAMPLE PREPARATION 10 DETECTION LIMITS 10 ADVANTAGES 11 DISADVANTAGES 11 MAJOR APPLIACTIONS 11 ANALYTE 1: Chlorine (Cl). 11 Properties: 11 Analysis 12 ANALYTE 2: Uranium (U) 13 Properties 13 Analysis 14 CONCLUSION 16 REFERENCES 17 X-RAY SPECTROSCOPY INTRODUCTION X-rays are electromagnetic radiations comprising of photons formed as consequence of emission of an inner orbital electron followed by transition of atomic orbital electrons from high energy to low energy state. A beam of monochromatic X-ray photons incident on a sample may undergo either of the three processes namely absorption, scatter or fluorescence; and corresponding to these, X-ray based analytical methods can be classified into three categories viz radiography, diffraction and fluorescence spectrometry (Arai, 2006). After the discovery of X-rays and the establishment of association of absorption characteristics and atomic number of an element, X-rays have been widely used for analytical and diagnostic purposes. X-ray fluorescence spectrometry (XRF) developed in to two modes of analysis; wavelength dispersive spectrometry (WDXRF) or isolation of narrow wavelength bands by diffraction through a crystal and energy dispersive spectrometry (EDXRF) using proportional detectors for isolation of narrow bands (figure 1). XRF is widely used for quantitative analysis of almost all elements of periodic table with accuracies up to tenth of a percent and at concentrations as low as few ppms (Jenkins, 2000). Figure 1: Energy Dispersive & Wavelength Dispersive X-ray Fluorescent Spectroscopy PROPERTIES OF X-RAYS X-rays form a part of the electromagnetic spectrum between the wavelength ranges of 0.01-10nm. X-rays are produced when an accelerated electron collides with a target element thereby losing energy; the lost energy forming the X-rays. Less than 1% of the lost energy is used for X-ray production, rest being lost as heat. Ek = eV = 1/2mv2 Where, Ek – kinetic energy, e – Charge of electron (1.6 ? 10-19 C), V – Applied voltage, m – Mass of electron (9.11 ? 10-31 kg), v – Velocity of electron (m/s) Figure 2: X-ray spectrum of Mo at different voltages (Menke) PRINCIPLE Deceleration of an incident high energy electron beam by atomic electrons of the sample leads to emission of a band of radiations of broad wavelength termed continuum or white or polychromatic radiation or ‘bremsstrahlung’ (German for breaking radiation) (figure 2). For a sample comprising of multiple elements, white radiation leads to excitation of characteristic lines enabling identification of the constituent elements (Jenkins, 1999). X-ray beam with energy (E) incident on an element with binding energy (?) of the atomic electrons, such that E > ? might lead to emission of electrons from its orbital position. This phenomenon is known as photoelectric effect. Kinetic energy of the emitted electron = E-? The photoelectric effect results in formation of a characteristic peak when the hole in the inner shell is filled by a higher energy electron from the outer shell (figure 3). Figure 3: Schematic Representation of an X-ray Fluorescence Process (K, n=1; L, n=2; M, n=3) (Menke) However, each incident X-ray beam does not lead to single transition, but since atoms comprise of multiple orbitals, multiple transitions are possible. Each of these transitions result in a number of XRF peaks in the spectrum and are characteristic of the sample element (figure 4). Contrary to this some holes are filled by an internal rearrangement process (Auger effect) and therefore, do not result in characteristic spectrum. Fluorescent Yield = Number of holes resulting in Characteristic photon emission/ Total Number of holes For elements with low atomic number the fluorescent yield is very small. Moreover, fluorescent yield for L transitions is lesser than that for K transitions and that for M is even lesser. Selection rules for normal lines in spectral diagram require the principal quantum number (n) to change at least by 1, angular quantum number to change by (±1), and the azimuthal quantum number to change by 0 or 1. Thus K series can have only p to s transitions resulting in only two lines while L series can have p to s, s to p and d to p transitions. The basis of X-ray spectroscopy is Moseley’s derivation of the relationship between the wavelength of the characteristic X-ray photon (?) and the atomic number (Z) of the excited element (5). 1/ ? = K(Z-?)2 Where, K and ? are constants, K varying with spectral series and ? uniform. Commercial spectrometers utilize the K and L series and sometimes the M series (Jenkins, 2000). Figure 4: Multiple Peaks for an Element INSTRUMENTATION X-ray spectrometers can broadly be categorized in to two classes namely wavelength dispersive and energy dispersive instruments. These two categories can be further classified into many other types of instruments on the basis of differences in source of X-rays, number and speed of element detection and price. Examples of some common modifications are simultaneous wavelength dispersive, sequential wavelength dispersive, bremsstrahlung source energy-dispersive, secondary target energy dispersive. Irrespective of these differences X-ray spectrometers have three major components namely X-ray source unit, the spectrometer and the assessment unit (Potts, 2004). Figure 5: X-ray Fluorescence Spectrometer Figure 6: X-ray Energy Dispersive Spectrometer The most commonly used X-ray source is filament tube which provides the source of electrons, has high accelerating voltage and a metal target or anode. The electrons emitted due to high voltage strike the anode and produce X-rays, which are targeted to the sample through a thin beryllium window. Modern spectrometers also use rotating anode X-ray generators and synchrotron radiation sources. The emitted X-rays from the sample reach the X-ray detector which is a transducer that converts them into voltage pulses. Size of the voltage pulse generated by the detector is proportional to the X-ray photon energy and the rate of pulse production is same as rate of entry of X-ray photons into the detector. Output is usually displayed on a computer which shows the spectral lines (Menke). SAMPLE PREPARATION Sample preparation is critical in X-ray spectroscopy since physical properties of the sample are important factors affecting the accuracy of the result. Methods of sample preparation aim to ensure that the sample analyzed is representative of the total specimen. The major obstacles to the true representation of the specimen and uniformity of the different samples are variations in sample size, and composition. While liquid samples do not need much preparation, solid samples need surface treatment to overcome superficial heterogeneity. The two chief techniques of sample preparation for solids are fusion and pellet formation (Jenkins, 2000). DETECTION LIMITS Lowe limit of detection for X-ray fluorescence spectroscopy is defined as the concentration that that is equivalent to two standard deviations of the background counting rate. Thus lowest detection limits can be obtained when sensitivity of the instrument is high and the background is low. Though for most elements the detection limits is reasonably low lying in the lower ranges of parts per million, the sensitivity falls for very low atomic number elements falling in the extremely long wavelengths e.g. carbon, or oxygen. This is due to high absorption in this range and low fluorescence yield (Jenkins, 2000). ADVANTAGES XRF is highly suitable for bulk chemical analysis of major and trace elements in solid as well as liquid samples derived from wide variety of sources such as archeological sites, geological, biological, pharmaceutical and medicinal specimens, contaminants, and for forensic, electronic and machinery analysis. It can detect almost all elements with atomic numbers above 11 (Menke). DISADVANTAGES XRF has very poor detection limits for elements with atomic number below 11. Being based on atomic numbers, XRF cannot differentiate the isotopes of an element. For the same reason, also cannot differentiate between different ionic forms of atom of the same element (Jenkins, 2000). MAJOR APPLIACTIONS ANALYTE 1: Chlorine (Cl). Cl concentration in a sample of nuclear fuel is determined using Total Reflection X-ray Fluorescence (TXRF) spectrometry. Properties: Properties of chlorine are enlisted in table 1. Table 1: Properties of Chlorine (Cl) (Chlorine institute) Atomic & Molecular Properties Atomic Symbol Cl Atomic Weight 35.453 Atomic Number 17 Molecular Weight 70.906 Physical Properties Boiling Point -33.97?C Density 3.213 kg/m3 Freezing Point -100.98?C Specific Gravity Gas, 2.485 (air); Liquid, 1.467 0/4?C Vapour Pressure 368.9kPa at 0?C; 778.8 kPa at 25?C Viscosity Standard Gas: 0.0125 mPa.s at 0?C; Liquid: 0.3863 mPa.s at 0?C Chemical Properties Valence -1. Also +1, +3, +4, +5, +7 Chemical reactions: with water With metals With organic compounds Sparingly Soluble (0.3 to 0.7%) Reacts with Al, As, Au, Hg, Se, Te, Sn, Ti Highly reactive Analysis Quantitative determination of trace elements such as chlorine is an important quality control procedure for nuclear materials to ensure efficient and safe operation of nuclear reactors. Chlorine is usually determined in these samples by ion chromatography and spectrophotometry after its isolation in form of HCl. Advances in the technique of XRF spectrometry and development of TXRF technique for analysis of trace elements has led to its use in determination of levels of Cl in (U, Pu)C fuel as described by Misra and associates (2008). Application of routine XRF techniques to determination of Cl levels is a difficult and inaccurate procedure because of the low fluorescence yield and matrix effects. TXRF however, can be efficiently used due to negligible matrix effects and high detection efficiency. The analytical procedure does not require isolation of Cl in form of HCl. However, complete drying of the sample is an essential prerequisite of the procedure, in absence of which the slight acidic nature acquired by the solution formed removes Cl in form of HCl. Thus an erroneous result indicating absence of Cl is obtained. This is the major limitation of the method. The problem has been solved by using a slightly alkaline medium for preparation of chlorine samples. A clear spectrum exhibiting separate peaks for Cl, Ar and S also is obtained (figure). The concentrations of chlorine obtained are within 15% of expected concentrations with a precision of 15%. Figure 4: TXRF spectrum of processed (U, Pu)C sample (Misra et al., 2008) ANALYTE 2: Uranium (U) Quantitative determination of levels of U in water sample is done using TXRF and µXRF. Properties Properties of uranium are enlisted in table 2. Table 2: Properties of Uranium (Characteristics of Uranium and its compound, 2001) Atomic & Molecular Properties Atomic Symbol U Atomic Weight 238.0289 Atomic Number 92 Molecular Weight 70.906 Physical Properties Boiling Point 3818?C Density 18950 kg/m3 Freezing Point 1132.3?C Specific Gravity Gas, 2.485 (air); Liquid, 1.467 0/4?C Vapour Pressure 368.9kPa at 0?C; 778.8 kPa at 25?C Viscosity Standard Gas: 0.0125 mPa.s at 0?C; Liquid: 0.3863 mPa.s at 0?C Chemical Properties Valence +6, +4 Chemical reactions: with water and acids With non metals Soluble Reacts with O, S, Cl, F, P, Br Radioactivity All 11 isotopes of U radioactive Analysis Uranium present in water resources close to uranium mining sites is a public health hazard with exposure limits being as low as 3µg/gm kidney tissue. It is important to determine the levels of U in water sources used for public purposes. A comparative analysis of different analytical methods for determination of U levels in environmental samples has been presented by Alsecz & associates (2007). Traditionally used methods have limited detection limits (DL) such as fluorimeter (DL of 10µ/l), inductive couple plasma mass spectrometry (ICP-MS) (DL in ng/l). TXRF spectroscopy has a DL in the low range of µg/l, and uses 5-20µl of solution dried and the solid film residue used for TXRF measurement. Two set ups Ag anode X-ray tube along with cryogenic Si(Li) detector, and Mo anode with Si drift detector (SDD) was used. The former gave a DL of 27.3µg/l (figure 5), while latter detected it to be 17.4µ/l (figure 6). Single particle analysis using laboratory µ-XRF was also performed and for a particle of 50µm thickness, a DL of 250µg could be reached. Figure 5: TXRF spectrum of 500µg/l U standard solution using Ag anode X-ray tube and Si(Li) detector (Alsecz et al., 2007) Figure 6: TXRF spectrum of the water sample using Mo anode X-ray tube and SDD detector (Alscez et al., 2007) Thus, even though ICP-MS gives a lower DL, TXRF has an advantage over ICP-MS, since it can be used for on-site uranium analysis and for quantitative determination of uranium contamination. Among the two set ups of TXRF used, Ag anode is able to detect U-L? lines as well and therefore gives a better identification, however the Mo anode has lower DL. Microscopic heterogeneity between particles at contamination sites can be determined by quantitative determination using both µ-XRF and EPMA (electron probe microanalysis). Of these laboratory µ-XRF is good for preselction of uranium rich particles (U content >0.5% weight of particle), and it can be followed by other techniques such as EPMA, µ-Raman, µ-XRD. CONCLUSION Conclusively, X-rays are widely used for quantitative and qualitative elemental analysis. Their non invasive and non ionizing nature makes them useful in medical diagnostic procedures and also for pharmaceutical, forensic, Availability of efficient X-ray sources and simple instrumentation makes it a popular analytical technique. Various modifications of the basis XRF technique such as TXRF and µ-XRF add to the sensitivity and usefulness of the technique. In the chlorine estimation of nuclear fuels, TXRF proved to be more efficient than ion chromatography and spectrophotometry since it does not require complicated sample preparation and also gives much accurate results than routine XRF. Similarly in uranium level estimation in mining sites, TXRF is preferred technique compared to fluorometry and (ICP-MS) since it provides possibility of onsite determination. Moreover, µ-XRF can be used to detect single particle level of uranium using simpler instrumentation compared to EPMA. Thus XRF and its various modifications are widely used and still developing group of efficient analytical technique. REFERENCES 1. Alsecz, A., Osan, J., Kurunczi, S., Alfoldy, B., Varhegyi, A., & Torok, S. (2007). Analytical performance of different X-ray spectroscopic techniques for the envionmental monitoring of the recultivated uranium mine site. Spectrochimica Acta , 769-76. 2. Arai, T. (2006). Introduction. In B. Beckhoff, B. Langhoff, B. Kanngiefer, R. Wedell, & H. Wolff, Handbook of practical X-ray fluorescnce analysis (pp. 1-26). Berlin: Springer. 3. Characteristics of Uranium and its compounds. (2001). Retrieved April 2011, from US department of energy office of environmental management depleted Uranium Hexafluoride management program: http://web.ead.anl.gov/uranium/pdf/UraniumCharacteristicsFS.PDF 4. Jenkins, R. (1999). X-Ray fluorescence analyis. In E. Lifshin, X-ray characterization of materials (pp. 171-210). Weinheim: Wiley-VCH. 5. Jenkins, R. (2000). X-ray techniques: overview. Retrieved April 2011, from Spectroscopy now: www.spectroscopynow.com/FCKeditor/.../Enc_Anal_Chem_6801.pdf 6. Menke, D. (n.d.). Properties of X-ray. Retrieved April, from EH&S, Stanford University: http://www.stanford.edu/group/glam/xlab/MatSci162_172/LectureNotes/01_Properties%20&%20Safety.pdf 7. Misra, N. L., Dhara, S., Mundher, K. D., Aggarwal, S. K., Thakur, U. K., Shah, D., et al. (2008, October). Chlorine determination in (U, Pu)C fuel by total reflection X-ray fluorescence spectrometry. BARC newsletter (Founder's day special issue) , pp. 165-9. 8. Potts, P. J. (2004). X-ray fluorescence analyis. In K. A. Smith, & M. S. Cresser, Solid and environmnetal analyis (pp. 247-304). NY: Marcel Dekker, Inc. 9. Properties of chlorine. (n.d.). Retrieved April 2011, from Chlorine Institute: http://www.chlorineinstitute.org/files/PDFs/Clproperties1.pdf Read More
Cite this document
  • APA
  • MLA
  • CHICAGO
(“Ion chromatography Essay Example | Topics and Well Written Essays - 1500 words”, n.d.)
Retrieved from https://studentshare.org/environmental-studies/1417456-ion-chromatography
(Ion Chromatography Essay Example | Topics and Well Written Essays - 1500 Words)
https://studentshare.org/environmental-studies/1417456-ion-chromatography.
“Ion Chromatography Essay Example | Topics and Well Written Essays - 1500 Words”, n.d. https://studentshare.org/environmental-studies/1417456-ion-chromatography.
  • Cited: 0 times

CHECK THESE SAMPLES OF X-Ray Chromatography

Gas Chromatography

chromatography is a Greek word which originated from the word chroma standing for the word color.... Gas chromatography is identified by the fact that the carrier gas is formed in the mobile phase.... Gas chromatograph is an instrument used to perform gas chromatography.... Gas chromatography is different from other forms of chromatography because the solutions are always in gas state as they travel through the column....
7 Pages (1750 words) Term Paper

Smarties Chromatography

This experiment, using principles in chromatography, will find out what makes up the colors of Smarties, one of the most popular, if not colorful, candies today.... One of the most common methods of utilizing this appeal comes in the colors foods are presented to us. The title of the project will be Smarties chromatography and the main objective will be to identify the colors that make up Smarties candies and to identify the corresponding chemicals that are used for these colors....
4 Pages (1000 words) Research Paper

The Long Process of Forensic Investigation

The paper 'The Long Process of Forensic Investigation' presents the first step in the long process of forensic investigation, the collection of evidence was already done.... “The white powder, the mirror, the roll of cling film and clothing from all three suspects were removed”.... hellip; The initial examination of the clothing was also finished....
8 Pages (2000 words) Case Study

Downstream Processing of Recombinant Proteins in E.coli

Maltose binding protein and Glutathione-S- transferase are found to bind well with the protein and can be removed by using the affinity chromatography techniques.... This essay declares that escherichia coli is the most widely used system for the production of recombinant proteins....
4 Pages (1000 words) Essay

CHIRAL CHROMATOGRAPY

The purpose of this paper is to discuss chiral chromatography in the separation of enantiomers.... Gas chromatography (GC), high performance liquid chromatography (HPLC), thin layer chromatography, and supercritical fluid chromatography have been developed for chiral separations (Davankov, 1470; Cretu et al.... Capillary zone electrophoresis, capillary gel electrophoresis, electrokinetic chromatography and capillary electro chromatography are potential alternatives to chromatographic techniques....
4 Pages (1000 words) Research Paper

High Performance Liquid Chromatography

The author of this assignment "High Performance Liquid chromatography" touches upon the method of separating and identifying the components of a mixture.... nbsp;chromatography techniques are important in the treatment of patients overdosed on illicit drugs.... The task of separating and identifying the components of the illicit drugs and is an arduous one and chromatography is applied in such cases (Allman 2010).... In both high-performance liquid chromatography and gas chromatography utilize columns, which are narrow tubes filled with the stationary phase, in which a mobile phase is passed....
8 Pages (2000 words) Assignment

Fast Protein Liquid Chromatography

This term paper "Fast Protein Liquid chromatography" focuses on a method of separation utilized in laboratories for separation of chemicals dissolved within the same solvent.... The physical factors are such as;It (chromatography) is thus seen to exploit the differences in partitioning behavior between a mobile phase and a stationary phase to separate the components in a mixture.... Several terminologies are associated with the process of chromatography;The purpose of purifying proteins with FPLC is to deliver quantities of the target protein at sufficient purity....
6 Pages (1500 words) Term Paper

Principles of Chromatography

This research paper "Principles of chromatography" presents an easily applicable method for the analysis of ink components and to avoid any sample loss of analyses and contamination.... The processes used here are for separating ink pigments with the use of paper chromatography.... chromatography uses the differences in solubility and adsorption.... chromatography is a method that is used to analyze mixtures by separating them into the chemicals they were made from (Warren, 2005)It is derived from the Greek words 'Chromat' which means color and 'graphon' which means to write....
7 Pages (1750 words) Research Paper
sponsored ads
We use cookies to create the best experience for you. Keep on browsing if you are OK with that, or find out how to manage cookies.
Contact Us