StudentShare
Contact Us
Sign In / Sign Up for FREE
Search
Go to advanced search...
Free

The Behavior of the SAG Mill - Report Example

Cite this document
Summary
This report "The Behavior of the SAG Mill" the behavior of the SAG mill during grinding purpose is of utmost importance. we can observe that the behavior of SAG mills is highly nonlinear at maximal throughput. The efficiency of the SAG mill is taken into consideration as it is crucial to the mining process. …
Download full paper File format: .doc, available for editing
GRAB THE BEST PAPER97.9% of users find it useful
The Behavior of the SAG Mill
Read Text Preview

Extract of sample "The Behavior of the SAG Mill"

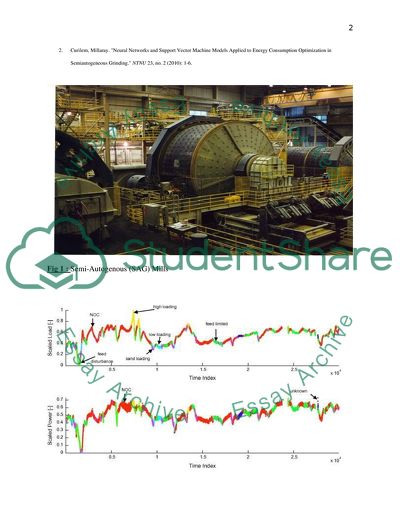
Report - Recurrence Quantification Analysis of Semi-Autogenous Mills Brief Review of Recurrence Quantification Recurrence quantification has an important role to play in this physical world as we depend upon observation, measurement and analysis largely. For this purpose, it is important to view data in linear and non – linear form. This is exactly where the linear or non – linear data come into play. Linear data is naturally simple and predictable which makes scientific investigation easy but when it comes to animate realm, non linear data has great importance. This is because animate world consists of living and non – living system and with this complexity non – linear data comes into play. Here, recurrence is a part of animate realm and analysis of matters takes a mathematic underpinning spontaneously. Although recurrence quantification analysis (RQA) is scantly a decade old the concept of recurrence in mathematics.1 has a much longer history .However, any appreciation of nonlinear dynamics and associated terms the reader brings to the table (fractals, attractors, non-stationary, singularities, etc.) will greatly facilitate the comprehension of recurrence analysis”. Thus, recurrence quantification analysis can be identified as an important part of semi- autogenous mills. The semi – autogenous mills are used in mining as it is the main equipment for grinding purpose. The aim during SAG operation is to work under conditions that imply the maximum installed power consumption; this means working under unstable operating conditions. SAG operational control has shown to be complex.2 1. Webber, Charles L. "Recurrence Quantification Analysis of Nonlinear Dynamical Systems." National Science Foundation 3, no. 10 (2000): 1-69. 2. Curilem, Millaray. "Neural Networks and Support Vector Machine Models Applied to Energy Consumption Optimization in Semiautogeneous Grinding." NTNU 23, no. 2 (2010): 1-6. Fig 1 : Semi-Autogenous (SAG) Mills Fig 2 :Controller States of SAG Mill in Time Domain Here the SAG mill behavior plays an important role as it can be varying in nature. It can be seen that mill behavior often not continuous, between discrete system states. Fig 3: SAG mill movement 1.1 An Overview of Recurrence plot In this study, the behavior of the SAG mill during grinding purpose is of utmost importance. Here we can observe that the behavior of SAG mills is highly nonlinear at maximal throughput. And it can also be inferred from power consumption. Here the efficiency of SAG mill is taken in to consideration as it is crucial to the mining process. In the past, when primary, secondary and tertiary crushers fed material directly to large ball mills, the energy efficiency of the concentrator was determined for the most part by the ball mill operation, whereas now the energy.3 efficiency of a plant often rests largely on the SAG mill operation. As a result, mines have shifted their emphasis in optimization from ball mills to SAG mills. 3.Outotec, . "Outokumpu Technology’s TPLTM for elimination of material transport problems Read more at http://www.ferret.com.au/c/outote c/outokumpu-technology-s-tpltm-for-elimination-of-material-transport-problems-." Ferret. http://www.ferret.com.au/c/outotec/outokumpu-technology-s-tpltm-for-elimination-of-material-transport-problems-n670204 . When it comes to application of recurrence plots in the analysis of powder systems, there are many aspects which need to be assessed. Recurrence plots basically is a plotting based method which is modern and uses nonlinear data analysis. The initial purpose of RPs is the visual inspection of higher dimensional phase space trajectories. The view on RPs gives hints about the time evolution of these trajectories.4 the advantage of RPs is that they can also be applied to rather short and even non stationary data. The recurrence plot uses time series and it displays a given moment in time. The recurrence plot allows an investigation of different phase space and period nature of a trajectory through a phase space. Basically, recurrence plot helps to investigate different aspects of m- dimensional phase space trajectory through a two – dimensional representation. The recurrence plot works with the help of time series and it shows when the time series visit the same region of phase space. In recurrence plot the indexes time is placed on the x- axis and y axis and the hidden recurring patterns is located. 5If the analyzed time series is deterministic, then the recurrence plot shows short line segments parallel to the main diagonal which correspond to sequences (i,j),(i + 1,j + 1),…(i+k,j+k), such that that xmj ,xmj+1,...xmj+k are close to xmi ,xmi+1,...xmi+k.5 4.Creative Commons, . "Recurrence Plots and Cross Recurrence Plots." Creative Commons. http://www.recurrence-plot.tk/glance.php. 5. Franch, Jorge B. "Recurrence Plots in Nonlinear Time Series." Department of Economic Analysis 3, no. 1 (2000): 1-18. 2. Methodology The recurrence plot is constructed with the help of time series data which is presented in the form of high and low value. When it is the issue of recurrence plot it is highly essential that the process turn completely mathematical .It can be understood from the recurrence plot depiction that it is nothing but a visual display of square recurrence matrix of distance elements including a cut off limit. In this experiment, there is a utilization of two dimensional approach so that there is a clear picture as to the operation of SAG mills in two different time phases. The two models of the SAG mills which is LS-SVM and NN dynamic models were observed during the study. Here the time series .Here, the time series plot is used to get the accurate conclusion with the experimental study. A time series plot is a graph which has the ability to evaluate patterns and behavior of the data at a specific time phase. A time series plot showcases the y- axis against equally spaced time intervals on the x-axis. Time series plots of various physiological phenomena suggested some type of periodicity. Unlike physical data, physiological data tended not to show clear tendencies save for obvious effects such as trends. 6 Basically recurrence plots are depended upon the mutual distance between points on a trajectory .Here the first step in the construction would be to select the minimum and maximum norms. In the study, there is specification regarding the feed distance and speed of the SAG mill and this gives insight into the display of recurrence plot as to the low and high value. 6.ZBILUT, JOSEPH P. "RECURRENCE QUANTIFICATION ANALYSIS: INTRODUCTION AND HISTORICAL CONTEXT." NDES 21, no. 1 (2005): 1-8. Fig 4 : Recurrence plot with low value Fig 5 : Reccurence plot with high value With the help of time delays in relation to scalar series xi it is possible to arrive at embedded vectors. xm i = (xi,xi+d,xi+2d,...,xi+(m−1)d) Here m can be taken as embedding dimension and d is seen as the time delay. So if m ≥ 2n + 1, then a single output variable is enough to completely produce the dynamics of the working system of a SAG mill. If he time series which is analyzed remain deterministic ,then the recurrence plot can show short line segments parallel to the main diagonal which correspond to sequences (i, j), (i + 1,j + 1),...(i + k, j + k), such that xmj ,xmj+1,...xmj+k areclose to xmi ,xmi+1,...xmi+k. Here the analysis done with the equation m = 3, τ = π/2 and ε = 1.5 Xi+1 = Yi + 1.0 – (1.054Xi Yi+1 = 0.3Xi Now the bi-variate scatter plot is constructed with the help of the data for the distance and speed of the SAG mill. Scatter diagram, plot (Statistics), a diagram having two variates plotted along its two axes and in which points are placed to show the values of these variates for each of a number of subjects, so that the form of the association between the variates can be seen.7 And it is seen as below ; 7.Friendly, Michael. "HE EARLY ORIGINS AND DEVELOPMENT OF THE SCATTERPLOT." Journal of the History of the Behavioral Science 41, no. 2 (2005): 103-30 Fig 6 ; Bivariate Scatter Plot Results In this experiment 10 examples were used and each example possessed the filling level and bearing pressure at t inputs and the filling level at time t + 1 as the output. The values attributed to power were -5 to 15 but the best results were observed for C=2-1.92 and this means the solution need a low complexity to derive at a good generalization .It can be seen that the SAG mills operated at different pace when it was the question of time.SAG milling is arguably the most commonly used method of comminuting in mineral processing.8 SAG mill control fundamentally means managing the load in the mill by adjusting the feed rate of ore to the mill and/or manipulating the rotational speed of the mill. The SAG mill has a complex behavior while in grinding process. They exhibit complex behavior and also display a non – linear behavior at various time series phases. It is seen that 8.Thornton, Andrew. "SAG Mill Control; It should not be that hard." Engineering and Mining Journal. Accessed May 20, 2015.http://webcache.googleusercontent.com/searc h?q=cache:LpkVHKj zxDsJ:www .e-mj.com/featurees/307-sag-mill-control-it-shouldnt-be-that-hard.html+&cd=11&h l=en&ct=clnk&gl =kw#.VVzNI1JGRB8. their operation efficiency is dynamic during the delay times. In this study , it was understood that the methodological analysis of time series play a significant role. The problem with the operation of the SAG mill was determined to solve with particular care. The time lag in the SAG mill with regard to its operation is fundamental. Once identified the model of the SAG mill can be utilized for forecasting the operational level in a one – step – ahead movement. Here ,it was observed that the prediction of the operational efficiency of the SAG mill is much more difficult than OSA predictions . Hence, the model that performed better as an MPO predictor was taken as efficient one. The results assessed are coherent because the NAMAX models of the mill were used in the experiment which has a more complex behavior. Here, the delay input errors is taken into consideration to arrive at a better result. The NARX model performed better than the NN and this confirmed the capacity and operational benefit of the SAG mills. Conclusion This paper present LS-SVM and NN dynamic models of the SAG mill to be the better performers and they were observed to act as state estimators incase of the filling level variable with regard to semi-autogenous grinding process. These models used the MPO predictors and the results showed that the performance of the LS-SVM outcast the performance of the NN and also their motion around different time series where varying. The SAG process seen in this study, could be of great importance as it would give insight into designing of better SAG mills with better performance. The SAG mill can be predicted to be having desirable operational conditions with higher energy efficiency that can be acquired by using knowledge based estimation algorithms . References Curilem, Millaray. "Neural Networks and Support Vector Machine Models Applied to Energy Consumption Optimization in Semiautogeneous Grinding." NTNU 23, no. 2 (2010): 1-6. Creative Commons, . "Recurrence Plots and Cross Recurrence Plots." Creative Commons. http://www.recurrence-plot.tk/glance.php. Franch, Jorge B. "Recurrence Plots in Nonlinear Time Series." Department of Economic Analysis 3, no. 1 (2000): 1-18. Friendly, Michael. "HE EARLY ORIGINS AND DEVELOPMENT OF THE SCATTERPLOT." Journal of the History of the Behavioral Science 41, no. 2 (2005): 103-30. Outotec, . "Outokumpu Technology’s TPLTM for elimination of material transport problems Read more at http://www.ferret.com.au/c/outotec/outokumpu-technology-s-tpltm-for-elimination-of-material-transport-problems-." Ferret. http://www.ferret.com.au/c/outotec/o utokumpu-technology-s-tpltm-for-elimination-of-material-transport-problems-n670204. Thornton, Andrew. "SAG Mill Control; It should not be that hard." Engineering and Mining Journal. Accessed May 20, 2015.http://webcache.googleusercontent.com/searc h?q=cache:LpkVHKj zxDsJ:www .e-mj.com/featurees/307-sag-mill-control-it-shouldnt-be-that-hard.html+&cd=11&h l=en&ct=clnk&gl =kw#.VVzNI1JGRB8. Webber, Charles L. "Recurrence Quantification Analysis of Nonlinear Dynamical Systems." National Science Foundation 3, no. 10 (2000): 1-69. ZBILUT, JOSEPH P. "RECURRENCE QUANTIFICATION ANALYSIS: INTRODUCTION AND HISTORICAL CONTEXT." NDES 21, no. 1 (2005): 1-8. Read More
Cite this document
  • APA
  • MLA
  • CHICAGO
(The Behavior of the SAG Mill Report Example | Topics and Well Written Essays - 1750 words, n.d.)
The Behavior of the SAG Mill Report Example | Topics and Well Written Essays - 1750 words. https://studentshare.org/engineering-and-construction/1876330-mining-and-metallurgy
(The Behavior of the SAG Mill Report Example | Topics and Well Written Essays - 1750 Words)
The Behavior of the SAG Mill Report Example | Topics and Well Written Essays - 1750 Words. https://studentshare.org/engineering-and-construction/1876330-mining-and-metallurgy.
“The Behavior of the SAG Mill Report Example | Topics and Well Written Essays - 1750 Words”. https://studentshare.org/engineering-and-construction/1876330-mining-and-metallurgy.
  • Cited: 0 times

CHECK THESE SAMPLES OF The Behavior of the SAG Mill

Equal Treatment: Need of Physically Challenged People

Equal Treatment: Need Of Physically Challenged People Name of the of the University Preparation For The Assignment For this assignment, I had to imagine myself restricted to wheelchair or motorized scooter for at least three hours in order to understand the lives of physically challenged people in depth....
5 Pages (1250 words) Research Proposal

Afro Samurai

e was part of a violent environment leading him to become one of those people around him, especially in behavior.... In fact, the very symptom showing that Afro acquired such violent behavior from his immediate environment was his ability to wear the same type of clothing his father was also dressing in.... He was part of a violent environment leading him to become one of those people around him, especially in behavior.... In fact, psychology points this out as important role of environment and that is to influence human behavior (Feldman 17)....
3 Pages (750 words) Essay

Humans Are Determined

He asks to imagine a cow tied to a rope five meter in length.... The cow can do whatever it wants within the domain of this length.... Beyond this length is what we know as… If the cow acts in a proper way, there is a high probability that its owner will lengthen the rope or even set it free....
5 Pages (1250 words) Essay

Application: Topic: Applying Theory to Specific Settings and Populations

These two theories form a basis for two main approaches in clinical psychology, one based on studying behavior of patients while the other focuses on understanding the internal functioning of one's mind.... Behavior theory is also vital in treatment of patients because it helps to change behavior of individuals and bring it back to normal through conditioning.... Two main theories that are relevant to clinical psychologists are behaviorism or behavior theory and cognitive theories (Compas & Gotlib, 2002)....
2 Pages (500 words) Essay

Answer the question

The teleost fish disclose much diversity in terms of environment preference, body form, adaptations and behavior.... The circannual rhythm occurs with a difference of one year under persistent surroundings and presumes a time of one year under natural environment (Berthold 83).... The migrant birds… In addition, the birds do not moult in time for energy-demanding period (Norris and Lopez: 44). The consequence of anisogamy is that it creates sexual competition and conflict....
1 Pages (250 words) Essay

WE ARE A COFFEE SHOP CHAIN IN CANADA AND WE ARE EXPANDING TO BRAZIL

First, leadership, it will comprise the continuity and commitment of two individuals who will coordinate and lead the enterprise.... The… The coordinators should be able to work in every sector from understanding the aspects of the business to creating support at the community level, to government actors and markets Also, they need to understand the cross-sectional issues and have constant attention to securing public or private investments (Nag, Hambrick, & Chen, 2007)....
4 Pages (1000 words) Essay
sponsored ads
We use cookies to create the best experience for you. Keep on browsing if you are OK with that, or find out how to manage cookies.
Contact Us