StudentShare
Contact Us
Sign In / Sign Up for FREE
Search
Go to advanced search...
Free

Measuring Tensile Properties of Metal Specimens - Essay Example

Cite this document
Summary
This work called "Measuring Tensile Properties of Metal Specimens" describes the strength and several elastic and inelastic properties of metal specimens to compare the recorded values of each property of the materials with the values reported in the literature. The author outlines the variations in the performance of materials in load. 
 …
Download full paper File format: .doc, available for editing
GRAB THE BEST PAPER91.9% of users find it useful
Measuring Tensile Properties of Metal Specimens
Read Text Preview

Extract of sample "Measuring Tensile Properties of Metal Specimens"

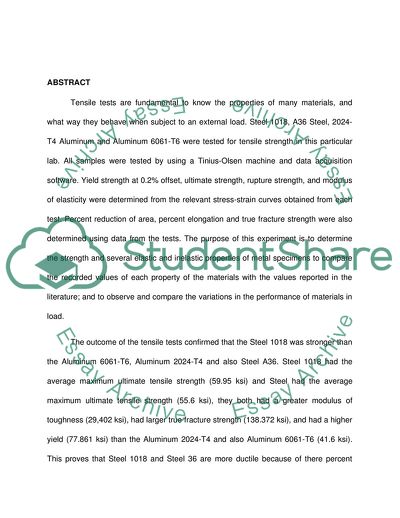
Lab # 3: Measuring Tensile Properties of Metal Specimens Fahd Alyami CE-206-B Walkup 02/06 TABLE OF CONTENTS Page Number Abstract 3 Introduction 5 Background 6 Methods and Procedures 10 Results and Discussion 13 Summary and Conclusion 18 References 19 Appendixes 20 ABSTRACT Tensile tests are fundamental to know the properties of many materials, and what way they behave when subject to an external load. Steel 1018, A36 Steel, 2024-T4 Aluminum and Aluminum 6061-T6 were tested for tensile strength in this particular lab. All samples were tested by using a Tinius-Olsen machine and data acquisition software. Yield strength at 0.2% offset, ultimate strength, rupture strength, and modulus of elasticity were determined from the relevant stress-strain curves obtained from each test. Percent reduction of area, percent elongation and true fracture strength were also determined using data from the tests. The purpose of this experiment is to determine the strength and several elastic and inelastic properties of metal specimens to compare the recorded values of each property of the materials with the values reported in the literature; and to observe and compare the variations in the performance of materials in load. The outcome of the tensile tests confirmed that the Steel 1018 was stronger than the Aluminum 6061-T6, Aluminum 2024-T4 and also Steel A36. Steel 1018 had the average maximum ultimate tensile strength (59.95 ksi) and Steel had the average maximum ultimate tensile strength (55.6 ksi), they both had a greater modulus of toughness (29,402 ksi), had larger true fracture strength (138.372 ksi), and had a higher yield (77.861 ksi) than the Aluminum 2024-T4 and also Aluminum 6061-T6 (41.6 ksi). This proves that Steel 1018 and Steel 36 are more ductile because of there percent reduction in area ranging to 50.50% and a percent elongation ranging to 17.6% compared to Aluminum2024-T4 and Aluminum 6061-T6. Steel is stiffer meaning it deforms less for a given load but it is also more ductile because it deforms more than aluminum prior to final rupture. Therefore, it is an ideal choice for engineers. However, aluminum is lighter and less susceptible to corrosion. INTRODUCTION For the selection of engineering materials, standard tensile testing parameters are useful. It helps in the choice of the majority of suitable materials for many projects and to develop new techniques to alter the material’s properties so that it can be customized and the material can be used for the particular application. The purpose of this experiment is to determine the tensile strength of Steel 1018, A36 Steel, 2024-T4 Aluminum and Aluminum 6061-T6 using the Tinius-Olsen machine and data acquisition software. Also the strength and several elastic and inelastic properties of the stated metal specimens are measured and compared. Finally a comparison of the recorded values of each property of the metal specimens with the values reported in the literature and observing and comparing the variations in the performance of materials in load. To achieve the objectives, 16 metal specimens – 4 specimens each of A36 steel, 1018 steel, 6061-T6 aluminum, and 2024-T4 aluminum were tested in uniaxial tension to failure. Load and strain data from the tests was used to determine the material properties of the specimen and results were compared among specimens and to reference values. BACKGROUND When a sample is placed to an external force under load, the metal will experience plastic and elastic deformation. Initially, there will be an elastic deformation of the metal which gives linear relationship between extension and load. To determine stress and strain, above said two parameters are used. When the sample undergoes elastic deformation, the engineering strain-stress relationship obeys the Hooks Law and when we plot graph and the curve obtained which has the slope shows the Youngs modulus or Modulus of Elasticity. Beyond elastic deformation, if we consider the stress-strain curve, if the external force under load persists, yielding take places at the initial stage of plastic deformation. The stress due to yield can be found by taking the ratio of load at yielding by the original cross-sectional area of the sample. The yield point occurrence shows the higher yield point and then it is followed by a rapid reduction in the stress till the lesser yield point is reached. The elongation at the yield point, the sample persists to expand without a major change in the level of stress. On increase of load is then followed with rise in strain. Above the yielding point, if there is a continuous load will lead to the rise in the stress that results in permanent deformation of the sample. At this stage, the sample is work hardened or strain hardened. If the external force is constantly applied, the curve of stress-strain will reach the higher point, which is called as the ultimate tensile strength. In this condition, the sample can resist the maximum stress before necking occurs, this can be monitored by the decrease in the area of cross-section of the sample usually observed at the center of the gauge length. And tensile ductility of the sample is the ability to deform before breaking which can be represented as percentage reduction or percentage elongation in area. Plastic deformation is not identical after necking, and decrease in the stress is observed until fracture occurs. The fracture strength can be determined from the ratio of load during fracture to the original area of cross-section. A material’s response to a tensile load can be determined using a static tension test. This test is an essential mechanical tool where a specimen is loaded in a controlled way and the applied load and strain in the specimen are recorded. The parameters such as modulus of elasticity, yield point, yield strength, ultimate tensile strength, percent elongation, rupture strength, reduction in area and other tensile properties are determined from the tensile test results. On performing tensile test, a plot of load against elongation curve is determined which is after that converted to a stress against strain curve. Both engineering strain and engineering stress are determined by taking the ratio of elongation to load by constant values of each specimen’s information. The curve of stress-strain is then plotted and this matches the load-elongation curve. Curve for stress-strain will tell about the applied stress to the consequential strain and each material has its own distinctive stress-strain curve. True stress is actually determined when an instate nous load acts on an instate nous cross-sectional area and is related to engineering stress. On the other hand true strain is as a result of the instate nous increase in the instate nous gauge length In the tensile test, the specimen shows deformation which is elastic, and the relationship between stress-strain is called Hookes law. In this case the ratio of stress to strain is constant. From the graph, slope we get in which stress is directly proportional to the strain and this is called as modulus of elasticity or Youngs modulus. Modulus of elasticity (E) describes the characteristics of a material when it undergoes deformation, there will be a stress. When stress is relieved, it returns to the original shape, so it is used to measure the stiffness of the given sample. By dividing the stress by the strain of the material the modulus of elasticity is determined. Since there is no unit for strain, the unit for modulus is psi or MPa which is same as the stress. At some point in a ductile material, the stress-strain curve diverges from the straight line relationship, and Hooke’s Law no longer applies because the strain changes more rapidly than stress. When it happens, there will be a permanent deformation that take places in the specimen (material will not return to its original even the load is removed). The sample will react plastically in this condition and there will be an increase in stress or load. This is the yield point at which this change happens as the material permanently deforms (plastically). The gradual change that takes place from elastic to plastic character with most materials, it is hard to determine the exact position at which the occurrence of plastic deformation. The 0.2% offset method is used to define the yield strength. This method involves offsetting a line parallel to the initial portion of the stress-strain curve by 0.2% strain and finding the stress corresponding to that intersecting point of that line with the stress-strain curve. The ultimate tensile strength (UTS) can also be determined by tensile test. It is the highest stress point achieved in a tensile test. In ductile materials, UTS occurs in the plastic section of stress-strain curve. For brittle materials, we can observe UTS very near to the elastic limit and at the end of the linear-elastic section in the stress-strain curve. The measure of expansion of a material which is deforming before the break is called the ductility of a material. It is imperative to note that plasticity is directly proportional to ductility. Ductility of a material is a very important parameter for a material when it is considered for forming operations like rolling and extrusion. Ductility can also indicate how noticeable damage due to overload to a component which become sooner than the fracture of a component. The reduction of cross-sectional area at fracture and the strain at fracture or the elongation are the usual gauges of ductility. METHODS AND PROCEDURES Test Specimen A total of 16 specimens, four each of four different materials were tested to failure. The materials included A36 Steel, 1018 Steel, 2024-T4 Aluminum, and Aluminum 6061-T6. By following the procedures indicated below, the necessary data used for solving the tensile properties were achieved. Testing Procedure The diameter of each specimen was measured three times using standard calipers and averaged. Then, gage marks were made on the longitudinal axis of the specimen using a two inch gage punch. The specimen then was threaded into the Tinius-Olsen testing machine and an extensometer was attached to the specimen. A tensile load was applied to the specimen at a rate of 0.125 in./min. until after yielding occurred but before necking was observed, at an approximate offset strain of 0.5%. A suitable testing program was selected to plot the curve of stress versus strain and the achievement program loaded to download the test data (load, strain and elongation. Removal of the extensometer from the specimen after the material starts to yield but before necking begins results to loading of the specimen. Ultimate load and load at rupture were recorded when the test continued until rupture of specimen. The geometry and appearance of the structure was noted. Analytical Procedures In Table 3 and Table 4, the calculated values for the tensile properties of Steel and Aluminum are presented respectively. Modulus of elasticity, the yield point and the yield strength were computed using the stress-strain diagram while the other properties were computed using the formulas listed below. The modulus of elasticity can be determined by taking any two spots on the modulus line, and divided the degree of difference among their values of stress in psi unit from the strain degree of difference. The distance between the modulus line and any line which is parallel to it is the offset. On the graph the point of intersection is the stress-strain curve at a particular point (Y is the point in Figure 1 and Figure 2). The Yield Strength at 0.2% Offset is the ordinate of at the point (the amount of stress in psi) (See appendix for calculation). a. Modulus of Elasticity (E) (1) where: σ = stress and ε = strain b. Yield Strength at 2% offset (σ0.2%y) σ0.2%y = (2) where: P0.2% = load at 0.2% and Ao = original cross-sectional area c. Ultimate Strength (σTS) σTS = (3) where: Pmax = ultimate load d. Rupture Strength (σfracture) σfracture = (4) where: Pfracture = rupture load e. True Rupture Strength ( σfracture) σfracture = (5) where: Af = final cross-sectional area f. Percent Reduction (%RA) %RA = x 100 (6) g. Percent Elongation (%Elongation) %Elongation = x 100 (7) where: Lf = final gage length and Lo = original gage length RESULTS AND DISCUSSION Table 1 shows the data recorded in testing the Steel 1018 specimen and Table 2 is for Aluminum 6061-T6. For the yield load at 2% offset it was computed since the data recorded was the yield strength at 2% offset, just simply multiply the cross-sectional area to its yield strength at 2% offset. Presented below are the stress-strain diagram of the Steel 1018 and Aluminum 6061-T6. Figure 1. Steel 1018 Key Vertical axis: stress(psi) Horizontal axis: strain in./in Figure 2. Aluminum 6061-T6 Key Vertical axis: stress (psi) Horizontal axis: strain in./in The true fracture strength, gives a better view of the true stress at fracture. The steel 1018 had a higher true fracture strength compared to aluminum 2024-T4, Aluminum 6061-T6 and also Steel A36. The data of the standard deviations which are observed to be low, and not going beyond 2.042 ksi, which suggests that the result was reliable and also the procedure was convincing and repeatable. The value is much larger than engineering fracture strength. The modulus of elasticity which was found to be highest for the Steel 1018 compared to the rest of the specimens (i.e. 29,402 ksi, for Steel 1018 and for Aluminum6061-T6 it was 10,349 ksi), and also the ultimate tensile strength was much higher. Ultimate stress was more in this case because of its strain hardening as the sample was deformed plastically. By introducing dislocations which reduced their movement, and the material became stiff. The Aluminum 6061-T6 is precipitation hardened because it is a tempered and aged alloy. When compared to the Steel 1018, Aluminum 6061-T6 and Aluminum 2024-T4 have a low ultimate tensile strength because they will not strain harden quickly. The standard deviations of the rupture strength and the yield strength are little when comparing to the typical values that proves the consistency in the data. The percent area of reduction and the elongation percent shows the ductility of a material. All the values are shown in Table 1 - 4. If the material is more ductile, then it will have a higher percent of elongation, and the material will neck down more and which results in a higher decrease of area. The Steel 1018 materials had the highest reduction of area because of the big amount of necking very soon before fracture and also having greater percent of elongation. The Aluminum 6061-T6 and Aluminum 2024-T4 did not elongate more as the steel 1018 and also Steel A36 because of the alloying of the samples and the precipitation hardening was helpful to enhance other properties. Table 1.Steel 1018 Property Group #1 Group #2 Group #3 Group #4 Average Standard Deviation Yield Strength (ksi) 86.6 87.1 87.2 89.7 87.65 1.392 Ultimate Strength (ksi) 59.303 59.6 58.431 59.6 59.234 0.553 Rupture Strength (ksi) 59.204 62.5 58.333 60 60.009 1.794 %Reduction of Area 57.21% 53% 52.94% 51.5% 53.66% .0246 %Elongation 18.4% 17.85% 16.85% 17.45% 17.64% .0065 Table 2. Aluminum 6061-T6 Property Group #1 Group #2 Group #3 Group #4 Average Standard Deviation Yield Strength (ksi) 47.1 44.4 46.9 46.9 46.325 1.289 Ultimate Strength (ksi) 38.05 38.241 38.05 38.05 38.098 0.096 Rupture Strength (ksi) 38 33.668 36.5 38 36.542 2.042 %Reduction of Area 50.50% 49.25% 40% 44% 45.94% 0.049 %Elongation 17.6% 16.65% 16.9% 15.30% 16.61% 0.010 Table 3.Steel A36 Property Group #1 Group #2 Group #3 Group #4 Average Standard Deviation Yield Strength (ksi) 50.6 49.1 52.4 49.3 50.35 1.223 Ultimate Strength (ksi) 55.45 56.74 56.5 55.6 56.0725 0.427 Rupture Strength (ksi) 57.5 58.2 58.9 58.2 58.2 1.602 %Reduction of Area 52.4 51.2 50.4 51.3 51.325 0.017 %Elongation 18.1 17.6 16.5 17.35 17.3875 0.034 Table 4. Aluminum 2024-T4 Property Group #1 Group #2 Group #3 Group #4 Average Standard Deviation Yield Strength (ksi) 46.5 45.4 44.1 45.55 45.3875 1.116 Ultimate Strength (ksi) 38.1 37.15 38.07 38.2 37.88 0.086 Rupture Strength (ksi) 37 35.5 35.8 36.5 36.2 2.031 %Reduction of Area 50.2 49.15 39 41 44.8375 0.041 %Elongation 15.6 16.7 16.45 17.5 16.5625 0.0085 Table 5 and Table 6, the comparison of reference values came from good data source and the values taken from the experiment were presented. Table 5 is for Steel 1018 while Table 6 is for Aluminum 6061-T6. Also, the Percent Error is presented. Table 5. Steel 1018 Property Reference Values Experiment Values Percent Error Modulus of Elasticity 29,000 ksi 29,402 ksi 1.39% Ultimate Strength 55.1 ksi 59.303 ksi 7.63% Rupture Strength 45 ksi 59.204 ksi 31.56% Percent Reduction in Area 35% 57.21% 63.46% Percent Elongation 15% 18.4% 22.67% Table 6. Aluminum 6061-T6 Property Reference Values Experiment Values Percent Error Modulus of Elasticity 10,000 ksi 10,349 ksi 3.49% Ultimate Strength 42.1 ksi 38.05 ksi 9.62% Rupture Strength 40 ksi 38 ksi 4.88% Percent Reduction in Area 48% 50.50% 5.21% Percent Elongation 17% 17.6% 3.53% SUMMARY AND CONCLUSION The main aim of this experiment was to test for tensile strength of the four specimens therein at hand. The four were Steel 1018, Steel A36, Aluminum 2024-T4 and Aluminum 6061-T6. The experiment was carried out in groups (4 groups) and data obtained by each group was then compared to allow for accuracy and proper discussions. Among properties tested for were the likes of elongation tendencies of the specimens, modulus elasticity, rupture strength and yield strength, engineering stress and strain which all allowed for measurement of ultimate strength of the specimens. From the tensile tests, it is clear that there is a distinct difference between the Steel 1018, Aluminum 6061-T6, Aluminum 2024-T4 and Steel A36. It is also clear that Steel 1018 is the strongest material of the other three specimens i.e. Aluminum 6061-T6, Aluminum 2024-T4 and Steel A36.It also proves that in tensile testing, you will know the tensile properties of a certain specimen which helps you to choose what must be the right material for a certain engineering application. REFERENCES http://www.ndted.org/EducationResources/CommunityCollege/Materials/Introduction/metals.htm http://eng.sut.ac.th/metal/images/stories/pdf/Lab_3Tensile_Eng.pdf http://www.virginia.edu/bohr/mse209/chapter6.htm http://www.iaa.ncku.edu.tw/~young/chp6%20solu.pdf http://courses.washington.edu/me354a/chap5.pdf http://www.matweb.com Davis, Troxell, and Hauck, The Testing of Engineering Materials, 4th Edition, McGraw-Hill, 1982, Chapters 2, 8, and 13. ASTM E8-04 Standard Test Method for Tension Testing of Metallic Materials APPENDIX A. Calculating the Modulus of Elasticity For Steel: Load (lbf) Strain (in./in.) Point A 5750 0.001001 Point B 9680 0.001666 Difference (Δ) 3930 0.665x10⁻³ σ = = = 19.552 ksi E = = = 29,402 ksi For Aluminum: Load (lbf) Strain (in./in.) Point A 1865 0.000895 Point B 5870 0.00283 Difference (Δ) 4005 1.935x10⁻³ σ = = = 20.025ksi E = = = 10,349ksi APPENDIX B. Calculating the Yield Strength at 0.2% Offset For Steel: P0.2% = 17.650 kips σ0.2% = = = 87.811 ksi For Aluminum: P0.2% = 9420 lbf σ0.2% = = = 47.1ksi APPENDIX C. Calculating the Ultimate Strength For Steel: Pmax = 11.92 kips σTS = = = 59.303ksi For Aluminum: Pmax = 7.61 kips σTS = = = 38.05 ksi APPENDIX D. Calculating the Rupture Strength For Steel: Pfracture = 11.9 kips σfracture = = = 59.204ksi For Aluminum: Pfracture = 7.6 kips σfracture = = = 38ksi APPENDIX E. Calculating the True Rupture Strength For Steel: Pfracture = 11.9 kips σfracture = = = 138.372ksi For Aluminum: Pfracture = 7.6 kips σfracture = = = 76.768ksi APPENDIX F. Calculating the Percent Reduction in Area For Steel: %RA = x 100 = x 100= 57.21% For Aluminum: %RA = x 100 = x 100= 50.50% APPENDIX G. Calculating the Percent Elongation For Steel: %Elongation = x 100 = x 100= 18.4% For Aluminum: %Elongation = x 100 = x 100= 17 Read More
Cite this document
  • APA
  • MLA
  • CHICAGO
(Measuring Tensile Properties of Metal Specimens Essay Example | Topics and Well Written Essays - 2750 words, n.d.)
Measuring Tensile Properties of Metal Specimens Essay Example | Topics and Well Written Essays - 2750 words. https://studentshare.org/engineering-and-construction/1811037-lab-report-tensile-test
(Measuring Tensile Properties of Metal Specimens Essay Example | Topics and Well Written Essays - 2750 Words)
Measuring Tensile Properties of Metal Specimens Essay Example | Topics and Well Written Essays - 2750 Words. https://studentshare.org/engineering-and-construction/1811037-lab-report-tensile-test.
“Measuring Tensile Properties of Metal Specimens Essay Example | Topics and Well Written Essays - 2750 Words”. https://studentshare.org/engineering-and-construction/1811037-lab-report-tensile-test.
  • Cited: 0 times

CHECK THESE SAMPLES OF Measuring Tensile Properties of Metal Specimens

Mechanical Properties of a Cartilage

Several alterations and disturbances were executed through the alteration of the osmotic potential in which the… The nature of the articular cartilage in which has superior characteristics in health scenarios such, as the painful arthritis which is degenerative and costly has created a lot of interest in the mechanical Numerous researches have been conducted with no resolution to some of these fundamental issues, in an effort to characterize the synovial body joints, it has led to the development of an experimental approach to in the investigation of the dynamic and constitutive properties of the cartilage....
16 Pages (4000 words) Literature review

Precipitation Hardening of Metallic Materials

This paper critically describes how precipitation hardening is normally carried out based on the use of aluminum copper based alloy systems with particular focus to the effects of aging time on the various mechanical properties of the alloy, theories explaining such effects as well as the estimation of the residual fatigue resistance through application of the traditional fracture mechanics approach.... Generally, it is widely believed that the hardness and strength associated with certain metal alloys could be enhanced by forming an additional phase of adversely small… Attaining this requires correct heat treatment....
5 Pages (1250 words) Essay

Properties of an element

The conductivity properties of silver are very high.... The properties of elements and compounds.... Silver is a transitional metal that is well known for its high electrical conductivity, reflectivity and thermal conductivity(Hill, 2009).... The metal can occur naturally in its pure form or as an… Silver has been used for thousands of years.... The metal was used to make ornaments and utensils.... The value of the metal enabled its use as a legal tender for the exchange of goods and services....
2 Pages (500 words) Essay

Stress and Strain of Aluminum

The report "Stress and Strain of Aluminum" focuses on the laboratory analysis of the stress and strain of the structure of aluminum molecules.... nbsp;From the graph, the stress of a material decreases gradually with an increase in strain, this means the material becomes nonlinear as stress is increased....
5 Pages (1250 words) Lab Report

The Physical Properties of Metals and Their Corrosion

Further, this experiment also looks forward to determining the differences in physical properties of the metals and the resulting alloy.... This experiment involves comparing the properties of copper and iron, and copper and its The paper "The Physical properties of Metals and Their Corrosion" is a brilliant example of a lab report on chemistry.... This experiment involved testing the physical properties of metals including brittleness and their hardness....
2 Pages (500 words) Lab Report

Laser Welding of Dissimilar Metals

The mounted specimens were etched in a solution comprised of 50% Hydraulic acid + 25% Nitric acid + 25% water and ethyl alcohol for 20–60 s until the microstructure was revealed.... he process was taken place of all samples after welding by using the x-ray machine, the radiographic equivalent factors were selected according to metal and the thickness of the samples.... Complete penetration for the 3 mm base metal was obtained at laser power equal to or greater than 2kw....
7 Pages (1750 words) Lab Report

The Behaviour of Metals

These curves reveal many properties of materials like elastic modulus, tensile strength yield strength, and elongation percentage.... tensile properties such as Young's modulus (E), Yield strength, Percentage elongation, Ultimate tensile strength and fracture strength in each test specimen were obtained as an average depending on the date generated using Microsoft-Excel.... In contrast to the average range of values for four test specimens and standard data, the variance in two sets of data might be because of the number of tensile test trials, as a good estimate of data is obtained from averaging multiple experimental trials....
6 Pages (1500 words) Assignment

Properties of Brick and Block Materials

The author of the "properties of Brick and Block Materials" paper seeks to measure the capillary action/ suction of the dry masonry material.... nbsp;Select three specimens for analysis, we suggest a thermalite block, and engineering brick and facing brick.... Weighing the mass of water absorbed by the sample when one surface of the sample is immersed in water does this....
4 Pages (1000 words) Lab Report
sponsored ads
We use cookies to create the best experience for you. Keep on browsing if you are OK with that, or find out how to manage cookies.
Contact Us