StudentShare
Contact Us
Sign In / Sign Up for FREE
Search
Go to advanced search...
Free

The Use of Pipettes - Lab Report Example

Cite this document
Summary
This lab report "The Use of Pipettes" focuses on the experiment on Pipette volumes from 50 µl to 1ml with precision and accuracy to know the difference between precision and accuracy and be able to quantify each and choose the appropriate pipette to use for delivery of a given volume. …
Download full paper File format: .doc, available for editing
GRAB THE BEST PAPER91.5% of users find it useful
The Use of Pipettes
Read Text Preview

Extract of sample "The Use of Pipettes"

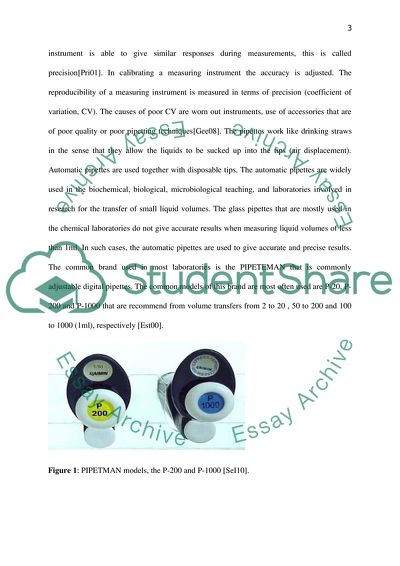
The use of Pipettes; Precision and Accuracy The use of Pipettes; Precision and Accuracy Experiment The use of Pipettes; Precision and Accuracy Objectives: Pipette volumes from 50 µl to 1ml with precision and accuracy. Know the difference between precision and accuracy and be able to quantify each. Choose the appropriate pipette to use for delivery of a given volume. Abstract Automatic pipettes were used for the (P-200 and P-1000). These were used together with their appropriate tips. A micro titre plate with wells was used to hold the volumes measured and read at 450nm. The results obtained were used to determine the accuracy and precision of the two pipettes in measuring different volumes. It was found that measuring a volume once is more precise rather than dividing the volumes into smaller portions. It was concluded that the P-200 should be recommended for volumes of 20-200 µl while the P-1000 should be recommended for volumes within the range of 100-1000 µl. The precision of the results was, however, found to be affected by care taken during the experiment, as well as, the skills of the experimenter (United States: Office of the Federal Register, 2004). The precision is also observed to increase as the volume measured by the same pipette is increased (Mueller-Harvey & Baker, 2002). Introduction Pipettes are involved in many scientific studies to make dilutions and in addition of small volumes of solutions or liquids in an experiment. Any undesired variation that arises when measuring these quantities may lead to jeopardised results. It is, therefore, very important to take all the necessary steps that will enhance maximum accuracy and precision in pipetting. Accurate and precise results reduces the level of uncertainty. Accurate results are possible if the measuring instrument is able to give the true value of the measurement (Jones, et al., 2012). If an instrument is able to give similar responses during measurements, this is called precision (Prichard, et al., 2001). In calibrating a measuring instrument the accuracy is adjusted. The reproducibility of a measuring instrument is measured in terms of precision (coefficient of variation, CV). The causes of poor CV are worn out instruments, use of accessories that are of poor quality or poor pipetting techniques (Gee, et al., 2008). The pipettes work like drinking straws in the sense that they allow the liquids to be sucked up into the tips (air displacement). Automatic pipettes are used together with disposable tips. The automatic pipettes are widely used in the biochemical, biological, microbiological teaching, and laboratories involved in research for the transfer of small liquid volumes. The glass pipettes that are mostly used in the chemical laboratories do not give accurate results when measuring liquid volumes of less than 1ml. In such cases, the automatic pipettes are used to give accurate and precise results. The common brand used in most laboratories is the PIPETEMAN that is commonly adjustable digital pipettes. The common models of this brand are most often used are P-20, P-200 and P-1000 that are recommend from volume transfers from 2 to 20 , 50 to 200 and 100 to 1000 (1ml), respectively (Estridge, et al., 2000). Figure 1: PIPETMAN models, the P-200 and P-1000 (Se, 2010). The parts of an automatic Pipette are as shown in the figure 2 below. Figure 2: Parts of a pipette (Gilson, n.d.). Materials and methods An automatic pipette that operates within the appropriate range was selected. The volume to be delivered was set. A new disposable tip was fitted at the tip of the barrel. The appropriate volumes of the compound X (red) was drawn by holding the pipette vertically, then pressing down on the plunger until the first stop. The tip was immersed into the liquid to a depth of 2-4 mm keeping the thumb on the plunger, the pressure was released slowly and evenly. After 1 to 2 seconds the tip was withdrawn from the liquid. The tip was placed in the appropriate well of the microtitre plate which had 12 ‘columns’ and eight (8) ‘rows’. The plunger was depressed slowly to the first stop. After 3 seconds the plunger was then depressed to the second stop to achieve the final blow. The pipette was withdrawn from the plate and the plunger allowed to return to the up position. The same tip was used to displace same sample. The compound X was pipetted into the wells of the micropipette plate as follows, where each measurement was repeated 8 times. Column 1: 100 µl to each well using the 20 – 200 µl pipette. Column 2: same as column 1. Column 3: 200 µl to each well using the 20 – 200 µl pipette. Column 4: 250 µl to each well using the 20 – 200 µl pipette; set to 150 µl and put 2 X 100 µl into each well. Column 5: Set the 20 - 200 µl pipette to 50 µl. Deliver 2 X 50 µl (to give 100 µl) to each well. Column 6: 250 µl to each well using the 100 – 1000 µl pipette (set to 250 µl). Column 7: 100 µl to each well using the 100 – 1000 µl pipette (set to 100 µl). The plate was read at 450 nm and the printout collected. Results The columns of the printout were labelled the section of the results was adhered. The highest and the lowest value of each set was circled. The range was calculated by subtracting written in at the bottom of the column. The mean was calculated, as well as, the standard deviation and the coefficient of variation (% CV) for each column. The standard deviation was calculated using the stat function of the calculator. The mean was calculated by adding up all the values in the column and dividing the number by 8. The coefficient of variation was calculated by dividing the standard deviation by the mean then multiplying by 100 {(standard deviation/mean) ×100}. It was used to calculate the level of the precision. The results recorded as shown in the table below. C1 100 µl C2 100 µl C3 200 µl C4 250 µl C5 100 µl C6 250 µl C7 100 µl (p200) (p200) (p200) (p200×2) (p200×2) (p1000) (p1000) 2.816 2.809 2.798 2.802 2.790 2.800 2.796 2.803 2.800 2.794 2.803 2.794 2.796 2.789 2.811 2.711 2.802 2.810 2.793 2.809 2.796 2.797 2.815 2.809 2.810 2.794 2.805 2.799 2.788 2.812 2.802 2.814 2.796 2.800 2.647 2.809 2.814 2.805 2.810 2.805 2.802 2.805 2.807 2.805 2.815 2.815 2.819 2.810 2.800 2.807 2.804 2.796 2.803 2.807 2.805 2.809 mean 2.805 2.796 2.803 2.808 2.800 2.803 2.780 SD 0.009 0.035 0.007 0.005 0.010 0.005 0.054 % CV 0.312754 1.244542 0.245467 0.177104 0.355646 0.164236 1.948065 Table 1: Precision level calculation results. Discussion The table below shows the possible range measured using the P-200 and P-1000. Pipette Range Possible (µl) Recommended Smallest µl increment P-200 0-200 20-200 0.2 P-1000 0-1000 100-1000 2.0 Table 2: Possible range measured by the P-200 and P-1000 pipettes. C1 vs. C2 Both the coefficient of variation and the standard of deviation are higher in C2 as compared to C1. The % CV in C2 is 1.244542 while that of C1 is 0.312754. In C2 the standard deviation is 0.035 while the standard deviation of C1 is 0.009. Since the % CV in C1 is less, it indicates that the volumes drawn and put in the first column were precise. The volumes in the column 2 were not precise because the % CV is more than 1. The precision could be affected by a number of factors during the experiment. These include the tips used with the pipette, the variation of the room temperature in the working environment and caution while performing the experiment. The tip used in the first column could be more accurate than the one used in the second column. There could also be a fluctuation in the temperature values during measurements in the second column. C2 vs. C7 The accuracy in measuring 100 µl was higher when measured using the P-1000 than when using P-200. The mean difference between the true value and the recorded value was 2.796 µl when using the P-200 and 2.780 when using the P-1000. The results obtained by both methods were imprecise, the P-1000 was better in measuring 100 µl in C7 than the P-200 in C2. C4 vs. C6 In measuring 250 µl, using the P-1000 gave more accurate results as compared to the results obtained when using the P-200. The mean in C4 was 2.808, while that in C6 was 2.803. It is, therefore, better to use the P-1000 while measuring 250 µl although the results obtained in the two cases were precise. C5 vs. C2 When using the P-200 twice to give 100 (2×50µl) was less accurate (mean 2.800) than when pipetting once (1×100 µl). Pipetting once, gave a mean of 2.796. Thus, it is a better method of measuring 100 µl. The precision increased when the same pipette was used to measure the same greater volume. It was more in C3 as compared to C2 and again more precise results in C6 as compared to C7. The replicates were good in C3 and C6 where the % CV was less than 1 in both cases. However, the replicates were not precise in C2 and C7 giving % CV of more than 1 in each case. The pipetting was precise in C1, C3, C4, C5 and C6. It is because in all these columns the % CV was less than 1. In these columns the pipetting was, therefore, good. However, the pipetting in C2 and C7 was not precise and gave varying results along the columns. The % CV in both cases was more than 1, therefore, giving imprecise results. Factors that may have contributed to imprecise pipetting A number of factors could have contributed towards achieving imprecise results, which include: 1. Lack of care during the experiment and lack of enough experience. 2. The variation in the methods that were used during the experiment including the pressing of the plunger and fixing of the tip at the end of the pipette. 3. The other factor that could have caused imprecise results is the variation of the temperature during the experiment. The materials could have conducted heat during the experiment resulting to their expansion hence imprecise results (Haney, 2008). 1b Calibration of the balance of the pipette by weighing using the balance Every time the balance was used, it was ensured that it was at zero point in the reading. The balance was used in the weighing of the chemical used in the experiment. Materials and methods The P-100 pipette was used with an appropriate tip and the calibration done as follows: a. A square based plastic beaker was placed on a pan balance and the tare button pressed to give a zero display. b. 1 ml of distilled water was added the weights recorded in a table. It was done seven times. The mean, standard deviation and coefficient of variation were calculated and given in the table 3 below. Results W1 W2 W3 W4 W5 W6 W7 mean SD % CV 0.95 0.97 0.96 0.96 0.96 0.96 0.96 0.958 0.006 0.626305 Table 3: Results of the calculated mean, standard deviation, and coefficient of variation. The results were 95.8% accurate, that is, 4.2% inaccurate. The true value is supposed to be 1 and, therefore, the level of inaccuracy was small. The results were also precise because the % CV was less than 1. When using the pipette to dispense 100ml, the results obtained were less precise. It was due to the reduction of the volume measured. The results obtained in 1b were more accurate and precise than those obtained in 1a. It could have been as a result of more care been taken and also due to the measurement of higher volume and without measuring one volume twice (Lawn, 2003). Conclusion The P-200 pipette is most appropriate for measuring small volumes of between 20-200 µl. The pipette gives more accurate results when measuring volumes within this range. In order for accurate results for volumes within the range of 100-1000 µl, the P-1000 pipette is recommended. Measuring small volumes requires caution in order to provide precise results. Experiment 2: Dilutions and Standards Objective Make a stock solution from solid compound. Make a series of dilutions from a stock solution, with precision and accuracy. Construct a standard curve from these dilutions. Calculate the concentration of an unknown from your standard curve. Abstract An experiment was carried out to make stock solution and dilutions in order to achieve standard dilutions. Solutions are prepared with respect to their molar concentration and mass concentrations. Tartrazine with molecular weight of 534.4g was used in the experiment whereby 0.1 g was dissolved in 100ml of distilled water and the solution used to make standard solutions. 1.5 ml Eppendorf tubes were used to hold the different dilutions. The initial concentrations were diluted to achieve the required concentrations. As the dilution increased the concentration decreased. A graph of concentration against absorbance was plotted, which gave a straight line from the origin. The graph is important and shows the level of accuracy and the precision of the experiment. It is also used to determine unknown concentrations. Introduction A standard solution is a solution containing precisely known concentration of an element where the weight of the solute is known and dissolved in a solution to make a specific volume (Kenkel, 2013). The use of dilutions is undertaken in many laboratory procedures. It is of importance, considering the dilutions, because they make a quantitative difference. Solutions are prepared with respect to their molar concentration (e.g., mmol/l) or mass concentrations, for example, (g/l). However, the quality of a reference standard is vital to the integrity of a quantitative assay (Wild, 2005). The relative molecular mass is needed to get the molar concentrations. Stock solutions are used in the making of solutions with different concentrations that are made in volumetric flasks (Kenkel, 2010). The use of the volumetric flask is the most accurate method of preparing solutions. Other methods, though not accurate, involve the use of Eppendorf tubes or even test tubes. Nevertheless, they do not give accurate results. Knowing the range of concentrations is important and helpful when preparing a standard curve. Prepared standard solutions can then be used in determining concentrations of other substances (Kelter, et al., 2008). Method 2a Making a 0.1% stock solution of Tartrazine Calculating of the percentage of a solution is a method that doesn’t require the knowledge of the molecular weight. A clean magnetic flea was placed in a 150-200 ml container. 80ml of distilled water was added. 1.1 g tartrazine was weighed. Sufficient mixing was ensured The contents were transferred into a volumetric flask after they dissolved completely and water added to the mark. The lid was placed and the contents thoroughly mixed. Pre-Lab questions 0.1%=100mg/100ml? 0.1% =0.001g/ml? What is the concentration of your stock in µg/ml? 1.1 g is in 100 ml. Therefore, in 1 ml there is 0.001g. It is equivalent to 100 µg/ml. What dilution of your stock do you need to get the first standard (100 µg/ml)? By adding 0.1 g of tartrazine to 100 ml of water makes the first standard (100 µg/ml). 2B. Making working dilutions (standards) from a stock solution Working in the laboratories at times requires one to start off with a concentrated stock solution and prepare solutions of varying concentrations. A dilution is expressed in the ratio of the solute contained in a solvent (Buckingham, 2014). It is useful in making assays for drugs and biochemical analysis. Though they do not give an absolute value, standard solutions are used. The standards obtained are used in the construction of a standard curve. Method 1000 µl of each standard solution was prepared in 1.5 ml Eppendorf tubes. Tartrazine of unknown concentration was also provided. 100 µl of each standard was pipetted in quadruplicate into 96 well plates. 100 µl of tartrazine solution was pipetted in quadruplicate into separate wells of the same plate. The absorbance was read at 450 nm on the plate reader. A standard curve was constructed by plotting concentration (µg/ml) on the x-axis vs. the absorbance on the y-axis. The mean was calculated, as well as, the standard deviation and the CV for the absorbance of both the standards and the sample. The concentration of the unknown was then determined. Tabular and Graph (Results) Conc (µg/ml) required Dilution µl stock soln (A) µl dist H2O (B) Total volume (A+B) 100 1/10 100 900 1000 80 2/25 80 920 1000 60 3/50 60 940 1000 40 1/25 40 960 1000 20 1/50 20 980 1000 0 0 0 1000 1000 Table 4: Dilution amounts. A graph of concentration against absorbance was plotted and obtained as shown below. Graph 1: Concentration against absorbance. The graph was a straight line from the origin indicating that there was a linear relationship between the concentration and the absorbance of the solutions obtained. The higher the dilution, the more the reduction in concentration and, consequently, low absorbance. Discussion A linear standard curve was obtained where there were no points left outside the line. There was, therefore, no dilution that was not considered. The pipetting was precise because the CV obtained was less than one (Nielsen, 2010). The pipetting was also accurate because the curve obtained was linear. The standard curve worked out well, hence, it could be deduced that there were no errors. Questions Molarity means molar concentration, expressed as moles of solute per litre volume of solution (mol l-1). One molar (M; mol l-1) = the molecular weight in grams per litre. 1. The molecular weight of tartrazine is 534.4. What is the molarity of your stock solution? Molecular mass = 534.4g Mass = 0.1g Moles =0.1* (1mol /534.4g) = 0.00018713moles Molarity = 0.0018713M M tartrazine = 534.4 g/L) What is the molarity of each of your standards? First standard= 53.44g/l Second standard=42.752g/l Third standard= 32.064g/l Fourth standard=21.376g/l Fifth standard =10.688g/l What is the concentration of your unknown in moles l-1? (0.9-0.5)/ (80-40) = 0.01 2. You are asked to make up 100 mL of a 2.5 mM solution of tartrazine. How much tartrazine would you need? V1=100ml M1=2.5 100ml/1000=0.1liters (0.1*2.5) = 0.25g References Buckingham, L., 2014. Fundamental Laboratory Mathematics: Required Calculations for the Medical Laboratory Professional. Philadelphia: F. A. Davis. Estridge, B. H., Reynolds, A. P. & Walters, N. J., 2000. Basic Medical Laboratory Techniques. 4 ed. London: Cengage Learning. Gee, S. J., Van Emon, J. M. & Hammock, B. D., 2008. Environmental Immunochemical Analysis Detection of Pesticides and Other Chemicals: A Users Guide. Cambridge: Cambridge University Press. Gilson, n.d.. Pipetman. [Online] Available at: http://www.gilson.com/Resources/LT801120_a_eng_030209%20BD.pdf [Accessed 24 January 2015]. Haney, S. A., 2008. High Content Screening: Science, Techniques and Applications. Hoboken: John Wiley & Sons. Jones, M., Fosbery, R., Gregory, J. & Taylor, D., 2012. Cambridge International AS and A Level Biology Coursebook with CD-ROM. Cambridge: Cambridge University Press. Kelter, P. B., Mosher, M. D. & Scott, A., 2008. Chemistry: The Practical Science. Boston: Cengage Learning. Kenkel, J., 2010. Analytical Chemistry for Technicians. 3 ed. Boca Raton: CRC Press. Kenkel, J., 2013. Analytical Chemistry for Technicians. 4 ed. Boca Raton: CRC Press. Lawn, R. E., 2003. Measurement of Volume. Cambridge: Royal Society of Chemistry. Mueller-Harvey, I. & Baker, R. M., 2002. Chemical Analysis in the Laboratory: A Basic Guide. Cambridge: Royal Society of Chemistry. Nielsen, S., 2010. Food Analysis Laboratory Manual. 2 ed. London: Springer Science & Business Media. Prichard, F. E., Prichard, E. & Green, J., 2001. Analytical Measurement Terminology: Handbook of Terms Used in Quality Assurance of Analytical Measurement. Cambridge: Roya Society of Chemistry. Se, I., 2010. Blood Thinners. [Online] Available at: http://dunia-accounting.blogspot.com/2010/11/pengencer-darah.html [Accessed 24 January 2015]. United States: Office of the Federal Register, 2004. L.S.A., List of C.F.R. Sections Affected. Washington: National Archives of the United States. Wild, D., 2005. The Immunoassay Handbook. Oxford: Gulf Professional Publishing. Read More
Cite this document
  • APA
  • MLA
  • CHICAGO
(The Use of Pipettes Lab Report Example | Topics and Well Written Essays - 3000 words, n.d.)
The Use of Pipettes Lab Report Example | Topics and Well Written Essays - 3000 words. https://studentshare.org/chemistry/1857192-the-use-of-pipettesprecision-and-accuracy
(The Use of Pipettes Lab Report Example | Topics and Well Written Essays - 3000 Words)
The Use of Pipettes Lab Report Example | Topics and Well Written Essays - 3000 Words. https://studentshare.org/chemistry/1857192-the-use-of-pipettesprecision-and-accuracy.
“The Use of Pipettes Lab Report Example | Topics and Well Written Essays - 3000 Words”. https://studentshare.org/chemistry/1857192-the-use-of-pipettesprecision-and-accuracy.
  • Cited: 1 times

CHECK THESE SAMPLES OF The Use of Pipettes

Rate of Glucose Uptake by Yeast Cells

use a cloth (this would avoid fingerprints on the surface) to remove the crucible containing the precipitate from the filtration apparatus.... When yeast cells are added to a glucose solution, the glucose molecules are absorbed across the cell membranes.... As time progresses, the concentration of glucose falls....
4 Pages (1000 words) Lab Report

Calculation for RBC

The low value can be due to dilution of contents in pipette by saliva and use of non standard counting chamber and improper cover slip adjustment.... This report shows that the red blood cell count according to the improved hemocytometer is 2.... 7 x 106 mm3.... According to this reading, the person seems to be anemic which may be due to iron deficiency, folate deficiency, genetic disorders or immune dysfunction....
1 Pages (250 words) Lab Report

Determination Of Nitrate Ion In Treated Wastewater Effluent

Errors result from measurements done by using flasks and pipettes.... The spectrophotometer is in use to measure the intensity of red color produced when nitrite reacts with the acid, sulfanilic and N- naphthylethylenediamine.... Some of the errors in experiments are difficult to avoid thus experimenters consider them as uncertainties....
1 Pages (250 words) Lab Report

Calibration of Glassware

For that mark, one should use the balances that read to ±0.... These tools are extensively used in analysis in the laboratory.... Calibration was carried out by getting the mass of required apparatus and liquid.... hellip; Then fill the pipette/burette with water till the water reaches the mark on the burette/pipette....
2 Pages (500 words) Lab Report

Synthesis of Gold Particles and Their Use for Chemical Sensing

Notably, the used citrate in this experiment has been used to know the… the use of nitrates prevents the growth grow because of the negative charges of the gold that covered the upper part.... the use of nitrates prevents the growth grow because of the negative charges of the gold that covered the upper part.... the use of citrate ions prevents the accumulation of layers of gold thereby hindering the formation of melamine that prevent the formation of nanoparticles on the surface of gold....
1 Pages (250 words) Assignment

Floating egg

he advantages of volumetric flask, pipettes and burette are that it's more accurate, convenient for use while dealing with moderate amounts of liquids and efficient in readings respectively.... As long as there is no reaction between the egg and either of the two solutions, it is assumed that the egg will display similar observation in both solutions at the same density....
1 Pages (250 words) Admission/Application Essay

Reduction of Benzophenone and Collection of the Diphenylmethanol

use a Pasteur pipette, swirlingthe flask between each addition to disperse any cloudiness before adding the next drop.... use GLOVES FOR THIS PART1.... Recrystallise the crude product from hexane, being careful not use too much solvent.... use vials instead of test tubes, if possible.... Care was taken not to use too much solvent, and because hexane is flammable and has a low boiling point, the hot plate settings were kept below maximum in order to minimise the risk of fire....
2 Pages (500 words) Essay
sponsored ads
We use cookies to create the best experience for you. Keep on browsing if you are OK with that, or find out how to manage cookies.
Contact Us