StudentShare
Contact Us
Sign In / Sign Up for FREE
Search
Go to advanced search...
Free

Size Exclusion Chromatography- Protein Separation Polyacrylamide Gel Electrophoresis - Lab Report Example

Cite this document
Summary
The absorbance of each fraction at 200nm was determined and plotted as shown in figure 1 below. Even though the resolution between the…
Download full paper File format: .doc, available for editing
GRAB THE BEST PAPER91.2% of users find it useful
Size Exclusion Chromatography- Protein Separation Polyacrylamide Gel Electrophoresis
Read Text Preview

Extract of sample "Size Exclusion Chromatography- Protein Separation Polyacrylamide Gel Electrophoresis"

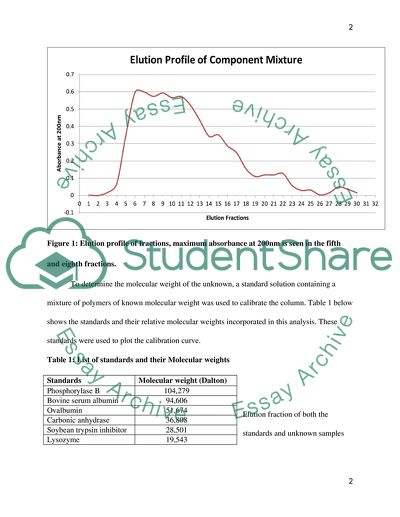
Size Exclusion Chromatography Results To identify protein profiles in the sample mixture, the elutionwas monitored continuously using a UV light detector at a flow rate of 7mL/min. The absorbance of each fraction at 200nm was determined and plotted as shown in figure 1 below. Even though the resolution between the different components is poor, the less distinct peaks suggest an acceptable degree of separation.Figure 1: Elution profile of fractions, maximum absorbance at 200nm is seen in the fifth and eighth fractions.

To determine the molecular weight of the unknown, a standard solution containing a mixture of polymers of known molecular weight was used to calibrate the column. Table 1 below shows the standards and their relative molecular weights incorporated in this analysis. These standards were used to plot the calibration curve.Table 1: List of standards and their Molecular weightsElution fraction of both the standards and unknown samples were run through SDS-PAGE gel electrophoresis and their retention times calculated as shown in the table below.

Table 2: Retention of known standards and unknown.Retention time of standardsRetention Time of unknownsBand no.Retention timeunknown no.Retention time10.19047620.24761920.20952430.59047630.26666740.60761940.36190550.5250.41904860.49523860.53333370.209524The retention times, which is equivalent to elution volume (Ve) of each protein was plotted as a function of the log 10 of the molecular weight of the standards as shown in figure two. This calibration curve was used to estimate the relative molecular weights of the unknown samples.

Figure 2: Calibration curve of the standards plotted using retention time and log10 of the molecular weights of the standardsIn determining the molecular weights, the function in equation one was employed. Log M = b - c Ve (where b and c are constants) (Bernd, 10)Equation 1: Log of molecular weight as a function of elution volume (Ve), the constants b and C were determined from the calibration curve.Using the calibration curve of the standards, constants b and c were substituted to give equation two below. Y= -2.1263x +5.

3719 (where Y =Log M and X=Ve)Equation 2: A substituted function of equation one The Value for X and Y in this function is equivalent to elution volume (Ve) and Log10 of the molecular weight. Substituting Ve with the retention time value, the Log M and molecular weights of the unknown samples were determined as shown on table three below. Table 3: Estimated Log10 M and the Molecular weights of unknown samples.Molecular weight of unknownUnknownLog MMolecular weight24.8453876 70,047 34.1163705 13,073 44.

0799196 12,020 54.266224 18,460 64.3188752 20,839 74.9263895 84,4092. Conclusion Size exclusion chromatography is a HPLC technique that separates molecules based on their size or molecular weight (Bernd, 2). Using this technique the molecular weight of five unknown protein molecules was estimated as shown in table three. However, the validation assay of the technique did not give expected resolution, limits the validity of the results. Clear and distinct peaks on this graph depict a high resolution of the assay and thus credible results.

A number of factors; such as column length, flow rate and technical errors may have influenced the poor resolution of the peaks in the UV protein absorption profile (Hong and Fountain, 5-6). Further optimization experiments may be necessary to overcome these errors and achieve a good resolution. ReferencesHong, Paula and Fountain, Kenneth. Method Development for Size-Exclusion Chromatography of Monoclonal Antibodies and Higher Order Aggregates. Milford: Waters Corporation, 2011. Print.Bernd Trathnigg “Size-exclusion Chromatography of Polymers” Encyclopedia of Analytical Chemistry Ed.

Meyers Chichester: John Wiley & Sons Ltd, 2000. 8008–8034. Print.

Read More
Cite this document
  • APA
  • MLA
  • CHICAGO
(“Size Exclusion Chromatography- Protein Separation Polyacrylamide Gel Lab Report”, n.d.)
Retrieved from https://studentshare.org/chemistry/1640313-size-exclusion-chromatography-protein-separation-polyacrylamide-gel-electrophoresis
(Size Exclusion Chromatography- Protein Separation Polyacrylamide Gel Lab Report)
https://studentshare.org/chemistry/1640313-size-exclusion-chromatography-protein-separation-polyacrylamide-gel-electrophoresis.
“Size Exclusion Chromatography- Protein Separation Polyacrylamide Gel Lab Report”, n.d. https://studentshare.org/chemistry/1640313-size-exclusion-chromatography-protein-separation-polyacrylamide-gel-electrophoresis.
  • Cited: 1 times

CHECK THESE SAMPLES OF Size Exclusion Chromatography- Protein Separation Polyacrylamide Gel Electrophoresis

SDS PAGE

Sodium dodecyl sulfate polyacrylamide gel electrophoresis (SDS PAGE) is a method of separating protein molecules based on their ability to move through an electric field depending on size of their polypeptide chains and molecular weight.... First-name Last Number 9 April 2013 SDS PAGE Background The method of separation of macromolecules in an electric field is called electrophoresis.... -mecaptoethamol prevents oxidation of cysteines and break up disulphide bonds, Bromophenyl dye is used to help in visualizing the sample as it travels across the gel and glycerol is added to make the sample fall to the bottom....
3 Pages (750 words) Term Paper

Western Blot and its Applications

Then proteins are separated by gel electrophoresis from sample.... By far the most common type of gel electrophoresis employs polyacrylamide gels and buffers loaded with Sodium Dodecyl Sulphate (SDS).... In western blotting, proteins are electrophoresed in polyacrylamide gel, transferred onto a nitrocellulose or nylon membrane, and the protein bands are detected by their specific interaction with antibodies, lectins or some other compounds.... he protein bands are transferred onto a nitrocellulose or nylon membrane; initially this was achieved by a capillary movement of buffer but now a days it is usually done by electrophoresis (electrophoretic blotting)....
4 Pages (1000 words) Essay

Conventional PCR using agarose gel electrophoresis detection

This binds strongly to DNA by intercalating between the bases and is fluorescent meaning that it Conventional PCR using agarose gel electrophoresis detection According to Lewis “Agarose gel electrophoresis is the easiest and commonest way of separating and analyzing DNA”.... “Agarose gel electrophoresis (Basic Method)”.... ith intention to separate very tiny fragments, addition of high percentage ( up to 3%), is not useful as a vertical polyacrylamide gel is more appropriate in this case....
2 Pages (500 words) Essay

The Molecular Marker and the Unknown Fragments of DNA

This paper focuses on electrophoresis that describes the separation of a charged particle such as DNA or protein under the influence of an electric field.... An appropriate buffer such as TBE is important while carrying out electrophoresis so as to maintain a constant ionization of the DNA molecules.... hellip; Digestion of the target plasmid DNA helps in facilitating the resolution of the fragments of interest in the gel.... High molecular DNA such as the undigested plasmid may pose difficulties because of its size and may migrate poorly due to its large size which may not be accommodated by the pores in the gel matrix....
11 Pages (2750 words) Research Paper

Separation of Colored Molecules Based on their Molecular

From this observation, the external volume of the gel filtration column was determined Chromatography is the method used in separating and analyzing complex mixtures.... gel filtration is a procedure by which molecules are removed from a mixture based on their molecular shape and size.... In gel filtration chromatography, the stationary phase consists of beads that have pores which span a narrow range that determines the size of the macromolecules to be fractioned....
4 Pages (1000 words) Lab Report

Agarose Gel Electrophoresis of DNA

gel electrophoresis refers to the method… gel electrophoresis is applied in clinical chemistry to separate proteins by size and/or charge and in molecular biology and biochemistry to The paper "Agarose gel electrophoresis of DNA" is an outstanding example of an essay on biology.... gel electrophoresis refers to the method of analysis and separation of macromolecules (proteins, RNA, and DNA) and their respective fragments, depending on their charge and size....
3 Pages (750 words) Term Paper

Electrophoresis: The Main Technique for Molecular Separation

When separated on a polyacrylamide gel, the procedure is abbreviated as SDS--PAGE (for Sodium Dodecyl Sulfate polyacrylamide gel electrophoresis).... 1 electrophoresis can be one dimensional (i.... One dimensional The paper "electrophoresis: The Main Technique for Molecular Separation" is an outstanding example of a lab report on formal science and physical science.... electrophoresis may be the main technique for molecular separation in today's cell biology laboratory....
2 Pages (500 words) Lab Report

2 D-Electrophoresis Separation of the Wheat Leaf Proteome

By definition, proteome is the entire protein complement that includes the modifications made to a give set of proteins by a cellular system or an The paper "2 D-electrophoresis Separation of the Wheat Leaf Proteome" is a perfect example of a lab report on biology.... In the experiment, the aim was to carry out a 2 D-electrophoresis separation of the wheat leaf proteome.... In this case, 2D electrophoresis was employed.... There are two gels produced in the experiment, in figure 1 the gel was ideal as it is evident by the spots that represents the proteins....
2 Pages (500 words) Lab Report
sponsored ads
We use cookies to create the best experience for you. Keep on browsing if you are OK with that, or find out how to manage cookies.
Contact Us