StudentShare
Contact Us
Sign In / Sign Up for FREE
Search
Go to advanced search...
Free

Statistics Exercises Analysis - Assignment Example

Cite this document
Summary
The assignment "Statistics Exercises Analysis" focuses on the critical analysis of the student's exercises in statistics as a part of his/her exam curriculum. Comparing the values of both the sample mean and the population mean, it is found out that they are equal…
Download full paper File format: .doc, available for editing
GRAB THE BEST PAPER95.7% of users find it useful
Statistics Exercises Analysis
Read Text Preview

Extract of sample "Statistics Exercises Analysis"

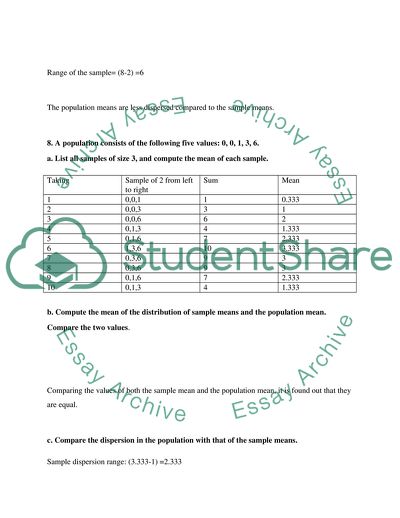
6. A population consists of the following five values: 2, 2, 4, 4, and 8. a. List all samples of size 2, and compute the mean of each sample. Taking Sample of 2 from left to right Sum Mean 1 2,2 4 2 2 2,4 6 3 3 2,4 6 3 4 2,8 10 5 5 2,2 4 2 6 2,4 6 3 7 2,4 6 3 8 2,8 10 5 9 4,2 6 3 10 4,2 6 3 11 4,4 8 4 12 4,8 12 6 13 4,2 6 3 14 4,2 6 3 15 4,4 8 4 16 4,8 12 6 17 8,2 10 5 18 8,2 10 5 19 8,4 12 6 20 8,4 12 6 b. Compute the mean of the distribution of sample means and the population mean. Compare the two values. Comparing the values of both the sample mean and the population mean, it is found out that they are equal. c. Compare the dispersion in the population with that of the sample means. Range of the sample= (8-2) =6 Range of the sample= (8-2) =6 The population means are less dispersed compared to the sample means. 8. A population consists of the following five values: 0, 0, 1, 3, 6. a. List all samples of size 3, and compute the mean of each sample. Taking Sample of 2 from left to right Sum Mean 1 0,0,1 1 0.333 2 0,0,3 3 1 3 0,0,6 6 2 4 0,1,3 4 1.333 5 0,1,6 7 2.333 6 1,3,6 10 3.333 7 0,3,6 9 3 8 0,3,6 9 3 9 0,1,6 7 2.333 10 0,1,3 4 1.333 b. Compute the mean of the distribution of sample means and the population mean. Compare the two values. Comparing the values of both the sample mean and the population mean, it is found out that they are equal. c. Compare the dispersion in the population with that of the sample means. Sample dispersion range: (3.333-1) =2.333 Population dispersion rage: (6-0) =6 The population means are less dispersed compared to the sample means. 15. A normal population has a mean of 60 and a standard deviation of 12. You select a random sample of 9. Compute the probability the sample mean is: a. Greater than 63. b. Less than 56. c. Between 56 and 63. If the probability is higher than 63 which is 0.2266 and 0.1587 it is lower than 56. Therefore any value that may be left can be calculated as: 16. A normal population has a mean of 75 and a standard deviation of 5. You select a sample of 40. Compute the probability the sample mean is: a. Less than 74. b. Between 74 and 76. c. Between 76 and 77. d. Greater than 77. 27. Suppose your statistics instructor gave six examinations during the semester. You received the following grades (percent correct): 79, 64, 84, 82, 92, and 77. Instead of averaging the six scores, the instructor indicated he would randomly select two grades and compute the final percent correct based on the two percents. a. How many different samples of two test grades are possible? b. List all possible samples of size 2 and compute the mean of each. Score 1 Score 2 average 79 64 71.5 79 84 81.5 79 82 80.5 79 92 85.5 79 77 78 64 84 74 64 82 73 64 92 78 64 77 70.5 84 82 83 84 92 88 84 77 80.5 82 92 87 82 77 79.5 92 77 84.5 c. Compute the mean of the sample means and compare it to the population mean. The mean of these sample means is 79.667, and the average of the 6 test scores is 79.667 d. If you were a student, would you like this arrangement? Would the result be different from dropping the lowest score? Write a brief report. Since the population score and the average score obtained using this “sample of 2” approach is the same, the student is faced with a lot of uncertainty. The population is a fixed quantity means that it is a parameter and it does not change. The student is assured of getting a 79.667. On the other hand, if the student decides to use the “sample of two” method, there is a likely probability that he will get a better value than 79.667 and also another probability that he will do worse than 79.667. In fact, since 79.667 is not a possible score in the “sample of two” method, the student will either do better or worse in this method. 2. A sample of 81 observations is taken from a normal population with a standard deviation of 5. The sample mean is 40. Determine the 95% confidence interval for the population mean. 3. A sample of 250 observations is selected from a normal population for which the population standard deviation is known to be 25. The sample mean is 20. a. Determine the standard error of the mean. b. Explain why we can use formula (91) to determine the 95% confidence interval. In order to determine the confidence interval, we need to have the sample mean standard deviation and the risk factor. Using formula (91), we can easily compute the confidence interval for 95% confidence interval c. Determine the 95% confidence interval for the population mean. = 13. Merrill Lynch Securities and Health Care Retirement Inc. are two large employers in downtown Toledo, Ohio. They are considering jointly offering child care for their employees. As a part of the feasibility study, they wish to estimate the mean weekly child-care cost of their employees. A sample of 10 employees who use child care reveals the following amounts spent last week. images 107$ 92$ 97$ 95$ 105$ 101$ 91$ 99$ 95$ 104$ Develop a 90% confidence interval for the population mean. Interpret the result. 15. The owner of the West End Kwick Fill Gas Station wishes to determine the proportion of customers who use a credit card or debit card to pay at the pump. He surveys 100 customers and finds that 80 paid at the pump. a. Estimate the value of the population proportion. b. Develop a 95% confidence interval for the population proportion. c. Interpret your findings. The confidence interval means that the population falls within the range of the interval] 16. Ms. Maria Wilson is considering running for mayor of the town of Bear Gulch, Montana. Before completing the petitions, she decides to conduct a survey of voters in Bear Gulch. A sample of 400 voters reveals that 300 would support her in the November election. a. Estimate the value of the population proportion. b. Develop a 99% confidence interval for the population proportion. c. Interpret your findings. We are 99% confident that the true value of the proportion of individuals likely to vote for her are in the interval Discussions Discussion Question 3.1 Describe the four different methods to sample a population. Please provide an example for each method from an empirical real life or business examples. 1. Simple random sampling In this method of sampling, individuals are usually selected randomly from a list of the population and every single individual has an equal chance of being selected during the analysis. Example Assuming that a company is carrying out a research in order to assess the views of their customers regarding the quality of the services they have been offering over the past one year. The initial thing that must be done is the organization of the frame size and to accomplish this task we must scrutinize the company records over the last 12 months. Next we shall draw the sample. Assuming 1000 customers and 100 customers to be the sample, the sampling fraction will be F=n/N=100/1000=0.10 2. stratified random sampling This is normally used when the population has a number of distinct subgroups where each one of them requires a unique representation. This technique comes in two unique types namely proportionate and disproportionate. Example A company has two strata population sizes of its target market of which 5% are made up of Hispanics, 15% are made up of Caucasians and the rest are made up of American Hispanics. If the town has a population size of 2000 people, each one of the unique groups size can be determined as Hispanics ( 5% of 2000=100), Caucasians(15% of 2000=300) and American Hispanics are (80% of 2000=1600) . 3. Systematic random sampling When we are conducting any form of systematic random sampling, we assess the nth element from the sample interval. Example The government wishes to assess the population distribution in an area. We have a population size of 6000 persons and a sample of 200 people is selected. We will have to select every 30th person (6000/200) from the list. 4. Cluster random sampling Cluster sampling is usually more practical as compared to the other sampling methods. It comes in handy in cases where the list of the elements in a population is not available. This form of sampling is carried out by first selecting the sub groups of the population at different stages. Example A multinational company with outlets all over the country is evaluating its sales in the country to assess the performance of a new brand over the last one year. In order to achieve this, the sales are assessed in each country, then the sampling is narrowed down to the number of counties in each country. The next level of evaluation is the districts and finally the smallest level being the households. Discussion Question 3.2 For discussion 3.2 there will be no discussion. You will get credit for this part by submitting a confirmation that you submitted the assignment for chapter 8. The credit will only be given if you submit your assignment for chapter 8. I confirm that I submitted the assignment for chapter 8 well done and properly articulated. Discussion Question 3.3 Explain what does the confidence interval mean? How is it calculated? Explain how the confidence can be useful in the business analysis through an example. Confidence interval refers to ranges that are used to estimate the true value of a population in statistical analysis. If we have a population size with a 1.0% risk that a certain individual may not be contained in the interval, then Confidence interval can be of great importance in business analysis as it can be used to predict the performance of a company, a product or the nature of the market in both short term periods and long term periods of time. Example A survey was conducted on some 300 emerging, domestic, small capital companies and found that 153 had an Emergency Action Plan that detailed reaction plans to maintain operations and customer service in the event of major illness or outbreak such as the swine flu. Calculate the 92% confidence interval to estimate the proportion of emerging domestic, small capital companies that have an adequate Emergency Action Plan. Solution The confidence interval computed above states that with a 92% confidence, the proportion of all similar companies with the plan will be between 46% and 56%. Discussion Question 3.4 For discussion 3.4 there will be no discussion. You will get credit for this part by submitting a confirmation that you submitted the assignment for chapter 9. The credit will only be given if you submit your assignment for chapter 9. I confirm that I submitted the assignment for chapter 9 well done, neat and well articulated. References Marty Sternstein,( 2013), Barrons AP Statistics, 7th Edition, Barrons Educational Series. Lind,Marchal,Wathen, Statistical Techniques in Business and Economics, 16th Edition Read More
Cite this document
  • APA
  • MLA
  • CHICAGO
(Statistics Exercises Analysis Assignment Example | Topics and Well Written Essays - 2000 words, n.d.)
Statistics Exercises Analysis Assignment Example | Topics and Well Written Essays - 2000 words. https://studentshare.org/statistics/1843054-week-3-statistics
(Statistics Exercises Analysis Assignment Example | Topics and Well Written Essays - 2000 Words)
Statistics Exercises Analysis Assignment Example | Topics and Well Written Essays - 2000 Words. https://studentshare.org/statistics/1843054-week-3-statistics.
“Statistics Exercises Analysis Assignment Example | Topics and Well Written Essays - 2000 Words”. https://studentshare.org/statistics/1843054-week-3-statistics.
  • Cited: 0 times

CHECK THESE SAMPLES OF Statistics Exercises Analysis

Demographic Data Analysis

DATA analysis Results Sample Characteristics The demographic characteristics of the sample size were identified.... Generally, a lot of the respondents have enough time to be involved in practical exercises during weekends.... In the first place, exercises or physical activities aids in the relaxation of the body muscles (Alpha, 2005).... Finally, the statistics show that during days when rigorous activities take place, respondents sleep quite easily as compared to days when no physical activities are performed....
3 Pages (750 words) Research Paper

How Statistics Is Applied in Our Everyday Life and Why It Is Useful

This paper “How Statistics Is Applied in Our Everyday Life and Why It Is Useful” talks about the effectiveness of statistical analysis in different areas of everyday life and analyzes if the statistics can tell us trends on what happened in the past and predict what will happen in the future.... It can also be defined as a type of mathematical analysis involving the use of quantified representations, models, and summaries for a given set of empirical data or real-world observations....
7 Pages (1750 words) Coursework

Exploring Inferential Statistics and Their Discontents

220-221 (even numbered exercises) 2.... 273-275 (even numbered exercises) 2.... Exploring Inferential statistics and Their Discontents Name Institution Part I Question 1 Jackson (2012) Chapter 8, Pgs.... a) The test is a one-tailed b) H0: No variation between new and other toothpastes in mean figure of cavities in the entire population....
8 Pages (2000 words) Assignment

Effect of Physical Training on Quality of Life and Oxygen Consumption

Group A performed physical exercises having a constant workload, mostly in the form of cycling.... Group B performed varied physical exercises with an increasing workload.... The meaning did not prove the necessity for employing physical exercises to improve the QoL and oxygen consumption of patients with CHF....
8 Pages (2000 words) Assignment

Statistics Assignment

Further, the analysis computes the F statistics (F computed) using the formula; F = MSE/MSR and compares it with the F tabulated value; qf(.... For example, in this analysis, fully adjusting the explanatory variables results into a different p-value although statistically significant.... This means that participating in group discussions and exercises is beneficial in reducing chronic back… The interval, .... 35 indicates that the impact of discussions and group exercises has a proportion ranging from ....
4 Pages (1000 words) Essay

Spss statistical analysis

There are many ways to perform analysis of sport related statistical data (Williams & Wragg, 2004).... The number of points in the group is 44, which is under 100, therefore Shapiro-Wil test is used to determine normality of the distribution (Coakes & Steed, 2007).... The significant value is 0....
10 Pages (2500 words) Term Paper

Chi-Squared Testing

From the analysis, it is evident that there is a significant difference in the preference of potato chips hence we fail to accept the null hypothesis.... From the analysis of both the t-test and Mann Whitney U test, it is evident that there exists a significant difference in the average time.... Below we present a graphical representation to support the same;From the analysis, it is evident that the sample does not provide enough evidence to support the claim that there is a significant relationship between hair color and social extroversion hence we fail to reject the null hypothesis and conclude since the Kruska-Wallis test is not significant, a follow-up test is not necessary (Hollander, Wolfe, & Chicken, 2014)....
3 Pages (750 words) Essay

Quantitative Analysis of Healthy Ageing in England

hysical exercises play a vital role in reduction of and prevention of chronic diseases and combating age-related illness.... In UK as today we have over 15,000 population of senior citizen aged 100 years and above (Crown copyright, 2014).... The retirement age has… World Health Organization has been promoting a healthy ageing as people's ability regardless of age to have a healthy living, socially inclusive lifestyle and safe living....
16 Pages (4000 words) Assignment
sponsored ads
We use cookies to create the best experience for you. Keep on browsing if you are OK with that, or find out how to manage cookies.
Contact Us