StudentShare
Contact Us
Sign In / Sign Up for FREE
Search
Go to advanced search...
Free

Statistical Questions Analysis - Assignment Example

Cite this document
Summary
The assignment "Statistical Questions Analysis" focuses on the critical analysis of the student's answers to the questions in statistics. First, the file “SALES” contains weekly sales figures for 2012 for a newly introduced 1-liter carton of orange juice at a large suburban supermarket in Perth…
Download full paper File format: .doc, available for editing
GRAB THE BEST PAPER95.2% of users find it useful
Statistical Questions Analysis
Read Text Preview

Extract of sample "Statistical Questions Analysis"

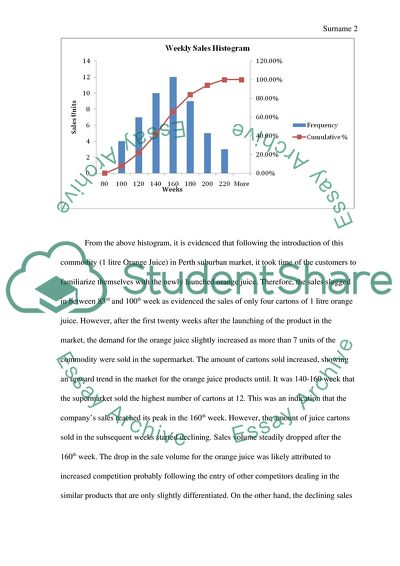
Statistical Analysis Question One The file “SALES” contains weekly sales figures for for a newly introduced 1 litre carton of orange juice at a large suburban supermarket in Perth. Weekly Sales Histogram for Orange Juice Cartons Bin Frequency Cumulative % 80 0 0.00% 100 4 8.00% 120 7 22.00% 140 10 42.00% 160 12 66.00% 180 9 84.00% 200 5 94.00% 220 3 100.00% More 0 100.00% From the above histogram, it is evidenced that following the introduction of this commodity (1 litre Orange Juice) in Perth suburban market, it took time of the customers to familiarize themselves with the newly launched orange juice. Therefore, the sales slugged in between 83rd and 100th week as evidenced the sales of only four cartons of 1 litre orange juice. However, after the first twenty weeks after the launching of the product in the market, the demand for the orange juice slightly increased as more than 7 units of the commodity were sold in the supermarket. The amount of cartons sold increased, showing an upward trend in the market for the orange juice products until. It was 140-160 week that the supermarket sold the highest number of cartons at 12. This was an indication that the company’s sales reached its peak in the 160th week. However, the amount of juice cartons sold in the subsequent weeks started declining. Sales volume steadily dropped after the 160th week. The drop in the sale volume for the orange juice was likely attributed to increased competition probably following the entry of other competitors dealing in the similar products that are only slightly differentiated. On the other hand, the declining sales of the orange juice would have been contributed to a fall in effective demand following changes in the consumer income and purchasing powers. Question Two The following table contains data for the number of withdrawals from a bank in an industrial area. Year Withdrawals ($ ten thousands) 2000 2001 2002 2003 2004 2005 2006 2007 2008 2009 23.6 18.3 26.0 24.9 28.1 25.3 29.1 24.7 30.1 27.8 Graphical Representation Trend Analysis The bank withdrawals from the industrial area from 2000 to 2009 were unsteady and unpredictable. As graphically demonstrated above, the trend in the withdrawal was zigzag characterized by ups and downs. For instance, in 2000, the withdrawal was $236,000 while in the following year, the amount withdrawn dropped to $183,000. The following year (2002), the figure increased to $260,000. The pattern continued in such a manner that although showing an upward trend in the amount withdrawn, all the odd years reported a slight decline in the industrial withdrawals compared to the even years. However, when the odd years are compared on their own, there was an increase in the amount withdrawn. This was an indication of increased business and operational activities in the industrial area as evidenced by the upward trend in annual withdrawals. The differences in the withdrawals between odd and even years may be attributed to changes in the economic cycles that are characterized by recessions in the odd years and recovery in the subsequent even years, holding other factors constant. Question Three The manufacturer of Boston and Vermont asphalt shingles provides its customers with a 20-year warranty on most of its products. To determine whether a shingle will last as long as the warranty period, accelerated-life testing is conducted at the manufacturing plant. Accelerated-life testing exposes a shingle to the stresses it would be subject to in a lifetime of normal use via an experiment in a laboratory setting that takes only a few minutes to conduct. In this test, a shingle is repeatedly scraped with a brush for a short period of time, and the shingle granules removed by the brushing are weighed (in grams). Shingles that experience low amounts of granule loss are expected to last longer in normal use than shingles that experience high amounts of granule loss. In this situation, a shingle should experience no more than 0.8 gram of granule loss if it is expected to last the length of the warranty period. The file “GRANULE” contains a sample of 170 measurements made on the company’s Boston shingles and 140 measurements made on Vermont shingles. (a) List the five-number summaries for the Boston shingles and for the Vermont shingles. Five Number Similarity Boston Shingles Vermont Shingles Minimum 0.04 0.02 First Quartile, Q1 0.17 0.13 Median 0.23 0.20 Third Quartile, Q3 0.32 0.28 Maximum 0.98 0.83 (b) Construct Boxplots for the two brands of shingles and describe the shapes of the distributions. (c) Comment on the ability of each type of shingle to achieve a granule loss of 0.8 gram or less. The box-plot analysis indicates that Vermont Shingles have a higher ability to last longer as compared to the Boston Shingles given that it has a lower spread, an indication that it losses less granules that does Boston Shingles. Question Four A tyre manufacturer believes that the tread-life of its snow tyres can be described by a Normal Model with a mean of 32,000 miles and standard deviation of 2500 miles. a) If a person buys a set of these tyres, would it be reasonable for him to expect they’ll last 40,000 miles? Z-score = (X – Xm)/S.D = (40,000 – 32,000)/2500 = 3.2 b) Approximately what fraction of these tyres can be expected to last less than 30,000 miles? (32,000 – 30,000)/2500 = 0.8 c) Approximately what fraction of these tyres can be expected to last between 30,000 and 35,000 miles? (35,000 – 30,000)/2500 = 2 d) Estimate the inter quartile range (IQR) of the tread-lives. Q1 = 32,000 – 2500 = 29,500 Q3 = 32,000 + 2500 = 34,500 Q3 – Q1 = 34,500 – 29,500 = 5,000 e) In planning a marketing strategy, a local tyre dealer wants to offer a refund to any customer whose tyres fail to last a certain number of miles. However, the dealer does not want to take too big a risk. If the dealer is willing to give refunds to no more than 1 of every 25 customers, for what mileage can he guarantee these tyres to last? (32000/2500) = 12.8 Q5. [8 Marks] Each year, ratings are complied concerning the performance of new cars during the first 90 days of use. Suppose that the cars have been categorized according to whether a car needs warranty-related repair (Yes, No) and the country in which the company manufacturing a car is (United States or Not United States). Based on the data collected, the probability that the new car needs a warranty repair is 0.04, the probability that the car was manufactured by a US –based company is 0.60 and the probability that the new car needs a warranty repair and was manufactured by a US –based company is 0.025. (a) Construct a contingency table to evaluate the probabilities of warranty-related repair. Manufacturers U.S Not U.S Total Need for Repair in 90 days Yes 0.025 0.015 0.040 No 0.975 0.985 1.95 Total 1.00 1.00 A new car (within 90 days of sale) is chosen at random. Use your contingency table to answer the following questions: (b) Needs a warranty repair? Probability of warranty repair = 0.40 (c) Needs a warranty repair and was manufactured by a US –based company? Warranty repair and US based = 0.025 (d) Needs a warranty repair or was manufactured by a US –based company? Repair or US Manufacturer = 0.04 + 0.025 = 0.065 (e) Needs a warranty repair or was not manufactured by a US –based company? Repair or Non US manufacturer = 0.04 + 0.015 = 0.055 Question Six The Australian quarterly total sales of wine (in millions of litres) and a quarterly Wine Price Index (WPI) are listed here for the 10 quarters from December 2002 to March 2005. Wine Sales WPI 97.6 71.4 86.7 92.0 99.2 76.2 87.7 95.3 103.7 76.4 156.0 153.7 155.6 157.0 158.3 156.4 159.1 161.0 162.6 159.5 a) Using Excel, produce a scatterplot of this data, including least-squares line, and full regression statistics. b) Estimate the quarterly total sales of wine when the WPI is 155.0 Regression Equation: WPI = 0.139Q + 145.5 When WPI = 155.0, Q = (155 – 145.5)/0.139 = 68.3 million litres Total Wines Sales = 68.3 million litres c) If an economist predicts that quarterly total wine sales should reach 105 million litres for a WPI of 165.0, comment on whether the prediction would be a valid use of this analysis. At Q = 105, WPI = 0.139(105) + 145.5 = 160 Although not accurate, the prediction that at Q = 105, the WPI should be 165.0 is acceptable at S.E = 5. Using a standard error of 5.00 units, then this prediction is statistically acceptable and valid. However, at standard error that is less than 5.00, this prediction is deemed in accurate and statistically invalid. d) There are some assumptions involved in using a linear regression model. Do you think they are reasonable for this case? Why? The construction of a linear regression model is founded on multiple assumptions about the relationship, response variables, and the predictor variables. Although these assumptions are statistically important in understanding the relationship between the response and the predictor variables, their application is limited to certain circumstances. These extensions and assumptions make the procedure of estimating the linear regression model more time-consuming and complex (Pindyck and Rubinfeld 78). Besides, the introduction of the underlying assumptions in the regression modeling process requires more detailed and quantitative data in order to accurately predict the regression model. Based on the above limitations and the nature of the data at hand, it is advisable that we relax or entirely eliminate these assumptions, to aid in the understanding and construction of the linear regression model. Work Cited Robert, Pindyck and Daniel, Rubinfeld. Econometric Models and Economic Forecasts. John Wiley, 2008. Print. Read More
Cite this document
  • APA
  • MLA
  • CHICAGO
(Statistical Questions Analysis Assignment Example | Topics and Well Written Essays - 1500 words - 2, n.d.)
Statistical Questions Analysis Assignment Example | Topics and Well Written Essays - 1500 words - 2. https://studentshare.org/statistics/1827890-statistics
(Statistical Questions Analysis Assignment Example | Topics and Well Written Essays - 1500 Words - 2)
Statistical Questions Analysis Assignment Example | Topics and Well Written Essays - 1500 Words - 2. https://studentshare.org/statistics/1827890-statistics.
“Statistical Questions Analysis Assignment Example | Topics and Well Written Essays - 1500 Words - 2”. https://studentshare.org/statistics/1827890-statistics.
  • Cited: 0 times

CHECK THESE SAMPLES OF Statistical Questions Analysis

Statistical Foundations

Thus, the time diary analysis can significantly provide information on the domestic division of labour, the quality of time and couples' significant ways on manipulating time to increase the proportion of enjoyable time (Sullivan, 1996).... … Table of Contents Page Description of the study 2 Detailed description of the statistical inference 3 Critique on inferential methods and tools used, and presentation of results 5 Other quantitative aspects in the study 9 Conclusion 10 References 11 Description of the study The study was all about understanding the pattern and enjoyment of daily activities among heterosexual couples....
9 Pages (2250 words) Essay

Exploring Inferential Statistics and Their Discontents

statistical test: a two-proportion t-interval b.... Exploring Inferential Statistics and Their Discontents Name Institution Part I Question 1 Jackson (2012) Chapter 8, Pgs.... 220-221 (even numbered exercises) 2.... a) The test is a one-tailed b) H0: No variation between new and other toothpastes in mean figure of cavities in the entire population....
8 Pages (2000 words) Assignment

Understanding Statistics

In any analysis, an individual can elucidate that number four is better than number three though the extent is not clear again, it is not easy to determine the variation between ok and happy.... Ratio scales are essential in statistical evaluations to its flexibility for alterations seeking accuracy.... According to the explanations provided on the above scales, the different statistical research studies can select any of the according to suitability for application....
6 Pages (1500 words) Essay

Evaluating the supervisors skills in high schools in the state of Kuwait

Educators today are continuously seeking to provide an interactive learning environment, which will help attract the attention of students and will urge them to exchange views and experiences.... All personnel associated with education bear responsibility towards students and need… The main tasks for these individuals, whether they are educationalists or administrative staff, are defined in scope to include the continuous search for new methods and ways to develop the educational structure; including the The educational system is, and needs to be a system that is based on an informed open door policy....
10 Pages (2500 words) Essay

Statistical techniques in engineering Management

This is very useful in engineering analysis since just a sample will enable to explain a whole population therefore saving a lot of time and money.... c) analysis of Variance (ANOVA)- is set of statistical models and the procedures entailed, in which the variance in one variable is subdivided to different sources of variations.... ill the result of this analysis be of any good or contribution in understanding the subject?... o we have enough funding to carry out this analysis?...
2 Pages (500 words) Essay

SPSS for analyzing data with one IV and more than one DV & one-way between subjects MANOVA

You will also need to submit the SPSS Output files showing the analyses you performed in SPSS to compute the answers for related questions.... You will also need to submit the SPSS Output files showing the analyses you performed in SPSS to compute the answers for related questions.... s the MANOVA an appropriate statistical technique for this research?...
1 Pages (250 words) Essay

Statistics questions

The major explanation can be on the wording used on questions to collect the relevant data.... Alternative hypothesis: The incidence of crimes committed on full moon days was much higher than on all other days, new moon days, and seventh days after the full moon and new moon ...
6 Pages (1500 words) Assignment

Exploring Inferential Statistics and Their Discontents

eneral Linear Model fers to a linear model applied in statistical analysis; it is used in testing hypotheses, factor in estimates, known quantities and other sources of errors in statistical experiments.... On the other hand, non-parametric methods refer to general statistical techniques that do not make assumptions about normality of a population under study.... t is crucial to pay attention to assumptions of statistical tests since a number of incorrect background assumptions will definitely result to inaccurate conclusions about a population being studied....
4 Pages (1000 words) Essay
sponsored ads
We use cookies to create the best experience for you. Keep on browsing if you are OK with that, or find out how to manage cookies.
Contact Us