StudentShare
Contact Us
Sign In / Sign Up for FREE
Search
Go to advanced search...
Free

The Effect of School Location and Gender of Students on PSAT Reading, Writing and Math Score - Research Paper Example

Cite this document
Summary
"The Effect of School Location and Gender of Students on PSAT Reading, Writing and Math Score" paper carries out a study to determine the effect of School Location and gender of Students on PSAT Reading, Writing, and Math Score using the data that include MANOVA on 2 independent variables. …
Download full paper File format: .doc, available for editing
GRAB THE BEST PAPER95.9% of users find it useful
The Effect of School Location and Gender of Students on PSAT Reading, Writing and Math Score
Read Text Preview

Extract of sample "The Effect of School Location and Gender of Students on PSAT Reading, Writing and Math Score"

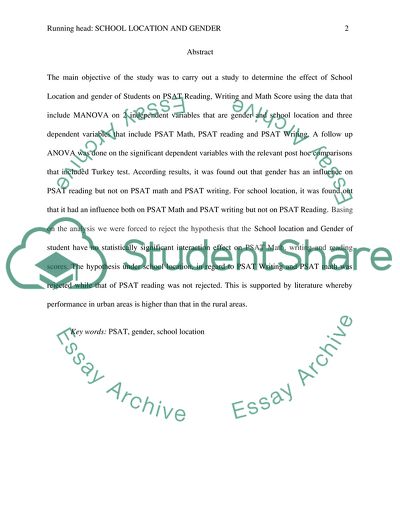
The effect of School Location and Gender on PSAT Reading, Writing and Math Score ] Abstract The main objective of the study was to carry out a study to determine the effect of School Location and gender of Students on PSAT Reading, Writing and Math Score using the data that include MANOVA on 2 independent variables that are gender and school location and three dependent variables that include PSAT Math, PSAT reading and PSAT Writing. A follow up ANOVA was done on the significant dependent variables with the relevant post hoc comparisons that included Turkey test. According results, it was found out that gender has an influence on PSAT reading but not on PSAT math and PSAT writing. For school location, it was found out that it had an influence both on PSAT Math and PSAT writing but not on PSAT Reading. Basing on the analysis we were forced to reject the hypothesis that the School location and Gender of student have no statistically significant interaction effect on PSAT Math, writing and reading scores. The hypothesis under school location, in regard to PSAT Writing and PSAT math was rejected while that of PSAT reading was not rejected. This is supported by literature whereby performance in urban areas is higher than that in the rural areas. Key words: PSAT, gender, school location Literature Review For several years, PSAT included only mathematics and reading section. In this case, females and males were seen to perform equally on the part of reading and this resulted to higher total scores (College Board. 2011). It has been indicated over the years that when the state level (2nd cutoff score) and nationwide (1st cutoff score) were applied, most of the semifinalists were seen to be males (Hedges and Friedman, 1993). NMSC never publishes the results by gender of semifinalists, but in the year 1994, it was estimated by FairTest that 60 % were male despite more females sat the PSAT (1999) (College Board. 2011. In this case, a complaint was filed by FairTest with the US Department of Education’s Office for Civil Rights. There claim was that the College Board discriminated against the females on the manner of designing and administering the PSAT (College Board. 2011).The case was settled by adding the writing section which was believed to favor females to a large extend. After the addition of this section, it was observed that this section seemed to narrow but did not solve the Gender gap (FairTest, 1999). The major reasons why there is male overrepresentation in the process of National Merit selection is related to the males higher mean score on the PSAT mathematics part as well as their high variability on the all exam sections (Wainer and Steinberg, 1992). In this case, it was observed that males had a larger standard deviation in mathematics; hence the variation was more as compared to the females both on the reading and writing sections (College Board, 2011) The PSAT is specifically designed for predicting early college success .On the other hand NMSC uses it for other different reasons (Bridgeman and Wendler, 1991). That is to determine the merit by use of scores from a single test that is not validated for such given reasons. According to the literature, it is known that students in urban schools normally perform highly in reading as compared to students in other areas (PISA, 2009).This is so even after taking into account the socio-economic background. It is seen mostly across OECD countries whereby individuals in city school are at least one proficiency level ahead of those individuals in rural schools (PISA, 2009).However the student performance and school location are seen to be strongly related after taking into account the socioeconomic differences in United States including other nations such as Belgium, Finland, Germany, United Kingdom, etc (PISA, 2009).Basing on the literature we can see that Gender and school location has an effect on the performance of students. Therefore, the current study was to ascertain the effect of Gender and School location on PSAT Math, Writing and reading scores. Research question: Does student gender affect PSAT Math, writing and reading scores? Does school location affect PSAT Math, writing and reading scores? Does student gender and school location affect PSAT Math, writing and reading scores? Null-Hypotheses: School location has no statistically significant effect on PSAT Math , writing and reading scores Gender of student has no statistically significant effect on PSAT Math , writing and reading scores School location and Gender of student have no statistically significant interaction effect on PSAT Math, writing and reading scores. The alpha level The three null hypotheses were tested on the basis of the 3 dependent variables at an alpha level of 0.05. Results Table 1 Case Processing Summary Gender Cases Valid Missing Total N Percent N Percent N Percent PSAT Reading Men 49 100.0% 0 0.0% 49 100.0% Women 50 98.0% 1 2.0% 51 100.0% PSAT Math Men 49 100.0% 0 0.0% 49 100.0% Women 50 98.0% 1 2.0% 51 100.0% PSAT Writing Men 49 100.0% 0 0.0% 49 100.0% Women 50 98.0% 1 2.0% 51 100.0% The above table is based on case processing summary for gender. It can be observed that PSAT reading, math and writing all have 49(100%) and 50(98%) of men and women respectively who were considered in the survey. The other 2% of the sample was missing or not included in the study. The total sample size for both men and women was 49 and 51 respectively. Table 2 Case Processing Summary School Location Cases Valid Missing Total N Percent N Percent N Percent PSAT Reading Urban 38 100.0% 0 0.0% 38 100.0% Rural 33 100.0% 0 0.0% 33 100.0% Suburban 28 96.6% 1 3.4% 29 100.0% PSAT Math Urban 38 100.0% 0 0.0% 38 100.0% Rural 33 100.0% 0 0.0% 33 100.0% Suburban 28 96.6% 1 3.4% 29 100.0% PSAT Writing Urban 38 100.0% 0 0.0% 38 100.0% Rural 33 100.0% 0 0.0% 33 100.0% Suburban 28 96.6% 1 3.4% 29 100.0% The above table is based on case processing summary for school location. It can be seen that PSAT reading, math and writing all have 38(100%), 33(100%) and 28(96.6%) of respondents in urban, rural and suburban respectively were considered in the study. The other 3.4 % of the suburban sample was missing or not included in the study. The total sample size for all the respondents was 38, 33 and 29 for urban rural and suburban respectively. Table 3 Tests of Normality for Gender Gender Kolmogorov-Smirnova Shapiro-Wilk Statistic df Sig. Statistic df Sig. PSAT Reading Men .149 49 .008 .945 49 .024 Women .111 50 .173 .937 50 .010 PSAT Math Men .107 49 .200* .965 49 .157 Women .134 50 .025 .918 50 .002 PSAT Writing Men .146 49 .010 .914 49 .002 Women .140 50 .016 .937 50 .010 *. This is a lower bound of the true significance. a. Lilliefors Significance Correction The table above indicates the results from Kolmogorov-Smirnov test and Shapiro-Wilk Test. The Shapiro-Wilk Test is known to be more appropriate for sample size that is small(less than 50) but it can as well handle sample size as large as 2000.For this matter, the Shapiro-Wilk was used to assess normality as the numerical means. It can be observed from the table that for gender, PSAT reading in men was the only one seen to be normally distributed. This is because, the sig value of Shapiro-Wilk test is greater than 0.05 and it implies that the data is normally distributed. The other dependent variables had the sig values less than 0.05 and this means the data was not normally distributed. For the histogram (Appendix 1; fig 1-2), it can be observed that the scores are normally distributed because most of the score frequencies are at the center. This is evident with PSAT reading and Math. Table 4 Tests of Normality for school Location School Location Kolmogorov-Smirnova Shapiro-Wilk Statistic df Sig. Statistic df Sig. PSAT Reading Urban .128 38 .119 .956 38 .141 Rural .163 33 .026 .905 33 .007 Suburban .200 28 .006 .934 28 .079 PSAT Math Urban .105 38 .200* .935 38 .030 Rural .144 33 .081 .935 33 .047 Suburban .152 28 .095 .933 28 .073 PSAT Writing Urban .155 38 .021 .956 38 .145 Rural .126 33 .198 .948 33 .114 Suburban .208 28 .003 .901 28 .012 The Shapiro-Wilk was used to assess normality as the numerical means. It can be observed from the table that under school location, PSAT reading in urban and suburban, PSAT math in rural and suburban and PSAT writing in rural were normally distributed. This is because, the sig value of Shapiro-Wilk test is greater than 0.05 and it implies the data is normally distributed. The other dependent variables that include PSAT in rural, PSAT math in rural and PSAT writing in suburban had the sig value less than 0.05 and this means the data was not normally distributed. Correlation Basing on the correlation results (table 5), it is observed that, the correlation is statistically significant under gender and school location in regards to all the dependent variables (p value is less than 0.005).In addition the correlation is relatively strong across the groups. Table 5 Correlations Gender School Location PSAT Reading PSAT Math PSAT Writing Gender Pearson Correlation 1 -.074 -.087 -.104 .010 Sig. (2-tailed) .469 .391 .301 .921 N 100 99 100 100 100 School Location Pearson Correlation -.074 1 .500** .515** .517** Sig. (2-tailed) .469 .000 .000 .000 N 99 100 100 100 100 PSAT Reading Pearson Correlation -.087 .500** 1 .700** .546** Sig. (2-tailed) .391 .000 .000 .000 N 100 100 101 101 101 PSAT Math Pearson Correlation -.104 .515** .700** 1 .624** Sig. (2-tailed) .301 .000 .000 .000 N 100 100 101 101 101 PSAT Writing Pearson Correlation .010 .517** .546** .624** 1 Sig. (2-tailed) .921 .000 .000 .000 N 100 100 101 101 101 Covariance matrices MANOVA assumption is that the dependent variables covariance matrices are the same across groups (determined by independent variables levels) in the given population such as multivariate assumption analog of equal variances for ANOVA. In this case, Box’s can test this assumption Field, 2013 p34). Basing on the test (table 6), the p value of 0.437 indicates that the equal covariance matrices hypothesis can’t be rejected. This implies that the MANOVA assumption has not been violated and this gives as confidence to proceed with respect to this given assumption. This could also mean that there is limited evidence that the variances aren’t equal as well as the variance assumption homogeneity may fit (table 7). Table 6 Boxs Test of Equality of Covariance Matricesa Boxs M 33.457 F 1.019 df1 30 df2 15670.346 Sig. .437 Multivariate Test The multivariate tests that include hotelling’sWilks’,Pillai’s and Roys all tests the null hypothesis of MANOVA (Stevens, 2002). The hypothesis to be tested is; the mean on the composite variables is the same across groups. In relation to this, such tests in the multivariate tests have the capacity of providing different results. In my results they are the same when contrasted across the groups. According to the results output (table 7), it is observed that the multivariate hypothesis that the mean on the composite is the same across groups is to be rejected. This is based on the fact that this is an equality test of composite of means (It is optimized in order to generate maximum F-ratio possible) across the groups Vogt, 2011.p23).And we can see that the sig values are 0.00 indicating p less than 0.005.In case, if the statistically significant results have been met, it is seen that many follow up tests could not be performed. But for the case of this study, we are eligible to continue with further tests since the results are statistically significant Table 7 Multivariate Testsa Effect Value F Hypothesis df Error df Sig. Partial Eta Squared Noncent. Parameter Observed Powerd Intercept Pillais Trace .963 791.254b 3.000 91.000 .000 .963 2373.762 1.000 Wilks Lambda .037 791.254b 3.000 91.000 .000 .963 2373.762 1.000 Hotellings Trace 26.085 791.254b 3.000 91.000 .000 .963 2373.762 1.000 Roys Largest Root 26.085 791.254b 3.000 91.000 .000 .963 2373.762 1.000 Gender Pillais Trace .019 .582b 3.000 91.000 .628 .019 1.747 .166 Wilks Lambda .981 .582b 3.000 91.000 .628 .019 1.747 .166 Hotellings Trace .019 .582b 3.000 91.000 .628 .019 1.747 .166 Roys Largest Root .019 .582b 3.000 91.000 .628 .019 1.747 .166 Sch_loc Pillais Trace .367 6.893 6.000 184.000 .000 .184 41.356 1.000 Wilks Lambda .635 7.736b 6.000 182.000 .000 .203 46.419 1.000 Hotellings Trace .572 8.582 6.000 180.000 .000 .222 51.494 1.000 Roys Largest Root .567 17.385c 3.000 92.000 .000 .362 52.155 1.000 Gender * Sch_loc Pillais Trace .052 .819 6.000 184.000 .556 .026 4.915 .320 Wilks Lambda .949 .811b 6.000 182.000 .562 .026 4.867 .316 Hotellings Trace .054 .803 6.000 180.000 .569 .026 4.818 .313 Roys Largest Root .034 1.050c 3.000 92.000 .375 .033 3.149 .276 Standard levene’s test In most cases, MANOVA programs give univariate tests for each dependent variables employed in the MANOVA (Pett et al., 2003.p47). For our case, they include PSAT Math, PSAT Writing and PSAT Reading. Possibly the test is conducted for a specific reason whereby is to determine if we can proceed with the univariate test and it can be so if the multivariate test is significant (protecting against type I error) (Meyers et al., 2006).For this particular reason, the standard levene’s test of the equal variances assumption for each of the given dependent variables and this is the ANOVA assumption. For all the PSAT Reading, PSAT math and PSAT Writing the test generated p values that are not significant. In this regard, the null hypothesis of the equal variances can’t be rejected for all the mentioned dependent variables. This means that the ANOVA is appropriate and fine (table 8) Table 8 Levenes Test of Equality of Error Variancesa F df1 df2 Sig. PSAT Reading 1.284 5 93 .278 PSAT Math 1.389 5 93 .236 PSAT Writing 2.008 5 93 .085 Tests of Between –Subject Effects Table 9 Tests of Between-Subjects Effects Source Dependent Variable Type III Sum of Squares df Mean Square F Sig. Partial Eta Squared Noncent. Parameter Observed Powerd Gender PSAT Reading 90.731 1 90.731 .610 .437 .007 .610 .121 PSAT Math 106.984 1 106.984 .613 .436 .007 .613 .121 PSAT Writing 29.295 1 29.295 .194 .660 .002 .194 .072 Sch_loc PSAT Reading 5089.302 2 2544.651 17.112 .000 .269 34.224 1.000 PSAT Math 5831.151 2 2915.576 16.716 .000 .264 33.431 1.000 PSAT Writing 5387.079 2 2693.539 17.858 .000 .277 35.716 1.000 Gender * Sch_loc PSAT Reading 88.761 2 44.381 .298 .743 .006 .597 .096 PSAT Math 316.056 2 158.028 .906 .408 .019 1.812 .202 PSAT Writing 301.235 2 150.617 .999 .372 .021 1.997 .219 Error PSAT Reading 13829.711 93 148.707 PSAT Math 16221.244 93 174.422 PSAT Writing 14027.406 93 150.832 Total PSAT Reading 255063.000 99 PSAT Math 253981.000 99 PSAT Writing 277144.000 99 Corrected Total PSAT Reading 19319.960 98 PSAT Math 22706.000 98 PSAT Writing 19950.909 98 Table 10 PSAT Reading Tukey HSDa,b School Location N Subset 1 2 Urban 38 39.7895 Rural 33 52.3333 Suburban 28 56.8571 Sig. 1.000 .298 PSAT Math Tukey HSDa,b School Location N Subset 1 2 Urban 38 38.9737 Rural 33 51.2424 Suburban 28 57.6071 Sig. 1.000 .133 PSAT Writing Tukey HSDa,b School Location N Subset 1 2 Urban 38 41.7105 Rural 33 54.6970 Suburban 28 59.1429 Sig. 1.000 .315 Discussion In relation to the findings of the levene’s test, the test had to be considered though it is seen that the tests are not related directly to the multivariate test. In this case, the error was treated appropriately. The considerable way used to adjust the error was to apply the Bonferroni inequality; hence, the three null hypotheses were tested on the basis of the 3 dependent variables at α/2 level. According to the result output(table 9), For example, the α=0.05 was adjusted, and the adjusted error is 0.613.It is observed that under the between the subject effects tests, when the modified alpha is used, the null hypothesis under gender regarding PSAT math, PSAT Writing can’t be rejected while for the PSAT reading is to be rejected. This is contrary to the literature whereby gender is known to have a greater influence on PSAT writing instead of reading and females seem to perform more than the males (Hedges and Friedman, 1993). The hypothesis under the School location, in regards to PSAT math, PSAT Writing is to be rejected while that of PSAT reading is not rejected. In relation to literature; it is evident that the performance in urban areas is higher than that in the rural areas (PISA, 2009). The current study showed that school location had an effect only on PSAT reading. The hypothesis under gender*school location in regards to PSAT math, PSAT Writing is to be rejected. This means that the interaction of gender and school location has an influence on the PSAT Math, reading and writing. In regard to multiple comparison(table 7), the results output indicate that PSAT Reading scores were statistically significantly between urban and rural (p value less than 0.005), but it was not statistically significant between rural and suburban(p value greater than 0.005=0.323).PSAT Math scores were statistically different between rural and urban(p value less than 0.005),but not between rural and suburban(p=0.151).For the PSAT Writing, the scores were statistically significantly different between rural and urban (p value less than 0.005),but not between rural and suburban. TurkeyHSD test is used to summarize the procedure of multiple comparisons. According to the test, the means of all the subsets shown are not statistically significant. This is in line with failing to reject the null hypothesis of the ANOVA across the groups. Conclusion In conclusion, it is observed that gender has an influence only on PSAT reading but not on PSAT math and PSAT writing. In regard to school location, it is observed that school location influences both PSAT Math and PSAT writing but it has no influence on PSAT Reading. Also basing on the analysis we had to reject the hypothesis that the School location and Gender of student have no statistically significant interaction effect on PSAT Math, writing and reading. Reference Bridgeman, B. and Wendler. C. (1991). Gender differences in predictors of college Mathematics performance and in college mathematics course grades. Journal of Educational Psychology, 83, (2), 275-284. College Board. (2011). PSAT/NMSQT 2010-2011 College-Bound High School Juniors. http:// professionals.collegeboard.com. (Date of retrieval: 15 December 2011). FairTest. (1999). Test-Makers to Revise National Merit Exam to Address Gender Bias http://www.fairtest.org/examarts/fall96/natmerit.htm. Field, A. (2013). Discovering statistics using SPSS (4th ed.). Thousand Oaks, CA: Sage. Hedges, L.V. and Friedman, L. (1993). Gender differences in variability in intellectual abilities: A reanalysis of Feingold’s results. Review of Educational Research. 63: 94-105. Meyers, L. S., Gamst, G., Guarino, A. J. (2006). Applied multivariate research: design and interpretation. Thousand Oaks, CA: Sage Publications, Inc. Pett, M. A. et al. (2003). Making sense of factor analysis: The use of factor analysis for instrument development in health care research. Thousand Oaks, CA: Sage. PISA. (2009). Results Volume II, Overcoming Social Background: Equity in Learning Opportunities and Outcomes. Full data are shown in Table II.2.6 at the back of that volume. professionals.collegeboard.com. (Date of retrieval: 15 December 2011). Stevens, J. P. (2002). Applied multivariate statistics for the social sciences. Mahwah, NJ: Lawrence Erlbaum Associates, Inc. Vogt, W. P. (2011). Dictionary of statistics and methodology: A nontechnical guide for the social sciences (3rd ed.). Thousand Oaks, CA: Sage. Wainer, H. and Steinberg, L.S. (1992).Sex differences in performance on the mathematics section of the Scholastic Aptitude Test: A bidirectional validity study. Harvard Educational Review, 62: 323-336. Appendix Read More
Cite this document
  • APA
  • MLA
  • CHICAGO
(The Effect of School Location and Gender of Students on PSAT Reading, Research Paper Example | Topics and Well Written Essays - 3000 words, n.d.)
The Effect of School Location and Gender of Students on PSAT Reading, Research Paper Example | Topics and Well Written Essays - 3000 words. https://studentshare.org/statistics/1821080-the-affect-of-school-location-and-gender-of-student-on-psat-reading-writing-and-math-score
(The Effect of School Location and Gender of Students on PSAT Reading, Research Paper Example | Topics and Well Written Essays - 3000 Words)
The Effect of School Location and Gender of Students on PSAT Reading, Research Paper Example | Topics and Well Written Essays - 3000 Words. https://studentshare.org/statistics/1821080-the-affect-of-school-location-and-gender-of-student-on-psat-reading-writing-and-math-score.
“The Effect of School Location and Gender of Students on PSAT Reading, Research Paper Example | Topics and Well Written Essays - 3000 Words”. https://studentshare.org/statistics/1821080-the-affect-of-school-location-and-gender-of-student-on-psat-reading-writing-and-math-score.
  • Cited: 0 times

CHECK THESE SAMPLES OF The Effect of School Location and Gender of Students on PSAT Reading, Writing and Math Score

Teacher Satisfaction and Student Academic Achievement

To accomplish this, teachers are the main vehicles that set the climate, offer encouragement, and deliver the curricula that students require, in pursuit of successfully meeting the expectations set by state and federal legislation, as well as the local administration, regardless of the functioning condition of the district.... Schools in small districts face the same issues as other schools across the country in reference to the recruitment and retention of quality teachers, but, there are a small number of researchers who have suggested that these schools encounter different issues than those of larger schools and school districts....
25 Pages (6250 words) Essay

Unreliable test

The benefits of experiments are that they help researchers determine cause and effect relationships by manipulating one variable.... A reliable test estimates the consistency of the measurement conducted.... Reliability means how the results are measured and if they are found the same way each time they are gathered....
5 Pages (1250 words) Essay

Attachment and bullying

This was based on students' willingly to participate Informed consent was taken into consideration at the start of any research project (Shank, 2002).... To recruit participants emails were sent around campus requesting for volunteers.... Purposive sampling is a popular sampling technique, as the sample size does not have to be determined at the beginning of the… It is also an advantage for this study, as the sample size was constrained by time and available resources (Mack, Woodsong, MacQueen, Guest & Namey, 2005)....
16 Pages (4000 words) Essay

Student Attitudes Toward School, Behavior, Academic Performance

Research, educational leaders, policymakers, students, and parents all seem to have a different opinion as to what defines school success.... nbsp; Thus, what students see at any given time sends a message to their mind that what they have seen is the truth.... The paper "Student Attitudes Toward school, Behavior, Academic Performance" aims to investigate the relationship between a student's perception of self, teacher relationships, the ability to do well in school, the potential for good grades and engagement in school activities....
29 Pages (7250 words) Essay

Program Improvement Status and Standardized Math Scores

The major objective of the qualitative study "Program Improvement Status and Standardized math Scores" was to study the effects that placing an elementary on program status in the Los Angeles Unified School District has on students overall scores achieved on standardized math exams.... Each of the participants serving on the research panel was either an administrator, teacher, or support personnel currently employed in an elementary school in the Los Angeles Unified school District....
21 Pages (5250 words) Essay

Content Writing of Coursework

The author states that tackling mathematical and statistical problems need not be a pain anymore with the math Coursework.... With (company name), it becomes easy to take care of the various levels at which a student needs to master the art of math.... Competence in math from an early age is an important prerequisite that will choose the most appropriate line of work, besides ensuring that the student excels at it too.... Professional education draws from this premise the maximum within the math coursework....
49 Pages (12250 words) Assignment

Principal Leadership Behaviors and Leader Self-efficacy Relating to School Performance in School

The study will include an examination of school performance at the elementary grade level inadequate and inadequate schools as determined by the AYP status.... The study of the leadership behavior and practices of school principals will be conducted at the elementary school level to determine the significance of principal leadership to AYP status student achievement under NCLB.... nbsp;Historical public criticism of educational effectiveness and the later passage of the No Child Left Behind Act redefined the expected leadership role of school principals....
50 Pages (12500 words) Case Study

College Entrance Exams - Do They Predict Undergraduate Success

Imperial schools tested musical skills, archery, horsemanship, arithmetic, writing composition, and information regarding various ceremonies.... Despite the fact that such admittance tests are considered a source for assessing the students' respective skills, many colleges still do not require submission of ACT and SAT tests scores for admission....
8 Pages (2000 words) Essay
sponsored ads
We use cookies to create the best experience for you. Keep on browsing if you are OK with that, or find out how to manage cookies.
Contact Us