StudentShare
Contact Us
Sign In / Sign Up for FREE
Search
Go to advanced search...
Free

Importance of Statistical Significance in Analyzing Quantitative Data - Essay Example

Cite this document
Summary
The paper "Importance of Statistical Significance in Analyzing Quantitative Data" states that significance analysis is crucial because it may be used as a researcher’s tool in gaining basic knowledge in understanding situations and events. It is commonly applicable in science and in businesses…
Download full paper File format: .doc, available for editing
GRAB THE BEST PAPER97.7% of users find it useful
Importance of Statistical Significance in Analyzing Quantitative Data
Read Text Preview

Extract of sample "Importance of Statistical Significance in Analyzing Quantitative Data"

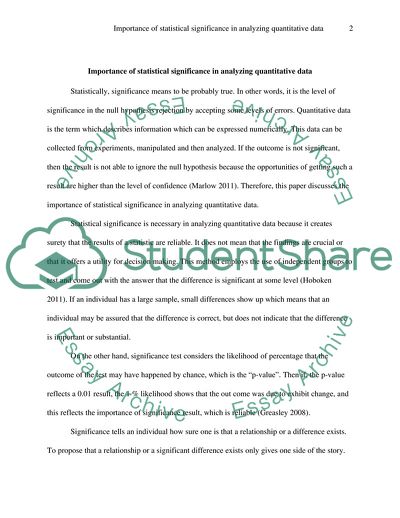
Importance of statistical significance in analyzing quantitative data al Affiliation Importance of statistical significance in analyzing quantitative data Statistically, significance means to be probably true. In other words, it is the level of significance in the null hypothesis rejection by accepting some levels of errors. Quantitative data is the term which describes information which can be expressed numerically. This data can be collected from experiments, manipulated and then analyzed. If the outcome is not significant, then the result is not able to ignore the null hypothesis because the opportunities of getting such a result are higher than the level of confidence (Marlow 2011). Therefore, this paper discusses the importance of statistical significance in analyzing quantitative data. Statistical significance is necessary in analyzing quantitative data because it creates surety that the results of a statistic are reliable. It does not mean that the findings are crucial or that it offers a utility for decision making. This method employs the use of independent groups to test and come out with the answer that the difference is significant at some level (Hoboken 2011). If an individual has a large sample, small differences show up which means that an individual may be assured that the difference is correct, but does not indicate that the difference is important or substantial. On the other hand, significance test considers the likelihood of percentage that the outcome of the test may have happened by chance, which is the “p-value”. Then if, the p-value reflects a 0.01 result, the 1 % likelihood shows that the out come was due to exhibit change, and this reflects the importance of significance result, which is reliable (Greasley 2008). Significance tells an individual how sure one is that a relationship or a difference exists. To propose that a relationship or a significant difference exists only gives one side of the story. An individual may be sure that a difference exists but may not know if it is a weak, moderate or strong difference. After an individual has come up with a significant relationship, it is also crucial to evaluate the strength of significance. This method offers easy and quantifiable results, which can easily be understood. It provides a variety of analyzing ways (Piquero 2010). Statistical significance is a tool which finds out whether the result of an experiment is the outcome of a relationship of factors or a result by chance. This idea is commonly applicable in medical grounds to test vaccines and drugs to find out what causes diseases. Statistical significance may be applied to conduct experiments in biology and psychological environments (Monsen 2008). Statistical significance may be applied in production of event occurrence. For example, a sample may be manipulated let us say that 50 percent of women in the united states go to work, it is hard to ask every woman in the United States whether she goes to work, so a number of women may be questioned randomly and the outcome may be used to analyze and generalize to apply to all women in the United States (Hendricks 2011). Statistical significance may be applied to simplify research. Scientifically, statistical significance may be used to propose the hypothesis which enables data collection and analysis. The data statistical analysis then produces a number which is statistically significant when it goes down beyond significance level. For example, when the level may be set at 5%, and then the event likelihood may be determined significantly static the research confidence is 95%, which confirms that the result did not show up by chance (Haklay2010). Sometimes, when an experiment’s statistical significant is highly important, such as the human drugs safety, the significance must go down below 2 %. In this situation, the research shows 98 % probability that; the drug is safe for use by human. This figure can be raised or lowered to accommodate the desired importance of the outcome being correct. Statistical analysis may be used to accept or reject the null hypothesis. A hypothesis is a researcher’s prove to an explanation of an experiment. The importance of this criterion is that it holds the factors which a researcher expects have no difference effect in the data, or there is no link amongst the factors. It means that the significance of the occurrence of an event is not more than 5 %. The figure may cause the rejection of the null hypothesis. An example in this case may include the hypothesis that women get sad faster than men. To carry out this hypothesis, a researcher will observe a number of women and men and observe how many women get sad within a specified number of women and men in a given sample. After the completion of the experiment, a number of sad women to men may be statistically analyzed (Howell 2013). Application of statistical significance in clinical grounds; when evaluating the study validity, an individual should consider both statistical and clinical significance of the outcome. The idea of the strength of power of the clinical test considers the probability of difference detection amongst the study groups when true significance exists. This method helps to analyze studies which are clinically difficult to analyze. They help in carrying out statistical analysis in a large population of patients. This analysis may generate adequate clinically and power relevant findings. Dermatologists apply significance in making decisions whether a treatment to be applied to an individual is clinically applicable. It offers essential consideration to a treatment magnitude power and treatment study (Hendricks 2011). Significance analysis in clinical operations shows that the outcome is not due to change. However, statistics language obscures the clinical trial findings. Statistical significance in dermatology helps in analyzing the study validity in both statistical and clinical significance of the outcome. It offers dermatologists a conceptual clinical understanding in research since the strength of statistical field is the probability of sensing the difference when it occurs. It examines the power importance in examples in a dermatologic manner rather than power mathematical explanations (Piquero 2010). Statistical significance determines figures and factors. It is a crucial measurement of events and may be used to predetermine the practicality of events. This statistical method may be applied to display the actuality of events. Statistical significance may be used to find the answers to questions which can be measured. Significance statistical analysis gathers factual and measurable data which may be considered statistical. This method of data analysis is commonly applicable in mathematical grounds, science and also in businesses. Significance analysis is important because it is a researcher’s tool in acquiring basic knowledge in understanding events. It also offers crucial statistics and facts which help in solution development and future innovations (Hoboken 2013). Statistical significance analysis shows that the probability is the relationship which an individual thinks has come up only by random chance. However, by applying the normal curve and the probability theory an individual may be wrong if assuming that the relationship found is true. Therefore, statistical significance analysis may be used to predict that the relationship encountered in the data happened only by chance, the probability that population variables are unrelated. They may be used to select and filter the unpromising hypothesis (Greasley 2008). Conclusively, statistical analysis proves that there is a good opportunity which is crucial in coming up with a relationship that exist amongst two variables. Statistical significance requires a subjective decision in laying a predetermined and acceptable probability. It may range from zero to zero point one of making an error which may be caused by the error in sampling. Errors in sampling may only be eliminated by collecting population data entirely. Probability calculations can only be performed in the assumption context which is suitable to computation constrain provided that the problem requires only one answer. Statistical significance may be applied because it constitutes a crucial yardstick which can be accepted by a number of individuals, and it communicates important information about a research which can be in comparison to outcomes from other projects. This method helps to analyze studies which are clinically difficult to analyze and they help in carrying out statistical analysis in a large population of patients. Scientifically, statistical significance may be used to propose the hypothesis which allows data collection and analysis. Significance analysis is crucial because it may be used as a researcher’s tool in gaining basic knowledge in understanding situations and events. It is commonly applicable in science, mathematical grounds and also in businesses. On the other hand, dermatologists apply significance in making decisions whether a treatment to be applied to an individual is clinically applicable. However, individuals should apply association measures along with statistical significant analysis because they are the best and all of them have their own use. Therefore, the researcher should at all the time examine both the practical and any other research finding. References Analyzing quantitative data, an introduction for social researchers, 2011, Hoboken, N,J, John Wiley & Sons. Greasley, P, 2008), Quantitative data analysis using SPSS an introduction for health & social science, Maidenhead, Open University Press. Haklay, M, 2010, Interacting with geospatial technologies, Chichester, West Sussex, UK, John Wiley. Hendricks, D, 2011, Analyzing quantitative data, an introduction for social researchers, Hoboken, N, J, Wiley. Howell, D C, 2013, Statistical methods for psychology 8th ed, Belmont, CA, Wadsworth Cengage Learning. Marlow, C, 2011, Research methods for generalist social work 5th ed, Belmont, CA, Thomson Brooks, Cole. Monsen, E, R, & Horn, L, 2008, Research, successful approaches 3rd ed, Chicago, American Dietetic Association. Piquero, A, R, & Weisburd, D,2010, Handbook of quantitative criminology, New York, Springer. Read More
Cite this document
  • APA
  • MLA
  • CHICAGO
(What is the importance of Statistical Significance in Analysing Essay Example | Topics and Well Written Essays - 1250 words, n.d.)
What is the importance of Statistical Significance in Analysing Essay Example | Topics and Well Written Essays - 1250 words. https://studentshare.org/statistics/1801757-what-is-the-importance-of-statistical-significance-in-analysing-quantitative-data
(What Is the Importance of Statistical Significance in Analysing Essay Example | Topics and Well Written Essays - 1250 Words)
What Is the Importance of Statistical Significance in Analysing Essay Example | Topics and Well Written Essays - 1250 Words. https://studentshare.org/statistics/1801757-what-is-the-importance-of-statistical-significance-in-analysing-quantitative-data.
“What Is the Importance of Statistical Significance in Analysing Essay Example | Topics and Well Written Essays - 1250 Words”. https://studentshare.org/statistics/1801757-what-is-the-importance-of-statistical-significance-in-analysing-quantitative-data.
  • Cited: 1 times

CHECK THESE SAMPLES OF Importance of Statistical Significance in Analyzing Quantitative Data

Core Concepts of Quantitative Research in Medicine

Numerous quantitative research studies contain elements pertaining to the qualitative data as well as the quantitative data.... Various studies in which numerical data is collected and analyzed are termed as quantitative researches because they make use of scientific methods and pay emphasis on controlling the variables, collecting evidence that can be measures, and provide new explanations that can be generalized beyond just the research samples.... hellip; Quantitative researches typically specify the number of research participants as sample from the population and display the data on numerous events taking place or biological variables....
20 Pages (5000 words) Research Paper

Data Research Analysis

Data analysis in mixed methods research consists of analyzing the qualitative data using qualitative methods and the quantitative data using quantitative methods; therefore, knowing the steps in both forms of analysis is necessary in mixed research methods (Creswell & Plano Clark, 2007).... hellip; Several procedures are involved including collecting data from the field however once data has been collected the next biggest challenge is to convert this data into useful information....
6 Pages (1500 words) Essay

Quantitative Geography

hellip; The purpose of Geographic Information System (GIS) is to make possible to view, understand, question, interpret, and visualize data in many ways and reveal relationships, patterns, and trends.... It is not a surprise that GIS data today is used by thousands of organizations from different segments of life, from businesses, governments, educators and scientists, environmental and conservation organizations to natural resource groups and utilities.... This approach allows us to create geographic knowledge by measuring the earth, organizing this data, and analyzing and modeling various processes and their relationships....
8 Pages (2000 words) Essay

The Relationship Between the Gross Domestic Product and the Balance of Trade

quantitative data, as opposed to qualitative data, categorize elements by attaching numeric measures to them.... The interval quantitative data lacks a natural starting point.... Alternatively, ratio quantitative data has a zero level or a natural starting point, such data include net expenditure or net income.... The importance of this statistical technique is the fact that unlike in academia, the real business world is rich in information to base on in making critical decisions correctly....
9 Pages (2250 words) Essay

Quantitative and Qualitative Methods of Research

The author examines the concept of reliability in quantitative and qualitative research, descriptive statistics in business and management, the concept of statistical significance, a method that expresses the likelihood that a given result of an experiment could have occurred by mere chance … The validity and reliability of qualitative research will mostly depend on the skill of the researcher.... A good is an example is how the researcher uses their good statistical skills to formulate, represent and analyze data....
4 Pages (1000 words) Assignment

Qualitative and Quantitative Research Methods of Supply Chain Management

On the other hand, quantitative research refers to the usage statistics, mathematical techniques and empirical investigation in order to come up with data and information that is analyzed and a conclusion are made.... The intention of the following paper is to discuss the statement that qualitative research is better than quantitative research.... ualitative research is focused on looking for answers to questions that relate to the social world an area that is challenging for research by the quantitative researchers....
14 Pages (3500 words) Research Paper

Racial Inequality in Education

quantitative data ANALYSIS1) The specification of a research topic or theme, related to academic literature, that you will explore using the BSAS data.... econdary data is data that is collected and generated by one researcher, which could also be used quantitative data ANALYSIS1) The specification of a research topic or theme, related to academic literature, that you will explore using the BSAS data.... econdary data is data that is collected and generated by one researcher, which could also be used by other researchers for their own aims and purposes....
12 Pages (3000 words) Assignment

Sampling Logic in Qualitative and Quantitative Research

"Sampling Logic in Qualitative and Quantitative Research, Quantitative and Qualitative Data Collection Methods" paper contains a description of the qualitative and quantitative data analysis methods.... Constant comparative analysis, on the other hand, codes data sufficient enough to generate hypotheses and various research categories (Strauss and Corbin, 1990).... Simply put, quantitative question consolidates benchtop science (where experiments are conducted) epidemiology (where illness rates of a given population are obtained) just to name a few....
8 Pages (2000 words) Assignment
sponsored ads
We use cookies to create the best experience for you. Keep on browsing if you are OK with that, or find out how to manage cookies.
Contact Us