StudentShare
Contact Us
Sign In / Sign Up for FREE
Search
Go to advanced search...
Free

Green Consumer Behaviour Analysis - Statistics Project Example

Cite this document
Summary
The "Green Consumer Behaviour Analysis" paper presents the results of statistical tests conducted to understand how the people interviewed consume “green products.” Descriptive statistics is used to describe the basic features of the data in the study. …
Download full paper File format: .doc, available for editing
GRAB THE BEST PAPER92.7% of users find it useful
Green Consumer Behaviour Analysis
Read Text Preview

Extract of sample "Green Consumer Behaviour Analysis"

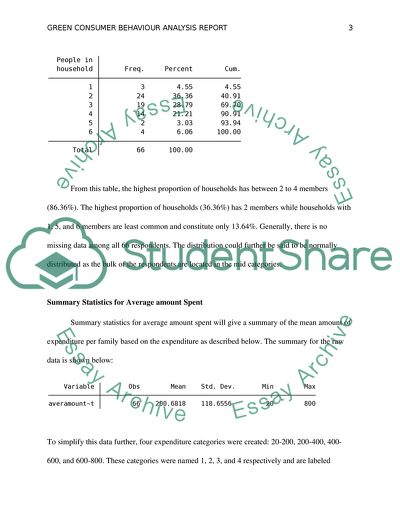
Green Consumer Behaviour Analysis Report Zayed Alzayed The Royal BUSA 205 Moshi Charnell March 28th, Introduction This report will give a summary of findings based on a survey that was conducted earlier. In the survey, 66 respondents were interviewed on various topics ranging from their frequency of purchase of various foodstuffs such as local vegetables, local fruits, organic fruits, organic hot drinks, local fish, organic fish, local processed foods and organic processed foods, among many others. Demographic information such as the number of people in the household, average amount spent and age of respondent were also recorded. This report will present the results of statistical tests conducted to understand how the people interviewed consume “green products.” a. Descriptive Statistics Descriptive statistics will be used to describe the basic features of the data in the study. They provide simple summaries about the sample and the measures. Together with simple graphics analysis, they will form the basis of almost all quantitative analysis of our data. Descriptive statistics help us to simply large amounts of data in a sensible way. Each descriptive statistic reduces lots of data into a simpler summary. Descriptive statistics will be used to make inferences from our data to more general conditions and hence have a general overview of what is going on in our data. Descriptive statistics are as shown below: Summary Statistics for People in Household Summary statistics for people in household will give an overview of the distribution of number of persons per household and hence inform us of the most or least common number of persons per family. From this table, the highest proportion of households has between 2 to 4 members (86.36%). The highest proportion of households (36.36%) has 2 members while households with 1, 5, and 6 members are least common and constitute only 13.64%. Generally, there is no missing data among all 66 respondents. The distribution could further be said to be normally distributed as the bulk of the respondents are located in the mid categories. Summary Statistics for Average amount Spent Summary statistics for average amount spent will give a summary of the mean amount of expenditure per family based on the expenditure as described below. The summary for the raw data is shown below: To simplify this data further, four expenditure categories were created: 20-200, 200-400, 400-600, and 600-800. These categories were named 1, 2, 3, and 4 respectively and are labeled amountspent_cat. This categorization enables us to perform various qualitative analyses on the data. The summary is as shown below: Summary Statistics for Age This section will cover summary statistics on age of the respondents as stated in the data collected. The statistics will give the mean age and the dispersion of respondents’ age from the average (standard deviation). Summary statistics for age are as shown below: From the summary, the mean age of the respondents is 24.1 years. The maximum age is 45 years while the minimum age is 18 years. The standard deviation for age is 5.5 years, implying that the mean deviation of the respondents’ ages from the mean is 5.5 years. No observations are missing. A histogram for age is shown below: Histogram for Age It is seen that most respondents are aged between 18 and around 30 years. Age distribution is also seen to be skewed to the right thus indicating a deviation from normally distributed data. Three categories were created for the different ages: those aged between 18-27, 27-36 and 36-45. These categories are named 1, 2, and 3 respectively and the new variable is known as agecat. Summary statistics for these categories are shown below. It is seen that the largest proportion of respondents were aged 18-27 years. The category accounts for almost 79% of respondents followed by the 27-36 years category with13.64% while the 36-45 year category has 7.58%. Analysis The aim of this analysis is to understand how the people interviewed consume “green products” as compared to organic products. Using statistical techniques, the analysis will reveal the age groups most likely to purchase organic/ “green products.” Methods to be used include cross-tabulation, chi-square tests and tests of proportions. The contingency tables shown below summarize how different age categories purchase local and organic products. Using these tables, it is observed that the frequency of purchase of local fruits and local vegetables is similar, i.e., the bulk of purchases are done on a weekly basis while the proportion of persons who have never bought both products is also similar. However, the proportion of people who have never bought organic fruits is different from those who have bought local fruits as shown below. The frequency of purchase of organic vegetables is almost evenly spread out in all the three categories listed and is almost similar to that of organic fruits. It is evident that the proportion of persons who have never bought organic fruits and organic vegetables is greater than those who have never bought local fruits and local vegetables. This shows a preference for ‘green products.’ Tests of proportions a. Two sample test of proportions for people who have never bought local fruits and organic fruits The test will investigate whether the proportions of people who have never bought local fruits (12/66) and organic fruits (27/66) are different. A two sample test of two proportions: that of people who have never bought local fruits and organic fruits shows that the two proportions are not significantly different (p-value = 0.0042), hence the pattern of consumption of these food products is dissimilar. This shows a preference for ‘green products’. b. Two sample test of proportions for people who have never bought local vegetables and organic vegetables The test will investigate whether the proportions of people who have never bought local vegetables (10/66) and organic vegetables (27/66) are different. A two sample test of two proportions who have never bought local vegetables and organic vegetables shows that the two proportions are not significantly different (p-value = 0.0010), hence the pattern of consumption of these food products is dissimilar. This shows a preference for ‘green products’. Influence of Age on Purchasing Patterns This section will use a chi-square test to investigate whether a relationship exists between purchase of different products and age. However, since we have counts less than 5 in some categories, age will be collapsed into two categories, rather than three, so that the count can be equal to or exceed five (18-22 yrs, 22 - 45 years). From the results, purchase of local fruit is not affected by age (p-value = 0.728) From the results, purchase of organic fruit is not affected by age (p-value = 0.313) From the results, purchase of local vegetables is not affected by age (p-value = 0.803). From the results, purchase of organic vegetables is not affected by age (p-value = 0.431). In all instances, the purchasing decisions and patterns of the three types of foodstuffs are not influenced by age since the p-value obtained is greater that the level of significance (0.05). However, this relationship between organic fruits and age should be investigated further since one cell count is less than 5, hence, Fisher’s exact test can be used in place of the Chi-square test (Cox, 2006). Generally, age does not play a role in the purchase of either ‘green products’ or organic products. Influence of Age on Purchasing Patterns This section will use a chi-square test to investigate whether a relationship exists between purchase of different products and average amount spent. However, since some cell counts are less than five with respect to the categories of amounts spent created earlier, new categories will be created. The results show no relation between amount spent and purchase patterns of organic fruits (p-value= 0.836). The results show no relation between amount spent and purchase patterns of organic fruits (p-value= 0.056). The results show no relation between amount spent and purchase patterns of local vegetables (p-value= 0.574). The results show no relation between amounts spent and purchase patterns of organic vegetables (p-value= 0.506). From this section, it is observed that decisions on the frequency of purchasing the four products: local fruits, local vegetables, organic fruits and organic vegetables are not affected at all by the amount of cash available for making such purchases. Conclusion From the analysis conducted above, it is observed that purchase patterns of local fruits, organic fruits, and local vegetables are independent of both age and average amount of expenditure. Consequently, going back to the research question, it is concluded that out of the 66 persons interviewed, age and average amount spent do not affect purchasing decisions and choices. Hence we conclude that purchasing decisions are independent of these two variables. However, it is observed that the difference in proportions of persons buying local fruits and organic fruits is significant. The same finding is made in the comparison of people who have never bought local vegetables and those who have never bought organic vegetables. This finding can be translated to mean that most people prefer ‘green products’. Consequently, we conclude that since the sample was representative of the whole populations, it can be concluded that there is a general preference for local products as compared to organic products. Reference Cox, D. R. Principles of statistical inference. Cambridge, New York: Cambridge University Press, 2006. Read More
Cite this document
  • APA
  • MLA
  • CHICAGO
(Green Consumer Behaviour Analysis Statistics Project Example | Topics and Well Written Essays - 1500 words - 1, n.d.)
Green Consumer Behaviour Analysis Statistics Project Example | Topics and Well Written Essays - 1500 words - 1. https://studentshare.org/statistics/1798082-statistical-report-on-green-consumer-behaviour
(Green Consumer Behaviour Analysis Statistics Project Example | Topics and Well Written Essays - 1500 Words - 1)
Green Consumer Behaviour Analysis Statistics Project Example | Topics and Well Written Essays - 1500 Words - 1. https://studentshare.org/statistics/1798082-statistical-report-on-green-consumer-behaviour.
“Green Consumer Behaviour Analysis Statistics Project Example | Topics and Well Written Essays - 1500 Words - 1”. https://studentshare.org/statistics/1798082-statistical-report-on-green-consumer-behaviour.
  • Cited: 0 times

CHECK THESE SAMPLES OF Green Consumer Behaviour Analysis

Acquaintance with the Clean Wheels Company

Industry and Market analysis Market Summary: The national market for car wash companies is becoming increasingly competitive as the industry becomes consolidated in major markets and segmented where there are lower population numbers.... Our primary goals to that need to be realized are the acquisition of necessary equipment in order to meet consumer demand utilizing less time, as well we intending on leveraging our customizable service as an added bonus that raises the bar for consumer expectation....
8 Pages (2000 words) Term Paper

Determining Consumer Response to a Companys Effort in Using Sustainable Business Practices

analysis of the data from the survey The result of the survey was an eye opener as well as encouraging.... The information regarding the market's preference, behaviour or response towards a certain product is critical because this will give the company an idea whether to push through with the product or not and if ever it will push through with the product, on how will it position itself in the market that would optimize its success.... Name Class Professor Date Result of the survey about consumer's buying preferences towards technological goods produced using sustainable business practices I....
4 Pages (1000 words) Essay

Kinds of Elasticity of Demand

The concept of elasticity of demand is important in that it s being used by the economists to explain the consumer behaviour in different market conditions.... The traditional theory of demand starts with the examination of the behaviour of the consumer since the market demand is assumed to be the summation of the demands of the individual consumers.... The responsiveness of the demand in relation to the price or income of the consumer is referred as the elasticity of demand....
10 Pages (2500 words) Essay

Research Proposal What attributes of eco-labels are important to consumers

Eco-labels refers to the seals of approval that products that have minimal impact on the environment are given (Leopold Center & Iowa University Business analysis Laboratory, 2004).... Research has shown that information of product quality is very difficult to obtain in the marketing compared to information on prices (Leopold Center & Iowa University Business analysis Laboratory, 2004).... A comprehensive theoretical analysis of the economics of analyzes reveals that some consumers will make purchasing decision based on the eco-labels....
4 Pages (1000 words) Essay

The Strategic Process of Greene King

Source: (Green King Annual Report 2010) The SWOT analysis.... A situation analysis provides us with a lot of information and to keep it manageable and easily understood; the internal factors of the firm are classified as its strengths and weaknesses while the external factors are the opportunities and threats (NetMBA).... Together, it is sorted as a SWOT analysis.... The SWOT analysis of Greene King....  As the consumer behavior in beer consumption changes from pub houses to the home environment, a new target market opens up for Greene King....
4 Pages (1000 words) Essay
sponsored ads
We use cookies to create the best experience for you. Keep on browsing if you are OK with that, or find out how to manage cookies.
Contact Us