StudentShare
Contact Us
Sign In / Sign Up for FREE
Search
Go to advanced search...
Free

The Population Standard Deviation - Assignment Example

Cite this document
Summary
This assignment "The Population Standard Deviation" discusses the population standard deviation, σ that is known, therefore, the selected test is a z-test for a Population Mean. The p-value is p-value (right-tailed) = .0004 {Using Excel Function =1-NORMSDIST(3.354)}…
Download full paper File format: .doc, available for editing
GRAB THE BEST PAPER96.8% of users find it useful
The Population Standard Deviation
Read Text Preview

Extract of sample "The Population Standard Deviation"

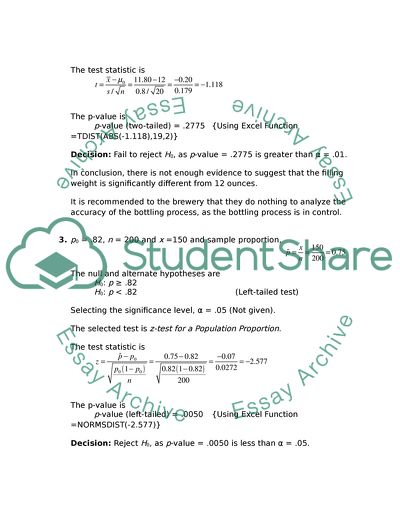
Stat 2300 Summer Exam 2 _________________________ Location_______________________ μ0 = $130 per trip, n = 45, =$135.25 per trip , σ = $10.50 and α = .05 The null and alternate hypotheses are H0: μ ≤ $130 H1: μ > $130 (Right-tailed test) The population standard deviation, σ is known, therefore, the selected test is z-test for a Population Mean. The test statistic is The p-value is p-value (right-tailed) = .0004 {Using Excel Function =1-NORMSDIST(3.354)} Decision: Reject H0, as p-value = .0004 is less than α = .05. In conclusion, there is enough evidence to suggest that the average amount spent at the competitor is higher than at Costco. 2. μ0 = 12 ounces, n = 20, =11.80 ounces, s = 0.8 and α = .01 The null and alternate hypotheses are H0: μ = 12 H1: μ ≠ 12 (Two-tailed test) The population standard deviation, σ is unknown, therefore, the selected test is t-test for a Population Mean. The degrees of freedom are df = n – 1 = 20 – 1= 19 The test statistic is The p-value is p-value (two-tailed) = .2775 {Using Excel Function =TDIST(ABS(-1.118),19,2)} Decision: Fail to reject H0, as p-value = .2775 is greater than α = .01. In conclusion, there is not enough evidence to suggest that the filling weight is significantly different from 12 ounces. It is recommended to the brewery that they do nothing to analyze the accuracy of the bottling process, as the bottling process is in control. 3. p0 = .82, n = 200 and x =150 and sample proportion, The null and alternate hypotheses are H0: p ≥ .82 H0: p < .82 (Left-tailed test) Selecting the significance level, α = .05 (Not given). The selected test is z-test for a Population Proportion. The test statistic is The p-value is p-value (left-tailed) = .0050 {Using Excel Function =NORMSDIST(-2.577)} Decision: Reject H0, as p-value = .0050 is less than α = .05. In conclusion, there is strong evidence (p-value < .01) to suggest that the proportion of teenage drivers in Massachusetts who use a cell phone while driving is less than 82%. 4. σ0 = $300, n = 15, s =$332.45 and α = 0.10 The null and alternate hypotheses are H0: σ2 ≤ 90000 H1: σ2 > 90000 (Right-tailed test) The selected test is Chi-square Variance Test. The degrees of freedom are df = n – 1 = 15 – 1= 14 The test statistic is The p-value is p-value (right-tailed) = .2461 {Using Excel Function ==CHIDIST(17.192,14)} Decision: Fail to reject H0, as p-value = .2461 is greater than α = .10. In conclusion, there is not enough evidence to suggest that the standard deviation is more than $300. Thus, there is no concern about the consistency of business. 5. μ0 = 58.7 years, α = .05 and H0: μ ≤ 58.7 a. Type II error in the context of this problem: Not rejecting the null hypothesis H0: μ ≤ 58.7 when it is false. In other words, suggesting that the average retirement age for French citizen is not more than 58.7 years, in fact it is more than 58.7 years. The impact of making a Type II error is to concluding that the new bill has not raised the average age at which people actually retire. b. σ(assumed) = 5 years, n = 40 and μa = 60.5 years The selected test is one-sided test, therefore, z* = zα = z.05 = 1.645 β = area under the normal curve to the left of β = area under the normal curve to the left of β = 0 .2637 {Using Excel Function =NORMSDIST(-0.632)} The probability of committing a Type II error if the actual retirement age is 60.5 years old is about 0.2637. c. same condition and μa = 61.5 years β = area under the normal curve to the left of β = area under the normal curve to the left of β = 0.0289 {Using Excel Function =NORMSDIST(-1.897)} The probability of committing a Type II error if the actual retirement age is 61.5 years old is about 0.0289. d. β = 0.10 Sample size determination to achieve specified values of α and β Here, zβ is the point on the z-curve that gives a right-hand tail area equal to β. Therefore, zβ = z1-0.10 = z.90 = 1.282 = 67 (rounded up) A sample size of 67 (minimum) should be used if the group is willing to accept a 0.10 probability of making a Type II error when the actual average retirement age is μ = 60.5. 6. First section: = 77.4, s1 = 10.8 and n1 = 18 Second section: = 74.1, s1 = 12.2 and n1 = 14 a. α = .05 The null and alternate hypotheses are (Two-tailed test) The selected test is F-test for Equality of Variance. The degrees of freedom are Numerator, df1 = n1 – 1 = 18 – 1= 17 Denominator, df2 = n2 – 1 = 14 – 1= 13 The test statistic is The p-value is p-value (two-tailed) = .6274 {Using Excel Function =2*(1-FDIST(0.784,17,13))} Decision: Fail to reject H0, as p-value = .6274 is greater than α = .05. In conclusion, there is not enough evidence to suggest that there is a difference in the variance between the scores of the two groups. b. α = .05 The null and alternate hypotheses are (Two-tailed test) The selected test is t-Test for Difference in Means Assuming Equal Variances. This is because the results of hypothesis test in part a suggested that there is no difference in the variance between the scores of the two groups. The degrees of freedom are df = n1 + n2 – 2 = 18 + 14 – 2 = 30 The pooled variance is The test statistic is The p-value is p-value (two-tailed) = .4241 {Using Excel Function =TDIST(ABS(0.810),30,2)} Decision: Fail to reject H0, as p-value = .4241 is greater than α = .05. In conclusion, there is not enough evidence to suggest that there is a difference in the mean between the scores of the two groups. 7. The sample mean and sample standard deviation for difference in weight for participants before and after the diet program are Weight Before Weight After d = Before – After d2 158 151 7 49 205 200 5 25 170 169 1 1 189 179 10 100 149 144 5 25 135 129 6 36 = 34 = 236 D0 = 5 pounds and α = 0.05 The null and alternate hypotheses are H0: μd ≤ 5 H1: μd > 5 (Right-tailed test) The selected test is Paired t-Test. The degrees of freedom are df = n – 1 = 6 – 1= 5 The test statistic is The p-value is p-value (right-tailed) = .3015 {Using Excel Function =TDIST(ABS(0.555),5,1)} Decision: Fail to reject H0, as p-value = .3015 is greater than α = 0.05. In conclusion, there is not enough evidence to suggest that the participants in diet center’s weight loss program lose more than 5 pounds within a month. Therefore, the diet center’s claim that it has the most effective weight loss program in the region is not correct. 8. Recent: x1 = 67 and n1 = 150 Three years ago: x2 = 58 and n2 = 140 α = 0.01 An estimate of is The null and alternate hypotheses are (Right-tailed test) The selected test is Large sample z-Test for Difference in Proportions. The test statistic is The p-value is p-value (right-tailed) = .2890 {Using Excel Function =1-NORMSDIST(0.556)} Decision: Fail to reject H0, as p-value = .2890 is greater than α = 0.01. In conclusion, there is not sufficient evidence to suggest that more people are now using LinkedIn to search for jobs as compared to three years ago. Read More
Cite this document
  • APA
  • MLA
  • CHICAGO
(The Population Standard Deviation Assignment Example | Topics and Well Written Essays - 1250 words - 1, n.d.)
The Population Standard Deviation Assignment Example | Topics and Well Written Essays - 1250 words - 1. https://studentshare.org/statistics/1778210-exam-2
(The Population Standard Deviation Assignment Example | Topics and Well Written Essays - 1250 Words - 1)
The Population Standard Deviation Assignment Example | Topics and Well Written Essays - 1250 Words - 1. https://studentshare.org/statistics/1778210-exam-2.
“The Population Standard Deviation Assignment Example | Topics and Well Written Essays - 1250 Words - 1”. https://studentshare.org/statistics/1778210-exam-2.
  • Cited: 0 times

CHECK THESE SAMPLES OF The Population Standard Deviation

T-test and Degree of Freedom

nbsp;… It is evidently clear from the discussion that a z-test is used to compare population mean with a standard or for comparing the means of two populations when The Population Standard Deviation is known.... A t-test is used to compare population mean with a standard or for comparing the means of two populations when The Population Standard Deviation is unknown.... In such cases, population standard deviation is unknown; therefore, z-test cannot be used....
1 Pages (250 words) Assignment

The Use of Probability in Inferential Statistics

Based on sample data and assumptions on the population distribution, inferences are… The most conventional or usual assumptions on population distribution are the standard normal, t-distribution, and the chi-square distribution. Using assumptions on how variable values are distributed in Statistics use assumption on population distribution to estimate population values based on sample values (Kemp & Kemp 257-66).... For example, in estimating the population mean, it is assumed that the sample mean converge to the population mean through repetition of sampling procedures or if the population is large....
6 Pages (1500 words) Term Paper

School Attending and Academic Performance Hypothesis Testing

The Population Standard Deviation is 28.... the population mean (μ) for students from public high schools is 75.... the population mean (μ) for students from public high schools is 75.... What should the researcher conclude about this relationship in the population?...
2 Pages (500 words) Essay

Hypothesis Testing Procedures

This is then used to estimate The Population Standard Deviation towards generating the required standard error (Mendenhall, Beaver and Beaver, 2009).... For an unknown population standard deviation, a researcher develops a two-sided hypothesis and applies a sample standard deviation to estimate The Population Standard Deviation towards determining the standard error.... Established significance calls for consideration of a hypothesized association in decision making while absence of significance means that the… When engaging in hypothesis testing procedures for the population with known standard deviation, a researcher needs to consider the involved standard error....
1 Pages (250 words) Essay

Power Analysis as a Useful Tool

hellip; The class derivation method of computing the standard deviation is similar to computing the variance.... The only difference is that in the standard deviation there is an extraction of the square root.... The paper "Power Analysis as a Useful Tool" highlights that testing a hypothesis made about several population proportions are sometimes considered....
6 Pages (1500 words) Coursework

The Statistics

Increase the difference between the sample mean and the population means.... Assume that the population average score on this scale is μ = 20.... Several factors influence the value obtained for a t Some factors affect the numerator of the t statistic, and other factors influence the size of the estimated standard error in the denominator.... Are the data sufficient to conclude that the people in this sample are significantly more satisfied than others in the general population?...
10 Pages (2500 words) Essay

Introduction to Statistics Exam

nbsp;An 80% confidence interval for The Population Standard Deviation (σ) of glove use per week is = 4.... he normal distribution will be used for the test, as population standard deviation is known.... An 80% confidence interval for the population mean use (μ) per week is = 19.... Therefore, an 80% confidence interval for the population variance (σ2) of glove use per week is = 16.... nbsp;A sample of at least 1867 bottled water drinks should be selected to estimate the population proportion that violates at least one government standard to within a margin of error of 0....
6 Pages (1500 words) Assignment
sponsored ads
We use cookies to create the best experience for you. Keep on browsing if you are OK with that, or find out how to manage cookies.
Contact Us