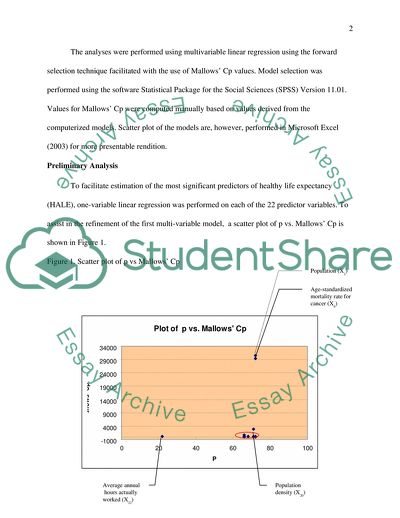
StudentShare
Contact Us
Sign In / Sign Up for FREE
Search
Go to advanced search...
Free

Statistical Estimation of Healthy Life Expectancy - Research Paper Example

Cite this document
Summary
This paper "Statistical Estimation of Healthy Life Expectancy" attempted to analyze whether or not US expenditures on health translate to higher healthy life expectancy for its population, and thus verify efficient spending in comparison with other countries worldwide. …
Download full paper File format: .doc, available for editing
GRAB THE BEST PAPER92.5% of users find it useful
Statistical Estimation of Healthy Life Expectancy
Read Text Preview

Extract of sample "Statistical Estimation of Healthy Life Expectancy"

Statistical Estimation of Healthy Life Expectancy Introduction This paper attempted to analyze whether or not US expenditures on health translate to higher healthy life expectancy for its population, and thus verify efficient spending in comparison with other countries worldwide. The investigation is carried further by evaluating factors other than government spending, which affect healthy life expectancy. The dataset was sourced out from the websites of the World Health Organization, Organization for Economic Co-operation and Development and the Yale University. A total of 25 variable were included in the dataset and these are presented in Table 1. Table 1. Variables included in the dataset analyzed Symbol used in the paper Complete variable designation Variable Type Y1 Y2 Y3 Healthy life expectancy at birth for both sexes Healthy life expectancy at birth for females Healthy life expectancy at birth for males Dependent (Response) Variable X1 X2 X3 X4 X5 X6 X7 X8 X9 X10 X11 X12 X13 X14 X15 X16 X17 X18 X19 X20 X21 X22 Gross national income per capita Population in thousands Population median age in years Births attended by skilled health personnel General government expenditure on health as % of total on health General government expenditure on health as % of total expenditure Hospital beds per 10,000 population Physician density per 10,000 population Age-standardized mortality rate for cancer Deaths due to HIV/AIDS per 100,000 population per year Infant mortality rate per 1,000 live births for both sexes Infant mortality rate per 1,000 live births for females Infant mortality rate per 1,000 live births for males Per capital recorded alcohol consumption among adults (15 years & above) Population with sustainable access to improved drinking water sources (%) Population with sustainable access to improved sanitation (%) Prevalence of current tobacco use among adults 15 year & above (%) both Prevalence of current tobacco use among adults 15 year & above (%) fem. Prevalence of current tobacco use among adults 15 year & above (%) male Population density Environmental index Average annual hours actually worked Predictor Variables The analyses were performed using multivariable linear regression using the forward selection technique facilitated with the use of Mallows’ Cp values. Model selection was performed using the software Statistical Package for the Social Sciences (SPSS) Version 11.01. Values for Mallows’ Cp were computed manually based on values derived from the computerized models. Scatter plot of the models are, however, performed in Microsoft Excel (2003) for more presentable rendition. Preliminary Analysis To facilitate estimation of the most significant predictors of healthy life expectancy (HALE), one-variable linear regression was performed on each of the 22 predictor variables. To assist in the refinement of the first multi-variable model, a scatter plot of p vs. Mallows’ Cp is shown in Figure 1. Figure 1. Scatter plot of p vs Mallows’ Cp It may be gleaned from the scatter plot in Figure 1 that four predictor variables X2, X9, X20, and X22 are outliers, while the rest of the other predictor variables were concentrated in the area on the plot encircled in red. Modeling and Analysis The predictors were divided into three blocks: (1) block 1 variables consist of those assumed from the results of the one-variable regression models which can most significantly predict HALE; (2) block 2 variables were those assumed to be moderate predictors of HALE; and (3) block 3 variables were those assumed to be least significant predictors of HALE. Criteria used in grouping the results of the one-variable regression models were: (1) computed values of Mallows’ Cp which most closely approached the value of p; (2) coefficient of determination (R2), delimited to those capable of predicting the variance in HALE by at least 50% (R = > 0.500); (3) highly correlated, based on the Pearson correlation coefficient (0.70 < r < 1.00); and (4) values of the sum of squares of the residuals are to be less than the squares of the regression. Based on this criteria and the one-variable regressions, block 1 variables include X1, X3, X4, X5, X6, X10, X11, X12, X13, X15, X16, and X21. Variables X6 and X5, were included as block 1 variables because they are general government expenditures as a percentage of the health expenditures, and as a percentage of the total government expenditures, respectively (or columns H and G in the MS Excel dataset). Since these are the major variables being analyzed, they were assumed to be significant. Block 2 variables include X2, X7, X8, X14, X17, X18, and X19, which consist of those with low values of Mallows’ Cp, but have R2 lower than 0.500 and r less tha 0.70. The rest of the 22 predictor variables were grouped under block 3: X2, X9, X20, and X22, which were actually the outliers in the scatter plot from Figure 1 . In creating the full model, one of the outliers, average annual hours actually worked (X22) was deliberately excluded because only 22 of the 72 countries in the dataset have values for this variable. The full model, referred to in this paper hereon as Model A, from the complete dataset (response variable Y1 and all the predictor variables) was evaluated using the three groups of variables in the aforementioned discussion. A screenshot of the model summary is shown in Figure 2. Figure 2. Model A summary (Full Model) The multiple regression procedure for all the 22 predictor variables came out the model summary shown above with the sixth and last model as the best with a multiple regression coefficient (R) of 0.966 and a coefficient of determination (R2) of 0.933. A value of R = 0.966 indicates that the 6 predictors in Model 6 of the Full Model A are highly correlated and the relationship is dependable. Meanwhile, a value of R2 = 0.933 suggests that the 93.3 % of the variance in the response variable or the dependent variable, healthy life expectancy can be explained by the 6 predictors included in this model. The Durbin-Watson estimate of 1.858, which approximates 2, implies that the model does not have collinearity issues. In equation form, Model 6 (from Model Set A – Full Model) may be expressed as: Y1 = -0.196 X11 + 2.292 x 10-4 X1 – 1.901 X10 – 6.79 x 10-2 X5 + 0.182 X21 + 3.101 x 10-2 X20 + 56.463. The value of Mallow’s Cp is computed using the following formula (Heckert par. 5; Izenman 146; Varmuza and Filzmoser 115) : Cp = RSSp + 2p – n δ2 where : RSSp = sum of squares of the residuals using p variables δ2 = variance of the residual from the full model n = number of observations; and p = number of variables in the regression A multivariable regression model is adjudged satisfactory if the computed value of Mallows’ Cp approximates the value of p. For Model 6 from the Full Model A, Cp = (286.745) + 2(22) – 53 (2.719)2 Cp = 13.786 Since the value of Cp is nowhere near p (which is 22), it may be concluded that the model is not yet satisfactory. The model may not yet be considered a good model fit because it still has errors which caused the large deviation from 22 or an absolute difference of 8.214, the ideal value in this case. Hence, there is further need to refine the model. Of the four outliers, only population density proved to be a significant predictor from the full model. The remaining three outliers is excluded in the next model. gross national income per capita (X1), general government expenditure on health as % of total expenditure on health (X5), deaths due to HIV/AIDS per 100,000 population (X10), infant mortality rate per 1,000 live births for both sexes (X11), population density (X20) and environmental index (X21) The screenshot of the model summary of the second model selection scheme for Model B is shown in Figure 3. Figure 3. Model B summary As shown in the model summary for Model B from Figure 3, the second of the two multiple-variable regression models, Model 2, generated a multiple regression coefficient (R) of 0.967 and a coefficient of determination (R2) of 0.935. A value of R = 0.967suggests that the 5 predictors in Model 2 of the Model B are highly correlated and the relationship is dependable. Meanwhile, a value of R2 = 0.935 suggests that the 93.5 % of the variance in the response variable or the dependent variable, healthy life expectancy can be explained by the 5 predictors included in this model. The Durbin-Watson estimate of 1.886, which nearly approximates 2, indicates that the model does not have a problem with respect to collinearity. In terms of R, R2 and collinearity, Model 2 (from Model Set B) improved slightly from Model 6 (from Model A). In equation form, Model 2 (from Model Set B) may be expressed as: Y1 = 2.081 x 10-4 X1 – 2.264 X10 - 0.163 X11 + 2.554 x 10-2 X20 + 0.150 X21 + 55.669 However, based from the formula in page 5, Mallows Cp for this model is equal to 10.98, implying that there is lesser errors in this model than in the previous model, with an absolute difference of 4.98. The model selection process, thus continues. From the previous model, it was observed that the t-statistic for population density is not significant, hence, it will be excluded in the next model, while the rest of these same predictors will still be included. It was also observed that an important variable, general government expenditure on health as % of total expenditure on health (X5), was deleted from the model. This will, therefore be included in the next refinement of the model, via the enter variable technique. Figure 4 shows the model summary for Model C. Figure 4. Model C summary As shown in the model summary for Model Set C from Figure 4, the last of the four multiple-variable regression models, Model 4, generated a multiple regression coefficient (R) of 0.938 and a coefficient of determination (R2) of 0.881. The Durbin-Watson estimate of 1.470, is not too far away from 2, which indicates that the model does not have a big issue regarding multi-collinearity. In terms of R, R2 and collinearity, Model 4 (from Model Set C) regressed slightly from Model 2 (from Mode Set B). However, based from the formula in page 5, Mallows Cp for this model is equal to 6.998, implying that there is lesser error in this model than in the previous model, with an absolute difference of 2.998. The next model is the best fit for the data set. Figure 5 presents the SPSS screen shot of the model summary for the best fit model. Figure 5. Best fit model summary As shown in the model summary for best model fit from Figure 5, the last of the three multiple-variable regression models, Model 3, generated a multiple regression coefficient (R) of 0.955 and a coefficient of determination (R2) of 0.912. The Durbin-Watson estimate of 1.759 very nearly approaches 2, which indicates that the model does not have multi-collinearity issues. Furthermore, based from the formula in page 5, Mallows Cp for this model is equal to 7.217, implying almost negligible error in the model, with an absolute difference of only 0.217 from the desirable value which should approximate p (7 in this model). The Best Model The best model is defined by the multiple regression equation below: Y1 = 0.442 X3 – 7.45 x 10-2 X7 – 2.165 X10 – 0.159 X11 + 8.287 x 10-2 X16 + 53.192 The most significant predictors of healthy life expectancy at birth are : population median age in years (X3), hospital beds per 10,000 population (X7), population with sustainable access to improved sanitation as a percentage of the total population (X10), infant mortality rate per 1,000 live births for both sexes (X11), and deaths due to HIV/AIDS per 100,000 population per year (X11). Each of the significant predictors for healthy life expectancy at birth were checked for normality using the Q-Q plot from SPSS. Results are shown in Figures 6 to 11. All the predictors were verified to be normally distributed. Figures 6 and 7. QQ plots for median age in years and hospital beds per 10,000 Figures 8, 9, and 10. Q-Q plots for births attended by skilled health personnel, population with sustainable access to improved sanitation, and infant mortality rate Figure 11. Q-Q plot of death due to HIV/AIDS per 100,000 population per year Healthy life expectancy and government spending General government expenditure on health was not found to be a significant predictor of healthy life expectancy at birth, but the two variables have a significant relationship. This was verified using correlation analysis. Figure 12 presents the screenshot of the output from the analysis using SPSS Figure 12. Descriptive statistics for government expenditures and healthy life expectancy at birth Descriptively, the mean of the government expenditures on health based on 72 countries included in the dataset analyzed is 59.93 percent of the total global expenditures on health. The United States spends 45.8% - indicative that health expenditures of the American government on health is even below the global average, considering that it is a comparatively big country. Looking at the average worldwide healthy life expectancy of 61.56, the figures for the US are way higher than the global mean at 69. Hence, it may safety be concluded that the American government spends wisely on health matters, considering that its spends well within the average and yet manages to generate a higher than average healthy life expectancy. Figure 13 showcases the results of the correlation analysis for healthy life expectancy and government expenditures on health. Figure 13. SPSS output of the correlation analysis Based on the results of the correlation analysis, healthy life expectancy at birth has a substantial relationship with general government expenditures on health, as indicated by a correlation coefficient of 0.482 from the results shown in Figure 13. The coefficient of correlation was interpreted using Table 2. The correlation analysis also revealed that the substantial relationship is significant based on a non-directional analysis (two-tailed) and a hypothesized level of significance of 0.05. The observed level of significance of the correlation is shown in Figure 12 as 0.000. In SPSS, a level of significance (sig.) or p-value of 0.000 actually means less than 0.001. Hence since the observed level of significance (0.001) is less than the hypothesized level of significance (0.05), healthy life expectancy at birth has a significant substantial relationship with general government expenditures on health. Also the positive value of the correlation coefficient implies that as government expenditures on health increase, healthy life expectancy at birth substantially increases. Table 2. Interpretation of the correlation coefficient (Monzon-Ybañez, 1993) Range of Coefficient of Pearson Correlation Qualitative Interpretation 0.00 to ± 0.20 Slight correlation; almost negligible relationship ± 0.20 to ± 0.40 Low correlation; small relationship ± 0.40 to ± 0.70 Moderate correlation; relationship substantial ± 0.70 to ± 0.90 High correlation; marked relationship ± 0.90 to ± 1.00 Very high correlation; very dependable relationship Works Cited Heckert, Alan. Data Plot. 4 April 2003. National Institute of Standards and Technology. 5 June 2009 http://www.itl.nist.gov/div898/software/dataplot/refman1/auxillar/bestcp.htm Izenman, Alan Julian. Modern Multivariate Statistical Techniques: Regression, Classification and Manifold Learning. New York: Springer Science+Business Media, LLC, 2008. Monzon-Ybañez, Lydia. Basic Statistics. Quezon City: Phoenix Publishing House, Inc, 1993. Varmusa, Kurt and Peter Filzmozer. Introduction to Multivariate Statistical Analysis in Chemometrics. Boca Raton: CRC Press, 2009. Read More
Cite this document
  • APA
  • MLA
  • CHICAGO
(Statistical Estimation of Healthy Life Expectancy Research Paper, n.d.)
Statistical Estimation of Healthy Life Expectancy Research Paper. https://studentshare.org/statistics/1724751-statistic-project
(Statistical Estimation of Healthy Life Expectancy Research Paper)
Statistical Estimation of Healthy Life Expectancy Research Paper. https://studentshare.org/statistics/1724751-statistic-project.
“Statistical Estimation of Healthy Life Expectancy Research Paper”. https://studentshare.org/statistics/1724751-statistic-project.
  • Cited: 0 times

CHECK THESE SAMPLES OF Statistical Estimation of Healthy Life Expectancy

Community Assessment: Danville Kentucky, Boyle County

Although Danville is a relatively small city, it is the main city in the statistical area and has been famous for its historical status as well as the serene atmosphere which makes it a popular destination for retirees.... This research is a community assessment project that is aimed at identifying important and significant pointers of a given community in relation to major pointers and indicators about health and social wellbeing....
21 Pages (5250 words) Research Paper

Community Dataform

Instructor: Clayton State University School of Nursing Health Illness Transitions II -NURS 3701 COMMUNITY DATAFORM NAME: COMMUNITY: DEMOGRAPHICS Population by AGE for years You can change years according to most recent available data.... hellip; Remember to compare using percentage not numbers....
6 Pages (1500 words) Research Paper

How Statistics Is Applied in Our Everyday Life and Why It Is Useful

This paper “How Statistics Is Applied in Our Everyday life and Why It Is Useful” talks about the effectiveness of statistical analysis in different areas of everyday life and analyzes if the statistics can tell us trends on what happened in the past and predict what will happen in the future.... hellip; We are daily subjected to statistical data in the media, journals and other forms of mass communication.... When interpreted correctly, these statistical data have a significant meaning about a phenomenon that affects our lives....
7 Pages (1750 words) Coursework

Understanding Causal Factors Attributing to Risk in Epidemiology

Understanding Risk and Causal Factors Attributing to Risk In Epidemiology The student was concerned about the concept of relative risk.... Risks in epidemiology help to compare disease or events outcome.... The various types of risks that are analyzed in epidemiology are: Risk Difference: also known as excess risk is defined as the difference in rates of occurrence between exposed and non exposed groups in the population and is a useful measure of the extent of public health problem caused by the exposure....
13 Pages (3250 words) Assignment

The Issues of Aging and Health as the Biggest of Them

Almost all countries mainly developed, like Australia, Japan and The United States of America, that have managed to increase their life expectancy rate by effective public health strategies are either presently suffering from this problem or anticipating future concerns over this issue.... If steps are not taken right now, then, in future, the standard of living and life expectancy rate will fall greatly.... It talks about the importance of precautionary healthcare, options available near the end of life and issues regarding those....
8 Pages (2000 words) Essay

The population of Kenya

From the essay "The population of Kenya" it is clear that stable reduction in population growth will reduce environmental problems.... Agricultural activities will be more sustainable as people ensure that water catchment areas are protected.... In addition, illegal poaching will be reduced.... hellip; Kenya is located in the eastern part of Africa covering an area of 582,650 square kilometers which is equal to 224,962 square miles....
7 Pages (1750 words) Research Paper

The Most Common Transmission Categories of HIV and AIDS

life expectancy in this state is 55 years.... Whatever we can do, let's forge ahead together and ensure a healthy nation by embracing preventive health and caring for those already infected.... Source:  For US, Health United States, statistical Abstract of the US, [will need several years], MMWR, Prevention Profile.... statistical indicators can also be used to reveal the performance issues of the health facility....
5 Pages (1250 words) Research Paper

Healthy Country, Healthy People by Christopher

We are told through (The health and welfare of Australia's Aboriginal and Torres Strait Islander peoples 2005) that their life expectancy is below the normal Australian average.... The article of healthy country, healthy people: the relationship between indigenous health status and caring for the country is a report written by Christopher in the year 2009.... The article of healthy Country, healthy people: The relationship between Indigenous health status and “caring for the country....
9 Pages (2250 words) Article
sponsored ads
We use cookies to create the best experience for you. Keep on browsing if you are OK with that, or find out how to manage cookies.
Contact Us