StudentShare
Contact Us
Sign In / Sign Up for FREE
Search
Go to advanced search...
Free

Distribution of a Variable - Essay Example

Cite this document
Summary
The paper "Distribution of a Variable" tells us about a variable is a description of the relative number of times each possible outcome will occur in a number of trials. Categorical variables should be displayed using pie charts or bar graphs…
Download full paper File format: .doc, available for editing
GRAB THE BEST PAPER91.4% of users find it useful
Distribution of a Variable
Read Text Preview

Extract of sample "Distribution of a Variable"

  1. What does the distribution of a variable (or data set) refer to?

It refers to the way its values are spread over all possible values

  1. Wbat is the Mean of a data set, and how would you calculate it?

It refers to the average value of the dataset

  1. What is the median of a data set, and how do you calculate it?

Refers to the middle value in the sorted data set. It is obtained by sorting the data and getting the middle term if number values is odd and averaging middle values if the number of values is even

  1. What is the mode of a data set, and how do you calculate it?

Refers to the most common value or a group of values in a distribution

  1. What is an outlier in a data set?

An outlier is a data value that is much higher or much lower than almost all of the other values

  1. What measures of central tendency does an outlier effect?

The mean

  1. What is average confusion?

Confusion of the exact mean caused by presence of outliers in a given data set

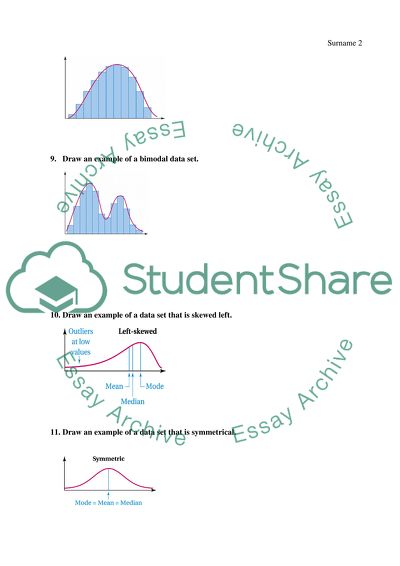
  1. Draw an example of single mode data set.
  1. Draw an example of a bimodal data set.
  1. Draw an example of a data set that is skewed left.
  2. Draw an example of a data set that is symmetrical.
  1. When does the median represent a data set better than the mean?

When there are many outliers

Chapter 6 section B

  1. What is the range of a set of data?

Refers to the difference between the highest and the lowest data values of a given data set

  1. What is another name for the lower quartile?

The first quartile

  1. What is the lower quartile?

It divides the lower fourth of the data set from the upper three fourths

  1. What are the other two names for the middle quartile?

The median, the second quartile

  1. What is the middle quartile?

It refers to the overall median term of a given data set

  1. What is another name for the upper quartile?

Third quartile

  1. What is the upper quartile?

It is the median of the data values in the upper half of a data set

  1. What is the 5 number summary of a set of data?

low value, lower quartile, median, upper quartile, high value

  1. What is a box plot?

Refers to  plot that shows the five number summary visually with a rectangular box enclosing the lower and upper quartiles, a line marking the median and whiskers extending to the minimum and maximum values.

  1. The term standard deviation sounds really scary, but it is not really a horrible monster what is it a measure of?

It is a measure of spread or variation

  1. What is the formula we use to find the standard deviation of a set of data?
  2. What is the range rule of thumb?

It is the relationship between the standard deviation and the range given by

  1. How do we use the standard deviation to estimate the high and low values of a data set?

Chapter 6 Section C

  1. What does the phrase normal distribution refer to?

Refers to symmetric, bell-shaped distribution with a single peak. Its peak corresponds to the mean, median, and the mode of the distribution.

  1. What criteria does a set of data need to have for it to likely be a normal distribution?

Most data values are clustered near the mean, giving the distribution a well-defined single peak.

Data values are spread evenly around the mean, making the distribution symmetric.

Larger deviations from the mean are increasingly rare, producing the tapering tails of the distribution.

Individual data values result from a combination of many different factors

  1. Explain the 68-95-99.7 rule.

About 68% of the data points fall within 1 standard deviation of the mean, about 95% data points fall within 2 standard deviation points of the mean and about 99.7% of the data points fall within 3 standard deviation points of the mean.

  1. What is another name for a standard score?

z-sore

  1. What is a standard score a measure of?

It is a measure of the standard deviations above or below the mean.

  1. How do you calculate a standard score?
  2. What is a percentile (or percentile score) of a data value?

Refers to the percentage of all data values in a data set that are less than or equal to it

  1. What does a percentile score of 23 mean?

A score of 80.23 percentile means that that score is better than 80.23% of all the scores.

Read More
Cite this document
  • APA
  • MLA
  • CHICAGO
(“Data Set Essay Example | Topics and Well Written Essays - 500 words”, n.d.)
Data Set Essay Example | Topics and Well Written Essays - 500 words. Retrieved from https://studentshare.org/statistics/1701560-data-set
(Data Set Essay Example | Topics and Well Written Essays - 500 Words)
Data Set Essay Example | Topics and Well Written Essays - 500 Words. https://studentshare.org/statistics/1701560-data-set.
“Data Set Essay Example | Topics and Well Written Essays - 500 Words”, n.d. https://studentshare.org/statistics/1701560-data-set.
  • Cited: 0 times

CHECK THESE SAMPLES OF Distribution of a Variable

Quantitative Methods of Television

iscrete distribution is concerned with the Distribution of a Variable that is countable or finite.... This essay "Quantitative Methods of Television" focuses on the appropriate method of presenting the categorical data which is a Frequency table along with a bar chart or pie chart whereas the appropriate method of representing numerical data is using Descriptive Statistics and histograms....
12 Pages (3000 words) Essay

Introduction to SPSS Exercise

Skewness is the measure of the extent to which the distribution of the data leans to one side of the mean.... The histogram shows the graphical distribution of the data.... The distribution of data in our Variable2 is right-skewed since the mean is greater than median and the median is greater than the mode as confirmed through the value of skewness being -0.... List of Tables Table Descriptive Statistics of variable 3 Table 2 Descriptive Statistics of variable 2 5 List of Figures Figure Histogram of variable 1 4 Figure 2: Histogram of variable 2 5 Figure 3: Scatter Plot Between variable 1 and variable 2 6 SPSS Exercise SPSS, developed by IBM and officially known as IBM SPSS Software, is statistical software used for predictive analysis....
2 Pages (500 words) Essay

Variables and Distribution Questions

Is the aspirin produced by a particular pharmaceutical company better than that of a competitor at relieving headaches?... Which of the following would best be used to study this: 1) a case-controlled observation; 2) an observation; 3) a double-blind experimental procedure; and.... ... ... A double-blind experimental procedure would be best used to study this because the identities of the product (Aspirin and competitor equivalent brand) should be concealed....
2 Pages (500 words) Speech or Presentation

Fundamentals of Hypothesis Designing and Testing

This process is termed hypothesis testing and is one of two main areas of Definition: A statistical hypothesis is an assertion regarding the Distribution of a Variable or variables.... If a statistical hypothesis completely specifies the distribution, it is referred to as a simple hypothesis; if not, it is referred to as a composite hypothesis (Goodman, 1999).... he calculated test statistic is compared to the sampling distribution that the statistic would have if the null hypothesis was factual....
4 Pages (1000 words) Essay

The Utility of the Normal Distribution

oreover, a random variable is normally produced by prevailing linearly combining massive well-behaved random variables that are applicable in physics.... The paper "The Utility of the Normal distribution" states that normal distribution, also known as Gaussian distribution, is usually observed and utilized as the commencing position of modelling numerous natural processes.... The immediate consequence of the global boundedness is mainly the invariant measure of the state space that represents a normal distribution....
5 Pages (1250 words) Research Paper

Presenting the Categorical Data

The sampling distribution is a distribution of the sample measures where the sample of size n is drawn out of a population of size N.... If any random sample of size n is taken from a normal population of size N, then the sample mean is x and the distribution of sample mean is having expected value μ and variance σ2/n....
12 Pages (3000 words) Dissertation

The Standard Error of the Sample

6 standard errors of the mean for a normal distribution.... This paper "The Standard Error of the Sample" tells that it is essential to consider the standard error when looking at sample size.... Standard error plays the role of indicating the reliability of mean.... The standard error is small; it means that the sample mean accurately reflects the population norm....
7 Pages (1750 words) Assignment

Razor Products in the Market

The paper "Razor Products in the Market" is an outstanding example of a marketing case study.... Survey data usually provide great insight into the underlying characteristics of the population of interest.... .... ... ... The paper "Razor Products in the Market" is an outstanding example of a marketing case study....
11 Pages (2750 words) Case Study
sponsored ads
We use cookies to create the best experience for you. Keep on browsing if you are OK with that, or find out how to manage cookies.
Contact Us