StudentShare
Contact Us
Sign In / Sign Up for FREE
Search
Go to advanced search...
Free

Data analysis and discussion - Essay Example

Cite this document
Summary
A total of 35 participants gave responses on different questions or baseline variables. For question 1, part A and B had a total mean of 1.20 whereby part A had 28 responses out of 35 and B had 7 responses out of 35. This implies that all the…
Download full paper File format: .doc, available for editing
GRAB THE BEST PAPER91.4% of users find it useful
Data analysis and discussion
Read Text Preview

Extract of sample "Data analysis and discussion"

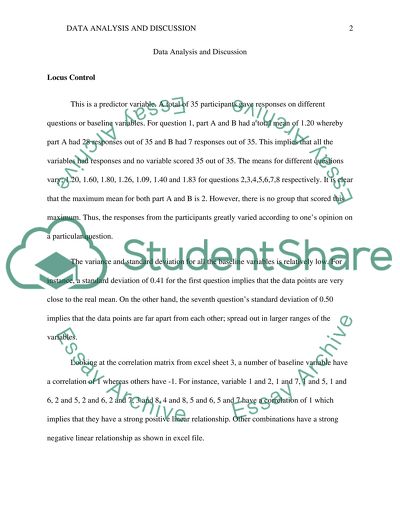
Data Analysis and Discussion al Affiliation: Data Analysis and Discussion Locus Control This is a predictor variable. A total of 35 participants gave responses on different questions or baseline variables. For question 1, part A and B had a total mean of 1.20 whereby part A had 28 responses out of 35 and B had 7 responses out of 35. This implies that all the variables had responses and no variable scored 35 out of 35. The means for different questions vary; 1.20, 1.60, 1.80, 1.26, 1.09, 1.40 and 1.

83 for questions 2,3,4,5,6,7,8 respectively. It is clear that the maximum mean for both part A and B is 2. However, there is no group that scored this maximum. Thus, the responses from the participants greatly varied according to one’s opinion on a particular question. The variance and standard deviation for all the baseline variables is relatively low. For instance, a standard deviation of 0.41 for the first question implies that the data points are very close to the real mean. On the other hand, the seventh question’s standard deviation of 0.

50 implies that the data points are far apart from each other; spread out in larger ranges of the variables.Looking at the correlation matrix from excel sheet 3, a number of baseline variable have a correlation of 1 whereas others have -1. For instance, variable 1 and 2, 1 and 7, 1 and 5, 1 and 6, 2 and 5, 2 and 6, 2 and 7, 3 and 8, 4 and 8, 5 and 6, 5 and 7 have a correlation of 1 which implies that they have a strong positive linear relationship. Other combinations have a strong negative linear relationship as shown in excel file.

The alpha coefficient is 0.97772. This implies that the items in locus control have a high internal consistency and are linked to student’s performance.t-valueQ1Q2Q3Q4Q5Q6Q7Q8Q1 Q2Q30.50.5Q400-2Q59.59.50.416667-0.10526Q66.256.250.6111110.163.833333Q7220-0.52.41.636364Q8-0.04545-0.04545-1.875-22-0.150.115385-0.53333. Self-EfficacyIt has six questions or variables that seek to know the level of self-efficacy on students’ performance. Just like locus control, this was done on 35 participants (students) who gave different responses for the baseline variables; as shown by their means: 6.43, 6.66, 6.51, 1.97, 6.40 and 6.29 for question 1, 2, 3, 4, 5 and 6 respectively.

The standard deviation for the second variable is 0.48 implying that the data points in this baseline variable are close to the mean. The highest standard deviation is 1.25 for the fourth baseline variable. This shows that the data points for this variable are far from the mean.From the excel sheet 3, the correlation coefficient differ greatly. For instance, baseline variable 1 and 2 have a correlation of 1 which shows that they have a strong positive correlation. Variable 2 and 8 have a strong negative relationship, a correlation of -0.96782. Self-efficacy has an alpha coefficient of 0.

940131which imply that the items here have a high internal consistency and are linked to the performance of students.t-valuesStrongly DisagreeDisagreeSlightly DisagreeNeitherSlightly AgreeAgreeStrongly AgreeStrongly DisagreeDisagree1Slightly Disagree11Neither0.8416050.8027020.614295Slightly Agree0.110838-0.06608-0.73869-2.80306Agree-1.94743-2.33637-3.52971-5.94763-5.70088Strongly Agree-2.3585-2.67274-3.51406-4.78239-4.4125-3.02372

Read More
Cite this document
  • APA
  • MLA
  • CHICAGO
(“Data analysis and discussion Essay Example | Topics and Well Written Essays - 500 words”, n.d.)
Data analysis and discussion Essay Example | Topics and Well Written Essays - 500 words. Retrieved from https://studentshare.org/statistics/1667526-data-analysis-and-discussion
(Data Analysis and Discussion Essay Example | Topics and Well Written Essays - 500 Words)
Data Analysis and Discussion Essay Example | Topics and Well Written Essays - 500 Words. https://studentshare.org/statistics/1667526-data-analysis-and-discussion.
“Data Analysis and Discussion Essay Example | Topics and Well Written Essays - 500 Words”, n.d. https://studentshare.org/statistics/1667526-data-analysis-and-discussion.
  • Cited: 0 times

CHECK THESE SAMPLES OF Data analysis and discussion

Apple Inc. Increasing Corporate Market Share

Data analysis and discussion The needs of Apple Inc.... Both Qualitative and Quantitative research methodologies are applied in collection of quantifiable and qualitative data for analysis and interpretation.... This paper presents a report of an analytical analysis of Apple Inc.... The scope of the report will include analysis of the needs of the company's customers, strategies through which the company will increase corporate market share and its competitiveness....
5 Pages (1250 words) Research Paper

Promoting Global Tolerance through the Film Industry

To this effect, they were in an excellent position to provide useful data that were based on facts to the various questions that I had for them.... This was done to ensure fairness in the data collection procedure.... data Collection Procedure As indicated earlier, I made use of interview as a data collection instrument for the research.... Because this was a qualitative research, I wanted the data collection procedure to be based on ethical sentiments and awareness creation instead of statistical fact finding....
8 Pages (2000 words) Essay

Quantitative Analysis

hellip; His data analysis indicated that there was a positive relationship between the students socioeconomic and students' achievement association.... Quantitative analysis Name Institution Tutor Date Quantitative analysis Summary Sirin (2005) conducts a meta-analytic review of research on social economic status and academic achievement.... He further conducted a repeat of this study using the White's (1982) meta-analysis to assess whether the socioeconomic achievement relationship improved since the first publication of White's (1982) meta-analysis....
4 Pages (1000 words) Assignment

Bullying and Zero Tolerance Policies

The data has been gathered from a multi-cultural society to ensure that the results are not biased and represent the whole society not just a sub-sector. From this table we can see that parents are not particularly satisfied with the solutions they have experienced and they would like to try out the zero tolerance policy....
8 Pages (2000 words) Essay

Hookes Law Laboratory

23Data analysis and DiscussionFigure 2Figure 2 indicates that for forces greater than about 4.... N were ignored and the rest of the data were treated by a least squares analysis to determine the coefficients of first degree polynomial best fit.... He defined the relation as “the extension is proportional to the force”. If a weight, W = mg, is hung from one end of an ordinary spring,… If W is not so large as to permanently distort the spring, then this force, F, will restore the spring to its original length after the load is Hooke's Law Laboratory Report Background  Hooke's Law is a basic physics principle that opines that the force required to extend or compress a spring by some distance is proportional to that distance....
3 Pages (750 words) Lab Report

How Educational Attainment and Age Affect the Relationship

Based on these established discussions, the present analysis attempted to conceptualize how perceptions on corruption could be related to the perceived impediments to quality service delivery, including provision of high standard infrastructure.... This research investigated the relationship between the satisfaction levels of Bahrain nationals aged above 18 years of age and how they perceive corruption to be deeply or lightly rooted in the government....
10 Pages (2500 words) Essay

Motion in One and Two Dimensions

hellip; The theories on motion in one dimension and two dimensions will be used to help analyze the data to be obtained from experiments.... These data will help to calculate acceleration due to gravity.... The experiments described in this report are aimed to help in measuring the acceleration of the earth or space gravity and to demonstrate the independence of accelerated motion and uniform motion in a body or an object moving at an angle between the vertical and horizontal motions....
5 Pages (1250 words) Lab Report
sponsored ads
We use cookies to create the best experience for you. Keep on browsing if you are OK with that, or find out how to manage cookies.
Contact Us