StudentShare
Contact Us
Sign In / Sign Up for FREE
Search
Go to advanced search...
Free

Statistics for Job Satisfaction - Assignment Example

Cite this document
Summary
This assignment "Statistics For Job Satisfaction" discusses how each and every organization is faced with people's challenges. How do you get the public moving in the right direction? Start where they are. The first step is to provide feedback to employees from their current point of view. …
Download full paper File format: .doc, available for editing
GRAB THE BEST PAPER92.5% of users find it useful
Statistics for Job Satisfaction
Read Text Preview

Extract of sample "Statistics for Job Satisfaction"

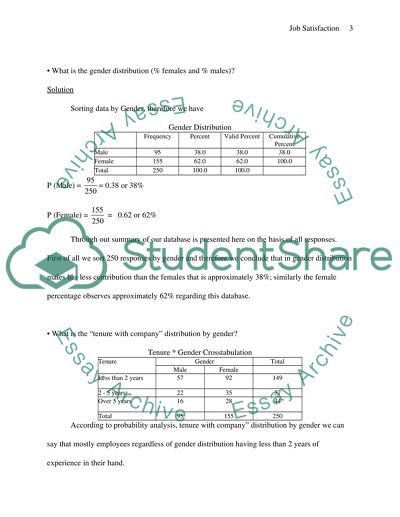
Running Head: STATISTICS Statistics of the of the Job Satisfaction Introduction Job satisfaction is considered to one's thoughts or mental state about the nature of their work. Job satisfaction can be influenced by a variety of factors, e.g., the quality of one's relationship with their supervisor, the quality of the physical environment in which they work, degree of fulfillment in their work, etc. There is no strong recognition amongst researchers, consultants, etc., that increased job satisfaction creates improve job performance -- in fact, and improved job satisfaction can sometimes decrease job performance. For instance, you could let sometime sit around all day and do nothing. That may make them more satisfied with their "work" in the short run, but their performance certainly didn't improve. Each and every organization is faced with people challenges. How do you get public moving in the right direction Start where they are. The first step is to provide feedback to employees from their current point of view. That is where Inscape Publishing comes in. For nearly 30 years Inscape guides have been first choice for research-based self-assessments. They've helped over 30 million people worldwide progress performance, increase job satisfaction and value differences (Hines, 1990). - What is the gender distribution (% females and % males) Solution Sorting data by Gender, therefore we have Gender Distribution Frequency Percent Valid Percent Cumulative Percent Male 95 38.0 38.0 38.0 Female 155 62.0 62.0 100.0 Total 250 100.0 100.0 P (Male) = = 0.38 or 38% P (Female) = = 0.62 or 62% Through out summary of our database is presented here on the basis of all responses. First of all we sort 250 responses by gender and therefore we conclude that in gender distribution males has less contribution than the females that is approximately 38%; similarly the female percentage observes approximately 62% regarding this database. - What is the "tenure with company" distribution by gender Tenure * Gender Crosstabulation Tenure Gender Total Male Female Less than 2 years 57 92 149 2 - 5 years 22 35 57 Over 5 years 16 28 44 Total 95 155 250 According to probability analysis, tenure with company" distribution by gender we can say that mostly employees regardless of gender distribution having less than 2 years of experience in their hand. P (Female having less than 2 years tenure) == 0.368 or 36.8% P (Male having less than 2 years tenure) == 0.228 or 22.8% P (Female having 2 -5 years tenure == 0. 14 or 14% P (Male having 2 -5 years tenure) == 0.088 or 8.8% P (Female over 5 years tenure) == 0.112 or 11.2% P (Males over 5 years tenure) == 0.064 or 6.4% - What % of the survey participants are in each department Departments Frequency Percent Valid Percent Cumulative Percent Human Resources 10 4.0 4.0 4.0 Information Technology 91 36.4 36.4 40.4 Administration 149 59.6 59.6 100.0 Total 250 100.0 100.0 P (Human Resources) = = 0.04 or 4% P (Information Technology) = = 0.364 or 36.4% P (Administration) = = 0.596 or 59.6% According to table we can easily observe the percentages of participants in each department, and conclude that administration department having maximum percentages as well as human resource having least percentages of selected employees. - What is the mean overall satisfaction by gender Descriptive table shows the mean overall satisfaction level by gender N Minimum Maximum Mean Std. Deviation Male 95 1.00 6.60 4.1874 1.28289 Female 155 1.00 7.00 4.3187 1.35966 Total 250 According to this table, we can observe that the mean overall satisfaction by gender having greater percentages in female category, that is 4.3187 mean satisfactions and for males its 4.1874 mean satisfaction according to job satisfactory level with their jobs. So we can say that there is very slight difference in terms of mean overall satisfaction by gender. If we choose a person at random from this database: - What is the probability that this person will be between 22 and 49 years old Solution Age * Gender Crosstabulation Age Gender Total Male Female 21 & under 17 25 42 22 - 49 63 103 166 50 & over 15 27 42 Total 95 155 250 There are 166 employees within specific age group (22 - 49years); in which 103 are females and remaining 63 are males. Therefore, P (person will be between 22 and 49 years old) = = 0.664 or 66.4 - What is the probability that their overall job satisfaction is 4.7 or lower Solution Sorting overall job satisfaction, than we get Job Satisfaction Frequency Cumulative Frequency Least Satisfied 4 4 1.60 3 7 1.80 6 13 2.00 9 22 2.20 5 27 2.40 2 29 2.60 6 35 2.80 7 42 3.00 5 47 3.20 10 57 3.40 6 63 3.60 12 75 3.80 13 88 4.00 20 108 4.20 14 122 4.40 9 131 4.60 22 153 4.80 15 168 5.00 15 183 5.20 8 191 5.40 11 202 5.60 11 213 5.80 11 224 6.00 8 232 6.20 8 240 6.40 1 241 6.60 3 244 6.80 1 245 Most Satisfied 5 250 Total 250 P (Overall job satisfaction 4.7) = = 0.612 or 61.2%. Since there are 153 employees having 4.7 or lower job satisfaction value. - What is the probability that this person will be a male in the information technology department Conclusion Department * Gender Crosstabulation Department Gender Total Male Female Human Resources 2 8 10 Information Technology 33 58 91 Administration 60 89 149 Total 95 155 250 P (person will be male in the information technology department) = = 0.092 So we conclude that from selected sample, 9.2% males are working in the information technology department. - What is the probability that this person will be an hourly employee whose intrinsic satisfaction is 6 or more Solution - Frequency table shows that there are 131 employees those having the position 1 that is "Hourly employees", Intrinsic Satisfaction Frequency Cumulative Frequency 6.00 3 3 6.10 8 11 6.20 4 15 6.30 3 18 6.40 4 22 6.50 4 26 6.60 2 28 6.70 2 30 6.80 1 31 6.90 1 32 Most Satisfied 3 35 Total 35 P (Hourly employees whose intrinsic satisfaction 6) = = 0.14 So we conclude that there are 14% hourly employees whose intrinsic satisfaction level is 6 or more. Discussion Employee expectations of certain standards for working conditions at the beginning of employment may be considered an implicit social contract with the employer. If those standards are not met, a violation of the contract occurs and system inequity results. System inequity may be the most powerful predictor of dissatisfaction given that, in addition to working conditions, it has been found to be antecedent to pay dissatisfaction. Firms seeking to reduce system inequity must promote realistic expectations of both pay and working conditions, particularly at the time of employment (Happell, 2003). In summary, this article has filled a gap in the literature on workplace inequity by focusing on working conditions rather than on pay as the source of inequity. By using global job satisfaction rather than facet-based satisfaction with working conditions, this study has demonstrated the generalizability of the effects of inequity in working conditions to overall satisfaction with the job. References Cooper CL, Rout U, Faragher B (1989). Mental health, job satisfaction, and job stress among general practitioners. BMJ, 298(6670):366-370 Happell B, Martin T, Pinikahana J (2003): Burnout and job satisfaction: a comparative study of psychiatric nurses from forensic and a mainstream mental health service. International Journal of Health & Nursing 12:39-47. Hines W H & Montgomery D C (1990). Probability and Statistics in Engineering and Management Science Wiley, New York Prabhu, V.B., Yarrow, D.J., & Gordon-Hart, G. (2000). Best Practice and Performance within North East Manufacturing, Total Quality Management Journal, Vol. 11, No. 1, pp.113 -122. Voss C A Roth A V Chase R B (1998). Revision 11, Service Pilot Benchmarking for the North Voss C A Roth A V Chase R B (1998). Revision 7, Manufacturing Pilot Benchmarking for the North East Questionnaire, London Business School Read More
Cite this document
  • APA
  • MLA
  • CHICAGO
(Statistics for Job Satisfaction Assignment Example | Topics and Well Written Essays - 1750 words, n.d.)
Statistics for Job Satisfaction Assignment Example | Topics and Well Written Essays - 1750 words. https://studentshare.org/statistics/1508974-workplace-inequity
(Statistics for Job Satisfaction Assignment Example | Topics and Well Written Essays - 1750 Words)
Statistics for Job Satisfaction Assignment Example | Topics and Well Written Essays - 1750 Words. https://studentshare.org/statistics/1508974-workplace-inequity.
“Statistics for Job Satisfaction Assignment Example | Topics and Well Written Essays - 1750 Words”. https://studentshare.org/statistics/1508974-workplace-inequity.
  • Cited: 0 times

CHECK THESE SAMPLES OF Statistics for Job Satisfaction

Job Satisfaction Evaluation

job satisfaction is considered to one's thoughts or mental state about the nature of their work.... job satisfaction can be influenced by a variety of factors, e.... that increased job satisfaction creates improve job performance -- in fact, and improved job satisfaction can sometimes decrease job performance.... They've helped over 30 million people worldwide progress performance, increase job satisfaction and value differences (Hines, 1990)....
2 Pages (500 words) Article

Job Satisfaction

It is stated that job satisfaction is the extent to which employees like their work.... Locke, for instance, defined job satisfaction as "a pleasurable or positive emotional state resulting from the appraisal of one's job or job experiences".... The level of employee's job satisfaction is related to his or her expectations towards the job (Porter and Steers; 1973); this depends on many factors such as pay, promotion, or autonomy.... he above view is supported by Pearson (1991) who had found that when the level of unmet expectations becomes large, there is low job satisfaction level and the probability of negative behaviour and turn over increases....
66 Pages (16500 words) Dissertation

Job Satisfaction: A Review of the Statistics

A job can be fun, challenging and provide some sort of satisfaction, right Well, within the past few decades it seems as if job satisfaction is on the decline, along with the business's revenues, productivity and net worth because of this up and coming epidemic.... Researchers agree that the overall job satisfaction in the U.... The questions were asked in regards to gender, age, department, position, tenure, overall job satisfaction, and intrinsic/extrinsic job satisfaction....
4 Pages (1000 words) Essay

Job Satisfaction in Oil, Gas, and Energy Sectors

The purpose of this study "job satisfaction" is to measure and analyse job satisfaction of the Qatari employee's working in the Oil, Gas, Energy and Industry sectors; by examining how the personal and environmental factors affect job satisfaction.... hellip; job satisfaction is an important factor in different industries especially in high-risk environments because high levels of productivity characterized by work efficiency is a prerequisite for the work environment....
83 Pages (20750 words) Essay

Statistics of Job Satisfaction

job satisfaction can be influenced by a variety of factors, e.... that increased job satisfaction creates improve job performance -- in fact, and improved job satisfaction can sometimes decrease job performance.... Theyve helped over 30 million people worldwide progress performance, increase job satisfaction and value differences (Hines, 1990).... Descriptive statistics were calculated for the employment background and the job satisfaction variables....
2 Pages (500 words) Essay

Statistics (Quantitative Methods) **High Standard Required

Data was collected on about 293 mechanics using random sampling which is acceptable (Richmond, A 2007)....
5 Pages (1250 words) Essay

Comparative Analysis of Empolyee's Job Satisfaction in Pakistani Banks

His words of wisdom will always be remembered, and I am convinced with the… I would also like to thank all the participants in filling the questionnaires for this dissertation and finally, my dad and mum for their enduring This paper endeavors to find out the level of employees job satisfaction among three of the Pakistans top commercial banks by conducting the research survey and performing statistical techniques to judge the correlation and level of significance for the factor....
20 Pages (5000 words) Essay

Job Satisfaction

In the paper “job satisfaction” the author analyzes a distinction between cognitive job satisfaction and affective job satisfaction.... Cognitive job satisfaction is the extent of a person's satisfaction with specific facets of their jobs such as pension arrangements, pay, working hours.... hellip; The author claims that effective job satisfaction is the extent of agreeable emotional feelings a person has about his or her overall job....
1 Pages (250 words) Research Paper
sponsored ads
We use cookies to create the best experience for you. Keep on browsing if you are OK with that, or find out how to manage cookies.
Contact Us