StudentShare
Contact Us
Sign In / Sign Up for FREE
Search
Go to advanced search...
Free

Census Data by Location in Western Australia - Essay Example

Cite this document
Summary
The reporter underlines that the community profile that is being discussed here is related to Padbury, which is located in Western Australia. For the purpose of its detail and thorough study of the community profile, the census data and tables have been consulted from the Australian Bureau of Statistics website…
Download full paper File format: .doc, available for editing
GRAB THE BEST PAPER92.9% of users find it useful
Census Data by Location in Western Australia
Read Text Preview

Extract of sample "Census Data by Location in Western Australia"

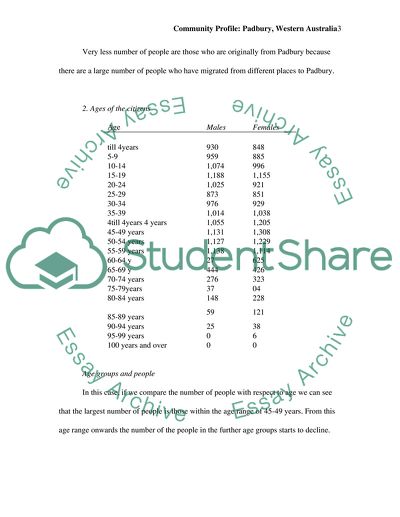
COMMUNITY PROFILE PADBURY, WESTERN AUSTRALIA Census data by location The community profile that is being discussed here is related to Padbury, which is located in Western Australia. For the purpose of its detail and thorough study of the community profile, the census data and tables have been consulted from the Australian bureau of statistics website. There are eight categories that have been selected out of the 45 categories of the census that are given in the census tables. 1. Languages spoken and citizenship Ages till 4years years 930 848 1,778 5-14 years 2,031 1,883 3,914 15-19 years 1,189 1,155 2,344 20-24 years 1,025 922 1,947 25-34 years 1,847 1,779 3,626 35-44 years 2,058 2,252 4,310 45-54 years 2,263 2,536 4,799 55-64 years 1,864 1,739 3,603 65-74 years 726 747 1,473 75-84 years 388 530 918 85 years and above 85 159 244 At home 13,600 14,040 27,640 Persons with Australian citizenship Having birth in Australia 72 82 154 Place of birth Australia 8,792 8,716 17,508 Other places 4,738 5,082 9,820 Languages spoken: English only 12,514 12,613 25,127 Other languages 1,217 1,390 2,607 The average age in the area of Padbury thereby in this case is 54 years. After the age of 54, the number of people starts decreasing having greater than 54 years of age. Very less number of people are those who are originally from Padbury because there are a large number of people who have migrated from different places to Padbury. 2. Ages of the citizens Age  Males Females till 4years 930 848 5-9 959 885 10-14 1,074 996 15-19 1,188 1,155 20-24 1,025 921 25-29 873 851 30-34 976 929 35-39 1,014 1,038 4till 4years 4 years 1,055 1,205 45-49 years 1,131 1,308 50-54 years 1,127 1,229 55-59 years 1,138 1,114 60-64 y 27 625 65-69 y 444 426 70-74 years 276 323 75-79years 37 04 80-84 years 148 228 85-89 years 59 121 90-94 years 25 38 95-99 years 0 6 100 years and over 0 0 Age groups and people In this case, if we compare the number of people with respect to age we can see that the largest number of people is those within the age range of 45-49 years. From this age range onwards the number of the people in the further age groups starts to decline. We can see that the number of people is becoming lesser and lesser as we go on till the age range of 59 years of age. The number of children as we can see is not much on the lower side however the numbers are not too high as compared to the people of the higher ages. This might be showing that the reproductive rates of the people in Padbury are comparatively slower. Comparison among gender in the age groups There are total of 21 age group that have been given in the census table. In these age groups we can see that there are 12 age groups in which the number of male members is greater as compared to the female members. This means that there are only 9 age groups left behind having greater number of female members as compared to the male members. 3. Native status be age Native Non Native Unstated citizenship   Males Females Males Females Males Females till 4years 6 8 879 808 44 32 5-9 years 12 12 915 829 33 44 10-14 years 12 12 999 947 62 37 15-19 years 11 6 1,119 1,085 59 63 20-24 years 7 4 963 888 55 29 25-29 years 4 10 825 801 42 41 30-34 years 5 7 930 897 41 25 35-39 years 3 5 958 1,000 51 35 40-45 years 4 3 1,009 1,163 40 42 45-49 years 4 11 1,075 1,245 51 54 50-54 years 7 0 1,060 1,188 60 42 55-59 years 0 5 1,085 1,062 51 49 60-64 years 0 0 700 595 29 30 Above 65 years 3 0 1,137 1,366 60 69 Total 78 83 13,652 13,874 678 592 The numbers of people with the indigenous citizenship of Padbury are very lesser as compared to the people who are native citizens. We can see that the figure representing the foreigners who do not belong to Padbury by citizenship is very large. It might be because the immigration has speeded up since many years for seeking jobs and employment in different countries. 4. Frequently spoken languages   Males Females Speaks English only 12,514 12,613 Arabic 40 44 Australian native Languages 3 3 Chinese 8 8 Mandarin language 45 59 Other 6 7 Total 136 159 Croatian 36 31 Dutch 40 44 Filipino 3 13 French 43 60 German 99 103 Greek 29 37 Hindi 17 15 Hungarian 8 19 Indonesian 21 31 Iranic languages: Persian language 7 11 Dari 8 0 Total 17 21 Italian 112 122 Japanese 13 22 Khmer 0 0 Korean 9 4 Macedonian 28 20 Maltese 0 0 Polish 74 70 Portuguese 15 24 Russian 17 23 Samoan 0 4 Serbian 30 19 Sinhalese 3 4 Spanish 51 64 Tagalog 5 16 Tamil 5 5 Turkish 0 0 Vietnamese 46 32 Here we can see that the greatest number of people is those who are English speakers. However, there are a important and noteworthy number of people who speak Italian language, polish language, German and French language. 5. Greatest level of education Ages Till 19 years Till 24 years Till 34 years Till 44 years Till 54 years Till 64 years Males Year 12 or equivalent 437 645 1,063 1,070 1,143 750 Year 11 or equivalent 236 133 248 247 220 139 Year 10 or equivalent 305 154 361 546 642 642 Year 9 or equivalent 100 25 39 45 74 112 Year 8 or below 3 5 9 12 29 81 Did not attend school 0 0 0 5 0 0 Highest year of school not stated 108 64 125 135 154 141 Total 1,189 1,026 1,845 2,060 2,262 1,865  Females Year 12 or equivalent 925 1,363 2,322 2,361 2,335 1,366 Year 11 or equivalent 471 204 429 552 525 299 Year 10 or equivalent 541 244 581 1,032 1,435 1,299 Year 9 or equivalent 184 32 59 78 140 232 Year 8 or below 3 5 19 26 52 152 Did not attend school 0 0 3 8 8 0 Unstated Highest year of school 220 99 213 254 303 254 Total 2,344 1,947 3,626 4,311 4,798 3,602 This is the census table where we compare the number of male and female students in the different grades. In the case of males we can se that the number of male students is higher in the 12th grade or greater. After that the greater numbers of male students are in the 10th grade or the greater category, thus intermediate number of students exists in the 11th grade category. There are a important and noteworthy number of students with unknown or unregistered educational status. In the case of the female category, same is the case with the 10th, 11th and 12th grade categories. However there is a difference in the case of the unstated education status numbers of the female category. Here the number of the students is really very less as compared to the male students. 6. Total Income on individual basis Till 19 years Till 24 years Till 34 years Till 44 years Till 54 years Till 64 years   Males  No income 376 52 45 39 34 37 $1-$149 291 57 20 21 27 46 $150-$249 122 93 64 46 43 114 $250-$399 133 107 57 48 63 132 $400-$599 77 199 186 149 144 211 $600-$799 43 191 297 234 257 256 $800-$999 8 122 307 273 284 251 $1,000-$1,299 6 67 330 354 405 288 $1,300-$1,599 4 23 195 232 275 146 $1,600-$1,999 0 12 119 173 173 119 $2,000 or more 3 10 100 355 415 172 Individual income not stated 126 93 128 135 143 91 Total 1,189 1,026 1,848 2,059 2,263 1,863   Females Negative/Nil income 295 46 117 207 210 193 $1-$149 383 94 161 230 143 128 $150-$249 127 118 162 199 179 247 $250-$399 136 151 190 292 308 272 $400-$599 73 214 279 364 445 265 $600-$799 15 156 278 280 404 221 $800-$999 0 67 203 200 262 122 $1,000-$1,299 0 22 187 179 281 119 $1,300-$1,599 6 6 51 73 95 43 $1,600-$1,999 0 4 35 52 42 22 $2,000 or more 0 0 19 55 42 18 Individual income not stated 119 43 97 119 125 90 Total 1,154 921 1,779 2,250 2,536 1,740 Here we are making the comparison between the incomes of the females and the males in this census table. In the case of the males, we see that the greatest number of males are earning in the range of $1,000-$1,299. The related number of the people are earning in the range of $600-$799 and $800-$999. Very less number of males are earning in the maximum income range. There is a important and noteworthy number of the people who are not earning any income. The number may include the unemployed persons or the persons who are still looking for the employment or the over aged people. In the case of the female people, as compared to the males, there is a greater number of the female who are earning in the first five income ranges. There is a major difference between the numbers represented here in the female category and the male category where clearly the higher frequency lies in the female category. However approximately double the number of females are in the list of being unemployed state or those who are not earning at all. 7. Children in the family   Families Parents with no children 2,990 Parents having: Children under 15 Total 2,580 No children under 15: Total 1,441 One parent family with: Children under 15 550 This is the census table, which shows the number of the children in the double parent families and the number of the families with no children. In this case we see that the greater number of families are those having the children elder than 15 years of age. The single parent families in this case is also very important and noteworthy . 8. Profession according to age       Managers jobs Professionals   Technicians & Traders Community & personal service workers Clerical & aministration   Sales workers Males   Till 19 years 7 9 174 39 29 127 Till 24 years 39 93 311 41 60 71 Till 34 years 168 287 585 86 106 86 Till 44 years 339 376 483 96 104 115 Till 54 years 444 432 478 91 156 109 Till 64 years 257 260 338 53 115 105 Till 74 years 16 26 29 9 12 11 Till 84 years 3 4 0 0 0 0 Above 85 years 4 3 0 0 0 0   Females              15-19 years 20 23 199 177 115 459 20-24 years 77 195 364 188 240 242 25-34 years 284 647 656 234 468 209 35-44 years 486 791 540 280 560 265 45-54 years 593 929 571 349 763 292 55-64 years 335 441 387 184 457 200 65-74 years 16 38 33 12 33 19 75-84 years 3 7 4 3 4 0 85 years and over 4 3 0 0 0 0             Total 1,818 3,174 2,754 1,427 2,640 1,686 This is the census table where we see the professional careers of the men as compared to the women. In the male category, first of all the most important and noteworthy number of employed man that we see is in the age range of 45-54 years. The minimum number of men is in the age range of 75-85 years of age range. Than we have to see the professions and the people in the particular business. The age range of 45-54 years of age, the greater frequency of men are having the professions of managers or other professional careers which might include the engineers. Traders and technicians is the profession, which is greatly taken up by the younger people of the age range 34 years. In the case of females also we see that the greatest number of female employees or employers is in the age range of 54 years of age range. The noteworthy figure of women are in the administrative posts are in the age range of 54 years. Observation record It has been seen that the education level in the community is very good. Although changes need to be done in the case of the important number of the students who are not having any recorded status of education. The number that represents the females and the males in this class is huge and that should be taken care of. The professions have a wide variety as we see the census tables. Here we see that there is a noteworthy numbers of people having different professions. Greater number of people are in the employment stages in the age range of 54 years as compared to the younger people. Therefore the active class of the people is those who are in this age range. It can be noticed from the tables that the average age range of the people in this community is of 54 years. And the people having greater ages are found in the community in lesser numbers. The medical facilities, the parks, the extra curricular facilities for the people of the community as well as the educational facilities are well available in the community. The schools, colleges are profoundly actively functioning in the society. The greater number of the teenagers are involved in the educational activities therefore not too much of the teenagers are seen roaming around the streets. However in the evening timings the children are definitely seen filling up the parks. Good food is generally available in the shops and the scope of health is in its better state. Mostly the people speak in English language. Resource file For a better profiling of the community, the visit was decided to be made to the main education office at the community main centre. The aim was to get the knowledge of the education sector that was working in the community. If there were any changes being made in the education policies that are being implemented in the community. With us, the census tables were carried and had the discussion with the main education officer who is always responsible for laying down the priorities of the education system in the community. All the education offices always work under the education officer. The main issue that was of concern among the community citizens is that the number of the citizens having undecided state of education in females and the males is too high and that has to be decided to be resolved. Needs analysis/report In the case of Padbury it has been noticed that it is a well-developed community. The education level in the community is very good. However some changes need to be done with the important and noteworthy number of the students who are not having any recorded status of education. The number that represents the females and the males in this class is huge and that should be taken care of. The community is having all the necessary facilities that are required. The educational and medical status is very fine in the community. The figure of males and females in the employment status is very appreciable which shows that the education facilities are very well in the community. Because of the employment status the economy of the community is also very well. The people are having nicer and peaceful lives in the community. The community over all seems to be doing well. There is no major problem in the infrastructure of the community. The health of the community can be judged by the fact that the elders are earning for themselves and so are the young. The education numbers of the males and the females is not too bad. Summary The community profile that is being discussed here is Padbury, which is located in Western Australia. In the case of ages we see that the number of people start to decrease after the age of 54 years. Although the data shows that a very less number of people are with the ages of greater than 54 years. There is a large number of people in Australia, in Padbury specifically who speak English and a very less number of people are those who speak foreign languages. The numbers of people with the indigenous citizenship of Padbury are very lesser as compared to the people who are native citizens. We can see that the number of foreigners in this case is very large. It might be due to the reason that the immigration has increased since many years for seeking jobs and employment in different countries. The people who speak languages other than English are very lesser comparatively. In the case of Padbury it has been noticed that it is a well developed community. The education level in the community is very good. However some changes need to be done in the case of the important and noteworthy number of the students who are not having any recorded status of education. The number that represents the females and the males in this class is huge and that should be taken care of. The community is having all the necessary facilities that are required. The educational and medical status is very fine in the community. References Australian Bureau of Statistics. 19 March 2009. Australian Bureau of Statistics. www.abs.gov.au. Read More
Cite this document
  • APA
  • MLA
  • CHICAGO
(“Census Data by Location in Western Australia Essay”, n.d.)
Census Data by Location in Western Australia Essay. Retrieved from https://studentshare.org/sociology/1720985-community-profile
(Census Data by Location in Western Australia Essay)
Census Data by Location in Western Australia Essay. https://studentshare.org/sociology/1720985-community-profile.
“Census Data by Location in Western Australia Essay”, n.d. https://studentshare.org/sociology/1720985-community-profile.
  • Cited: 0 times

CHECK THESE SAMPLES OF Census Data by Location in Western Australia

Natural Resource Management in the News

          This paper has the primary objective to present a critique on a news items appearing in media pertaining to any of the varied issues relevant in natural resources management in australia.... This article sentially engages in describing the activities undertaken by varied volunteers who form and contribute to the Threatened Birds Network (TBN) which is a community based program of the Australian Government's Natural Heritage Trust and Birds australia....
5 Pages (1250 words) Essay

Building Marketing Plan for CookieCraze

The company is a partnership owned by two friends and its first physical location is opening… The company is committed to doing so by using the highest quality ingredients, hiring the best staff and maintaining top notch CookieCraze will forever maintain relationships of mutual trust and integrity with all business partners and communities.... According to the US census, there has been a rise in the rate of population growth....
5 Pages (1250 words) Term Paper

Why I Want To Do My Rural Rotations In Western Australia And My Rural Location Of Preference

This paper under the headline "Why I Want to Do My Rural Rotations in western australia and My Rural Location of Preference" focuses on the fact that rural rotation is part of a student's fulfilment of the academic program into health care and medical practice.... In this paper, I seek to offer a statement of why I am interested in doing my rural rotations in western australia and my possible preference rural location.... There are however a number of reasons why I am particularly interested in western australia....
1 Pages (250 words) Essay

Western australia demand and supply

LECTRONIC COLLECTION OF LABOUR FORCE DATAThe ABS will commence a trial of on-line electronic data collection of labour force data from households in December 2012.... These estimates use the 2006 census base for the population benchmarks.... etails of further rebenchmarking of the Labour Force estimates, including the 2011 census-based rebenchmarking, are included in the feature article Rebenchmarking of Labour Force Seriesin this publication....
2 Pages (500 words) Essay

What_is_the_marketing_research_and_is_it_useful

Market research transforms raw data into meaningful intelligence.... Market research targets the specific information required to address the above issues, design unique methods for collecting data and information, manage as well as implement the collected and filtered data and prepare results and strategize the implications into beneficial action plans (Andreasen, 2002)....
10 Pages (2500 words) Essay

Tropical Architecture

This paper ''Tropical Architecture'' tells that Modern architects have focused on important factors that they utilize in designing modern buildings.... These factors are crucial as they assist in reducing the carbon footprint.... nbsp;The geography of a certain area dictates the category of a house that can be erected....
11 Pages (2750 words) Essay

Structural Economic Changes in Parramatta City between 2001 and 2011

The city seeks to be the driving force behind new wealth generation in western Sydney and to be the center of high-value adding employment.... As the geographical, cultural, and commercial capital of Western Sydney, the city is the six largest in australia and the second largest in Sydney.... Parramatta's vision entails being the driving force as well as the centre of most important economic regions in australia; a center of excellence in enterprise, education, and research and a vibrant home for different communities to flourish....
9 Pages (2250 words) Research Paper

The Geography of Moreton Bay Regional Council

Moreton Bay is among the largest estuarine bays known in australia....   The Geographical Location of Moreton Bay Region The Moreton Bay Region is located in South East Queensland in australia, to the north of Brisbane, the Australian capital.... It is also the third-largest in australia after that of Brisbane and the Gold Coast.... % increase from approximately 378,000 persons in the 2011 census....
6 Pages (1500 words) Term Paper
sponsored ads
We use cookies to create the best experience for you. Keep on browsing if you are OK with that, or find out how to manage cookies.
Contact Us