StudentShare
Contact Us
Sign In / Sign Up for FREE
Search
Go to advanced search...
Free

Influence of Geography on Countries Destiny - Assignment Example

Cite this document
Summary
This assignment "Influence of Geography on Countries’ Destiny" initiates the analysis by supporting the opponents of the geography hypothesis. It supports the statement that geography is not the destiny and effects associated with bad geography can be resolved with good political institutions…
Download full paper File format: .doc, available for editing
GRAB THE BEST PAPER91.9% of users find it useful
Influence of Geography on Countries Destiny
Read Text Preview

Extract of sample "Influence of Geography on Countries Destiny"

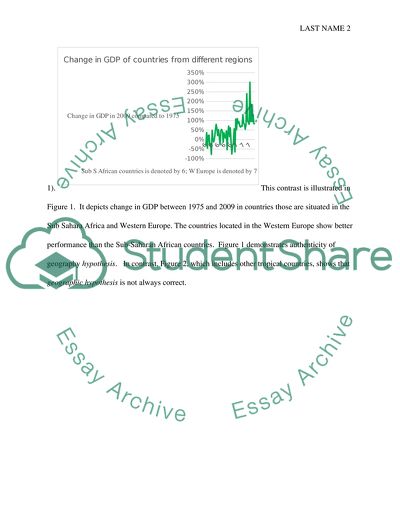
Teacher’s Influence of Geography on Countries’ Destiny RESEARCH QUESTION Nogales, once a united now is divided into two parts. Nogales, Santa Cruz the north of the town is located in the USA and Nogales, Sonora, the south of the city belongs to Mexico. The people at north of Nogales maintain much higher living standard than the people at south. It is a tiny example that talks about a bigger picture related to the prosperity and living standard that exists in different countries around the world (Acemoglu and Robinson 1). It also echoes the highly debated issue why some nations are rich, and others are poor. Some social scientists relate poverty to the geographical locations of countries. This approach gave birth to the concept of the name geography hypothesis (Eichengreen 2). Actually, many poor countries in Central America, South Asia, and Africa are located between tropic of Cancer and Capricorn while in contrast while rich nations generally are located in temperate latitudes (Acemoglu and Robinson 1). This contrast is illustrated in Figure 1. It depicts change in GDP between 1975 and 2009 in countries those are situated in the Sub Sahara Africa and Western Europe. The countries located in the Western Europe show better performance than the Sub-Saharan African countries. Figure 1 demonstrates authenticity of geography hypothesis. In contrast, Figure 2, which includes other tropical countries, shows that geographic hypothesis is not always correct. In academic world, the concept of dependence of economic growth on the country’s geography is called economic geography. Over a period of 40 years after the WWII, the geography hypothesis made economic geography a dormant subject (Eichengreen 1). Today, it has become an issue of active debate because many researchers hold opinion that poverty in tropical countries should not be related to geographical locations and infectious disease. They think that it is the government of those states who should be blamed for the failure to put in place right enabling environment (Hausman 2). The set forth above discussion shows that one group of people relate prosperity of a nation to the geography hypothesis, and the other groups of people relate it to the performance of the political institutions. The proponent of geography hypothesis claims that countries located in unfavored geographic zones will remain poorer than those favored by right geographic location. However, the opponents argue that good political institutions can mitigate the adverse effects of bad geography. Is geography a destiny? The objective of this assignment is to study the above claim. VARIABLES and DATA TYPES The above claim reminds the French political philosophers Montesquieu’s statement that prosperity and poverty are concentrated in similar geographic locations of the world (Acemoglu and Robinson 1). He explained that the people from tropical climates are lazy and do not work hard. Furthermore, they like to be ruled by despots; thus, economic failure in this region can be explained by the absence of Rule of Law. Other researchers claim that countries within the tropic of Cancer and Capricorn have inadequate infrastructure and landlocked; that is why these countries face higher transportation cost making trading ineffective. Poverty of this region is also attributed to the absence of proper public health care. The above review describes a cause and effect relationship; countries with good rule of law will have prosperity while with bad rule of law will have poverty. Thus, rule of law becomes an independent variable, and prosperity becomes a dependent variable. We may also attach to this relationship infrastructure and public health as confounding variables. The above description explains the research question of this assignment. In order to find an answer, this assignment conducted quantitative analysis of the relationship; Prosperity = ∫ (rule of law, infrastructure, public health). Furthermore, the assignment uses linear regression analysis, as a tool to answer the question if geography is a destiny. Regression is conducted on observational data collected by various leading organizations. The dataset divides countries of the world in seven regions; Central and South Asia is 1, Eastern Europe is 2, East Asia and Pacific islands is 3, Latin America and Caribbean is 4, Middle East and North Africa is 5, Sub Saharan Africa is 6, and West Europe, USA, and Canada is 7. Countries from these regions denote a variable through continuous and dichotomous type data. Table 1 illustrates variables that are used in different models of this study. Table1. Description of Variables Name of the Variables Type of the Variables Data type Notations Sources GDP per capita, 2009 (rgdpch2009) Dependent Continuous Y (Allan, Summers and Aten) Rule of Law, 2009 (rulelaw2009) Independent Continuous X1 (Kaufmann,Kraay and Mtruzzi) Landlocked (landlocked) Dummy independent Dichotomous X2 N/A Age dependency ratio, 2009 (agedep09) Independent Continuous X3 (“WDI 2011”) Infant mortality rate, 2009 (infmor09) Independent Continuous X4 (“WDI 2011”) REGRESSION MODELS Multiple regression method evaluates parameters of the equation y = β0 + β1x1 + β2x2 +….. + βnxn + e (“Multiple Regression with Many Predictor Variables” 1) . The dependent variable Y is GDP per capita in 2009 ; it shows prosperity of countries of the world. Independent variables are selected to reflect the argument. One side of the argument states geographic hypothesis dictates prosperity of nations; the countries within the tropic of Cancer and Capricorn are destined to have poverty and disease forever. The other side states problems associated with the tropical countries can be resolved through rule of law. We use three different models that include different independent variables to reflect both sides. Model 1 GDP per capita, 2009 = ∫ (rule of law); Y = b0 + b1*X1 Model 2 GDP per capita, 2009 = ∫ (rule of law, landlocked); Y = b0 + b1*X1+b2*X2 Model 3 GDP per capita, 2009 = ∫ (rule of law, landlocked, age dependency ratio, Infant mortality rate); or Y = b0+b1*X1+b2*X2+b3*X3+b4*X4 REGESSION ANALYSIS Scatter plot in Figure 3 implies that there is a significant positive correlation between rule of law and GDP. The countries with higher values of rule of law have higher GDP and lower GDP with lower values of rule of law. Table 2 presents the results of regression analysis of model 1. Figure 3. Scatter plot Table 2 Regression output of model 1 Coefficients: Estimate Std. Error t-Value Pr(>|t|) Intercept 11912 566 21.42 4.19e-45*** rgdpch2009 9781 570 17.16 1.23e-35*** Signif. Codes: 0 ‘***’ 0.001 ‘**’ 0.01 ‘*” 0.05 “.” 0.1 “ “ 1 Residual standard error: 5595517575 on 134 degrees of freedom Multiple R-Squared: 0.687 Adjusted R-Squared: 0.685 F-statistics: 295 on 1 and 135 DF, p-Value: 1.23 e-35 Regression equation of model 1 is Y = b0+b1*X1 or Y = 11912+9781*rgdpch. The model shows that 68.7% GDP variability is explained by the variable rule of law, which demonstrates a strong relationship. The slope of the equation reveals that GDP goes up by $9781 for one unit increase in rule of law. The coefficient b1 has standard error 566, t-statistics of 21.42 and p-value of 4.19 e-35. It is therefore statistically significant at significance level α = 0.05 as p < 0.05 (“Hypothesis Test for Regression Slope” 1). It implies that the effect of rule of law on GDP, 2009 is too strong to have occurred only by chance. Table 3 Regression output of model 2 Coefficients: Estimate Std. Error t-Value Pr(>|t|) Intercept 11981 621 19.29 2.33e-40*** rgdpch2009 9757 580 16.83 9.58e-35*** landlocked -356 1413 -0.25 8.01e-01’ ‘ Signif. Codes: 0 ‘***’ 0.001 ‘**’ 0.01 ‘*” 0.05 “.” 0.1 “ “ 1 Residual standard error: 559284307 on 133 degrees of freedom Multiple R-Squared: 0.687 Adjusted R-Squared: 0.683 F-statistics: 146 on 2 and 133 DF, p-Value: 2.59 e-34 Regression equation of model 2 is Y = b0+b1X1+b2X2, or Y = 11981 + 9757*rgdpch2009 – 356*landlocked. Adjusted R2 states that 68.3% GDP variability is explained by the variables rule of law and landlocked. In this model, the coefficient b1 is 9757 and at 95% confidence interval is within (8610, 10904). In model 1, the same coefficient at 95% confidence interval is within (8654, 10908). It implies that inclusion of variable landlocked does not have an effect on rule of law. Moreover, it remains statistically significant at significance level α = 0.05 as p < 0.05. The slope explains that GDP in model goes up by $9757 for one unit increase in rule of law. The second coefficient of the model, b1 is -356; it implies that holding all other variables fixed, a unit change in the variable X2 decreases GDP by $356. The coefficient of landlocked has high standard error (1413), statistically insignificant at significance level α = 0.05 as p < 0.05. The relationship of GDP 2009 and landlocked is insignificant. Table 4 Regression output of model 3 Coefficients: Estimate Std. Error t-Value Pr(>|t|) Intercept 15416 2954 5.22 6.92e-7*** rgdpch2009 9107 750 12.14 3.8e-23*** landlocked -266 1413 -0.19 8.5e-01’ ‘ agedepo9 -56 60 -0.92 3.6e-01 ‘ ‘ infmor09 -9 36 -0.24 8.10e-01 ‘ ‘ Signif. Codes: 0 ‘***’ 0.001 ‘**’ 0.01 ‘*” 0.05 “.” 0.1 “ “ 1 Residual standard error: 5358336614 on 130 degrees of freedom Multiple R-Squared: 0.698 Adjusted R-Squared: 0.689 F-statistics: 75 on 4 and 130 DF, p-Value: 7.67 e-33 Regression equation of model 3 is Y = b0+ b1X1 + b2X2 + b3X3 + b4X4 , or Y = 15416 + 9107*rgdpch2009 – 266*landlocked – 56*agedepo9 – 9*infmor09. Adjusted R2 states that 68.9% GDP variability is explained by the variables used in this analysis. The p-value of F-test statistics informs that parameters jointly statistically significant at level α = 0.05 as p < 0.05. In this case, F-test statistics is 75, and p-value is 7.67 e-33. Test of statistical significance of b2, b3, and b4states that they are individually statistically insignificant at significance level α = 0.05 as p < 0.05. We can imply that the individual relationship of Y and X1, X2, X3, and X4 are insignificant. The value of the slope of rule of law has slightly reduced (9107); the spread is higher at 95% confidence interval (7653, 10591) but it remains statistically significant at significance level α = 0.05 as p < 0.05. Table 5. Effect of variables on real gross domestic product per capita (GDP), 20009 Variables Model 1 Model 2 Model 3 Rule of law 9781 (570) 9757 (621) 9107 (750) Landlocked -356 (1413) -266 (1413) Age dependency ratio -55 (60) Infant mortality -9 (36) Intercept 11912 (556) 11981 (621) 15416 (2954) R-Squared 0.687 0.687 0.698 N 136 136 135 Standard errors are in parenthesis CONCLUSION This assignment initiated the analysis by supporting the opponents of geography hypothesis. It supports the statement that geography is not the destiny and adverse effects associated with bad geography can be resolved with good political institutions. That is why; we selected the variable rule of law. It explains the level of people’s confidence in the rules governing their society and extent to which they follow them. It takes values between -2.5 and 2.5. Higher values reflect better rule of law. The observational data shows that Denmark with 1.87 values for rule of law produced GDP in the amount $33,909 while Chad with -1.53 values for rule of law produced GDP that is equal to $1,277. The model 1 receives a new variable that considers the effect of infrastructure. Thus, we create model 2. It uses the concept that landlocked country suffers because of absence of infrastructure to the sea. The landlocked variable can have two values 0 or 1; 1 for landlocked countries and 0 for others. The regression equation Y = 11981 + 9757*rgdpch2009 – 356*landlocked demonstrates that holding other variable unchanged, landlocked countries would make $356 less GDP than countries that are not landlocked. In the next step, model 3 is created by considering public health related variables. The assignment uses infant mortality rate (Infmor09) and age dependency ratio (agedep09) to reflect influence of public health. The infant mortality variable presents the number of infants dying before reaching one year of age per 1,000 births in a given year. The age dependency variable expresses in percent people younger than 15 and older than 64 in the work force. The regression equation of model 3 demonstrates that parameters of these two variables are negative. It implies that when all other variables remain unchanged each of these two variables will reduce the GDP value. However, the numerical values of b3 and b4 depict that the effect is negligible. Model 3 demonstrates that geography is not the destiny; the rule of law overpowers the geography hypothesis. Authenticity of model 3 is illustrated in Table 5. We selected two extreme situations using the values of the dataset: (1) GDP of a country with small value for “rgdpch09”, landlocked, high values for “agedp09” and “infmpr09”, (2) GDP of a country with high vale for “rgdpch09”, not landlocked, low values for “agedp09” and “infmpr09”. Table 5 supports the conclusion of this research. Table 5 Model 3 example Countries Rule of law Landlocked Age dependency Infant mortality GDP 2009 Uganda -0.43 1 106% 79 per 1,000 $1,152 Denmark 1.87 0 53% 3 per 1,000 $33,909 . Works Cited Acemoglu, Daron and James A. Robinson. “No, a nation’s geography is not its destiny.” reuters.com. Reuter, 19 March 2012. Web. 10 Oct. 2014. Alan Heston, Robert Summers and Bettina Aten. “Penn World Table Version 7.0.” upenn.edu. Center for International Comparisons of Production, June 2011. Web. 14 Oct. 2014 Eichengreen, Barry. “Geography as a Destiny: A Brief History of Economic Growth.” foreignpolicy.com. FP, April 1998. Web. 10 Oct. 2014. Hausman, Ricardo. “Prisoners of Geography.” foreignpolicy.com. FP, 20 November 2009. Web. 10 Oct. 2014. “Hypothesis Test for Regression Slope.” stattrek.com. Stat Trek, n.d. Web. 10 Oct. 2014. Kaufmann, Daniel Aart Kraay and Massimo Mastruzzi. “Governance Matters IX: Governance Indicators for 1996-2009: World Bank Policy Research Paper 5430.” World Bank. World Bank, 2010. Web. 14 Oct. 2014 “Multiple Regression with Many Predictor Variables.” missouristate.edu. N.p., n.d. Web. 10 Oct. 2014 “WDI 2011.” worldbank.org. The World Bank, n.d. Web. 14 Oct 2010 Read More
Cite this document
  • APA
  • MLA
  • CHICAGO
(Influence of Geography on Countries Destiny Assignment Example | Topics and Well Written Essays - 2000 words, n.d.)
Influence of Geography on Countries Destiny Assignment Example | Topics and Well Written Essays - 2000 words. https://studentshare.org/social-science/1852782-political-science-final-project
(Influence of Geography on Countries Destiny Assignment Example | Topics and Well Written Essays - 2000 Words)
Influence of Geography on Countries Destiny Assignment Example | Topics and Well Written Essays - 2000 Words. https://studentshare.org/social-science/1852782-political-science-final-project.
“Influence of Geography on Countries Destiny Assignment Example | Topics and Well Written Essays - 2000 Words”. https://studentshare.org/social-science/1852782-political-science-final-project.
  • Cited: 0 times

CHECK THESE SAMPLES OF Influence of Geography on Countries Destiny

Political and historic perspective of Poland

As history will show, events from the ng states would influence the course of Poland's history from peace time to wars with specific periods in each of these countries' histories, interconnected.... Together with the kingdoms of Bohemia and Hungary, Poland filled the area bounded by Germany, the Baltic, Russia and the Balkans, or, in the terms of physical geography, the basins of the Oder, Vistula and middle Danube....
4 Pages (1000 words) Essay

Piracy Control in High Seas

Coastal countries have much role to play in management of the menace through investing in navy and establishing maritime laws, which can be effective, and be acceptable by the international community.... Besides, countries should design and impose stringent fines and legal actions on the perpetrators of the vice whenever they are caught in order to discourage others who would be potential perpetrators.... Blacksell (2006, 169-171) shows that the oceans have been an integral part in human geography especially from the fact that the oceans occupy about 70% of the earth....
2 Pages (500 words) Essay

New Kind of Structure: Case of Pfizer

Though, the… To make sure that Pfizer once more progressed to a resilient position, it had to implement a plan to influence its human resources in an efficient way.... was confronted with an economic crisis with several of its most important drugs on the verge of patent expiry....
4 Pages (1000 words) Essay

Role of Religion and REN in Wells and Byrn

This essay stresses that certain religious, race-related, ethnicity, and nationality-based aspects influence an individual's or a society's future.... That is, religion in the form of god or superior power is shown to influence individuals or society and in a way their future....
5 Pages (1250 words) Essay

Management of IKEA in the USA

IKEA planned its operations in the three main regional markets of the Scandinavian countries, North America and Asia-Pacific region.... However, some emerging markets like India or the Gulf countries do not prefer ex-stores supplies or home assembly work.... It is seen that it has so far concentrated in the relatively more affluent countries of North America, Europe and Asia-Pacific region successfully.... … IKEA in the USA: Case Study in Global Marketing What has allowed IKEA to be successful with a relatively standardized product andproduct line in a business with strong cultural influence?...
3 Pages (750 words) Case Study
sponsored ads
We use cookies to create the best experience for you. Keep on browsing if you are OK with that, or find out how to manage cookies.
Contact Us