StudentShare
Contact Us
Sign In / Sign Up for FREE
Search
Go to advanced search...
Free

Intro to measurements and statistics - Essay Example

Cite this document
Summary
You select 20 epileptics from the 150 epileptics being treated at a nearby hospital and administer the drug to them. You record the number of…
Download full paper File format: .doc, available for editing
GRAB THE BEST PAPER95.8% of users find it useful
Intro to measurements and statistics
Read Text Preview

Extract of sample "Intro to measurements and statistics"

5) The following is a frequency distribution showing the amount of time it took a sample of employees to complete a certain job: (8pts)  Number of Days (x) Frequency(f)F(x) 2 1020 41768 5 1890 7 12849  40360 10 330Total: 37100662(a) Calculate the mean= 6.62 median= 1.0, mode 40, and range = 37. (6) Lets assume you are conducting an experiment to determine the effect of a new drug on the incidence of epileptic seizures. You select 20 epileptics from the 150 epileptics being treated at a nearby hospital and administer the drug to them.

You record the number of seizures in each of the 20 subjects for one month. The new drug is an example of a(n)= 20(1). 2pts(7) Lets assume you are conducting an experiment to determine the effect of a new drug on the incidence of epileptic seizures. You select 20 epileptics from the 150 epileptics being treated at a nearby hospital and administer the drug to them. You record the number of seizures in each of the 20 subjects for one month. The 20 subjects constitute frequency. 2pts (8) Lets assume you are conducting an experiment to determine the effect of a new drug on the incidence of epileptic seizures.

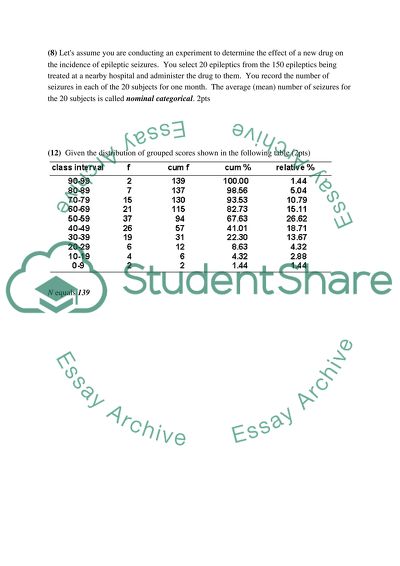
You select 20 epileptics from the 150 epileptics being treated at a nearby hospital and administer the drug to them. You record the number of seizures in each of the 20 subjects for one month. The average (mean) number of seizures for the 20 subjects is called nominal categorical. 2pts (12) Given the distribution of grouped scores shown in the following table (2pts)N equals 139 (13) Given the distribution of grouped scores shown in the following table (2pts) (17) Assume the following are scores in a 100-point achievement test: (12pts)a.

What is the range of the distribution? 58b.Since there is no definitive rule for determining how many class intervals to divide data into, one generally plays with the data or is told how many intervals to use. If you were told to group the above data into approximately 12 intervals of equal width, how wide would the class intervals be. 0 – 7 … 88 – 95 Using the value just calculated for I = 8.0 what would be the lower apparent limit of the lowest class interval? -0.5c.Using 12 intervals construct a table that shows the frequency distribution of grouped scores, the corresponding cumulative frequency distribution, and the corresponding cumulative percentage distribution.

Class IntervalsFrequencyCumulative Percentage0 – 703.58 – 15015.516 – 23023.524 – 31031.532 – 39239.540 – 47647.548 – 55455.556 – 631063.564 – 71471.572 – 79479.580 – 87787.588 - 95995.5 (20) What are the critical values of t for each of the following values of N and alpha using a non-directional hypothesis? (1pt each)N a.120.05b.200.01c.20.05d.50.02e.190.01Answer: cNow using a directional hypothesis?N f.130.025g.170.005h.80.05i.150.01j.100.05Answer: g.

Read More
Cite this document
  • APA
  • MLA
  • CHICAGO
(“Intro to measurements and statistics Essay Example | Topics and Well Written Essays - 500 words”, n.d.)
Intro to measurements and statistics Essay Example | Topics and Well Written Essays - 500 words. Retrieved from https://studentshare.org/psychology/1611200-intro-to-measurements-and-statistics
(Intro to Measurements and Statistics Essay Example | Topics and Well Written Essays - 500 Words)
Intro to Measurements and Statistics Essay Example | Topics and Well Written Essays - 500 Words. https://studentshare.org/psychology/1611200-intro-to-measurements-and-statistics.
“Intro to Measurements and Statistics Essay Example | Topics and Well Written Essays - 500 Words”, n.d. https://studentshare.org/psychology/1611200-intro-to-measurements-and-statistics.
  • Cited: 0 times

CHECK THESE SAMPLES OF Intro to measurements and statistics

Restaurants and Happiness/Life Satisfaction

For any human, satisfaction towards food is an crucial question and issue.... Does a man get proper food?... Is it with right nutritional value?... Is it caters to his satisfaction and worthwhile of money he paid.... Above all, does he get satisfaction ultimately both physically and mentally.... hellip; So there are so many parameters involved in the study of satisfaction towards food....
6 Pages (1500 words) Statistics Project

Repeated measures ANOVA analysis

The test about the subject effects carried out between postgraduate and undergraduate and high school and primary school on google academic and education levels had the following effects.... While comparing levels of education as table 1 shows that there was correlation between the… Meaning that the hypothesis that there is a difference is quite correct shown by the results....
3 Pages (750 words) Statistics Project

Statistical critique

Although this was fairly appropriate, the researcher should have made a clear distinction between the daily chores and the other non daily routines to ensure the accuracy of the statistics.... Hook (2010) used 36 time surveys collected from 19 countries during the period between 1965 and 2003....
4 Pages (1000 words) Statistics Project

Generic Business Strategies and Advantage of Tourist Companies

Basically, the statistics obtained from multiple regression models are applied in testing the hypotheses regarding the effects of individual independent variables on the dependent variable (Cryer and Chan, 2008).... The paper “Generic Business Strategies and Advantage of Tourist Companies” aims to measure the effects of the three predictor variables on the competitiveness of various companies in the tourism industry including museums, hotels and tour companies....
8 Pages (2000 words) Statistics Project

INTERPRETATION OF & ANALYSIS OF WORK-RELATED DATA

The table shows the share of long term debts will tend to rise if the size of the firm increases, since larger firms face higher corporate tax than small and upcoming firms.... The nominal three year… The results indicate the effects of normal interest of the overall use of debt.... Using the average tax incentives, increase in market interest by a marginal rate with a certain percentage increase like 10% The interest rate has an effect on the structure of corporate debt....
10 Pages (2500 words) Statistics Project

Predictability of Exchange Rate: USD and Yen

In the economic forefront, there have been various implications of statistics.... The regression model can be written as follows:The platform of social science in the modern world has encountered immense usefulness with the application of statistics and their useful tools in developing certain assumptions and inferences (Haferkamp & Smelser, 1992, p.... In the economic forefront, there have been various implications of statistics....
13 Pages (3250 words) Statistics Project

Modelling Approach to Determining Profitability in the Movie Industry between 2009 and 2011

"Modelling Approach to Determining Profitability in the Movie Industry between 2009 and 201" paper examines three basic queries that bear great importance for a distributor within the film industry.... It uses information gathered shortly after the release of the sample movies.... nbsp;… Considered per row from left to right, the associations between Cinemas Open Week and Worldwide Gross, Cinemas Open Week and Domestic Gross, and Cinemas Open Week and Foreign Gross were all relatively non-linear....
11 Pages (2750 words) Statistics Project

Flood Mathematical Models That Are Used In Flood Modelling

"Flood Mathematical Models That Are Used In Flood Modelling" paper argues that the use of hydrographs and the data provided on the Nash model provided information that is easy to extrapolated flood plain on base flow.... Other models have explored as future possible models for flood modeling.... hellip; The explored models can use base flow as well as direct runoff to generate hydrograph....
16 Pages (4000 words) Statistics Project
sponsored ads
We use cookies to create the best experience for you. Keep on browsing if you are OK with that, or find out how to manage cookies.
Contact Us